
Abstract
Fundamental knowledge of the electric arc properties is important for the development of process control of electric arc furnaces. In this work, a pilot-scale AC electric arc has been studied with optical emission spectroscopy together with filtered camera footage. The properties of the arcs were determined with plasma diagnostics and image analysis in order to obtain both the characteristic plasma parameters and the physical form of the arc. The plasma temperatures, ranging from 4500 to 9000 K, were derived individually for three elements. The electron densities of the plasma were between 1018 and 1020 cm−3 and fulfilled the local thermal equilibrium criterion, but the plasma temperatures derived from atomic emission lines for different elements had high and unpredictable differences. The properties of the electric arcs have been studied with respect to the arc length derived from the image analysis. The slag composition, especially the relative FeO content of over 30%, was observed to have a notable effect on the brightness of the arc on slag and thus also on the radiative heat transfer.
Export citation and abstract BibTeX RIS

Original content from this work may be used under the terms of the Creative Commons Attribution 3.0 licence. Any further distribution of this work must maintain attribution to the author(s) and the title of the work, journal citation and DOI.
1. Introduction
Interest in electric arc furnace (EAF) technology has increased during the past few decades due to lower CO2 emissions and easier controllability when compared to other steelmaking routes, e.g. blast furnaces. A common charge material in an EAF is recycled scrap metal along with slag formers. The usage of scrap metal instead of ore has been proposed to have a key role in reducing the resource use and pollution emissions [1]. Resource efficiency, together with the environmental aspects, emphasize the importance of EAF research. Furthermore, the EAF steelmaking route is becoming more important in the future due to the increase in both consumer recycling and industrial scrap use. The quality of scrap will inevitably decrease due to the higher recycling rate, requiring better knowledge on both the chemical composition of the scrap and the EAF process status. This causes a need for more sophisticated characterization for electric arcs and in situ monitoring of the furnace operation.
In an EAF, the charge is melted by applying high current into the electrodes of the furnace. A slag surface, consisting mainly of impurity components from the charge, forms on top of the molten metal bath due to the density difference between slag components and the metal. The energy of the electric arc is high enough for plasma formation [2], which in turn means that the arc properties can be studied with plasma diagnostics. Since the whole EAF melting process is governed by the effectivity of the electric arcs, information of the arc properties would help to determine the behavior of the arc in various process steps. Optical emission spectroscopy (OES) is a solution for the determination of both the electric arc properties and plasma characteristics because the electric arcs radiate throughout the furnace operation.
The electric arc itself is seldom measured, whereas the furnace atmosphere is monitored for example with off-gas analysis [3]. General industrial slags that have many common components with EAF slags have frequently been studied with laser-induced breakdown spectroscopy (LIBS) [4–14]. LIBS studies have also been performed for steel samples [15, 16] and varying solutions containing slag components [17, 18]. Recent studies with OES measurements, on the other hand, have demonstrated that the electric arc can be characterized by plasma diagnostics with OES, and that the spectra are dominated by atomic emissions from the slag [19, 20]. Plasma studies and discharge characterization including OES analysis have also been conducted for DC magnetron discharges [21, 22] and non-thermal low-power plasma [23]. The applicability of OES in different measurement environments makes it a very efficient analysis tool.
In this work, the plasma characteristics and the physical dimensions of the electric arcs have been determined for the first time in a pilot-scale AC EAF with OES and image analyses. The analysis has been carried out by studying the properties of the arcs with respect to the arc length. The length is the most important factor in describing the shape of the arc because it affects the core diameter of the arc [24] and how the arc interacts with the atmosphere. For example, when compared to shorter arcs with the same current, long arcs heat a smaller volume of the melt and hence a larger volume of the atmosphere is heated [25]. The slag composition has an effect on the plasma characteristics, and thus it been taken into account in the analysis. The results of this work have been compared to other electric arc and LIBS studies.
2. Experimental
OES measurements were carried out on a pilot-scale EAF at Aachen University, Germany. The measurement set-up consisted of the pilot-scale EAF, a spectrometer, a filtered camera, and a data acquisition computer. The capacity of the furnace was 200 kg and it was equipped with two graphite electrodes operating in an AC mode. The furnace can be used to mimic the most important EAF process steps, i.e. charging, boredown, melting, and flat bath period. A schematic illustration of the pilot-scale EAF with the view cone of the camera and spectrometer is presented in figure 1.
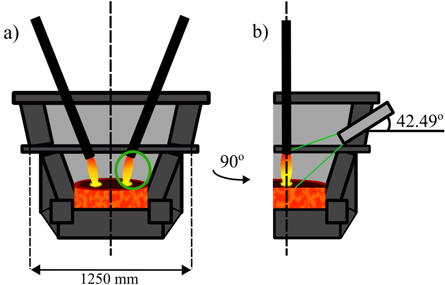
Figure 1. Schematic illustration of (a) the front view and (b) the side view of the pilot-scale AC EAF at Aachen University, Germany. The area that the camera and spectrometer see is marked in (a) with green circle. The viewing cone of the camera and spectrometer is marked in (b) with green lines.
Download figure:
Standard image High-resolution imageThe measurements were performed on two days, of which the first and second days are referred to as heat 1 (H1) and heat 2 (H2), respectively. For H1, the current was kept constant at 691 A and power varied in the range of 35 − 170 kW, whereas in H2 these values were 545 A and 35 − 215 kW. Various slag components were added into the furnace during the heats in order to study the effects of different slag composition on the plasma properties. Slag additions were made 3 and 10 times during H1 and H2, respectively. A slag sample (S) was taken after each addition of slag components in the end of a measurement period. The slag sample composition was analyzed with x-ray fluorescence (XRF). The XRF analyzed main slag components CaO, Cr2O3, FeO, MgO, Al2O3, and SiO2 are listed in table 1 for H1 and H2.
Table 1. Molar percentages of CaO, Cr2O3, FeO, MgO, Al2O3, and SiO2 of XRF-analyzed composition of slag samples.
| H | S | CaO | Cr2O3 | FeO | MgO | Al2O3 | SiO2 |
|---|---|---|---|---|---|---|---|
| 1 | 1 | 23.2 | 5.6 | 37.9 | 9.1 | 5.4 | 13.2 |
| 2 | 21.2 | 8.7 | 37.9 | 9.3 | 5.1 | 12.6 | |
| 3 | 18.0 | 6.0 | 39.3 | 9.7 | 12.3 | 10.4 | |
| 2 | 1 | 12.6 | 1.6 | 27.9 | 33.4 | 3.7 | 18.4 |
| 2 | 20.6 | 2.7 | 18.9 | 27.0 | 6.2 | 22.2 | |
| 3 | 23.2 | 3.4 | 19.3 | 24.1 | 6.6 | 20.7 | |
| 4 | 23.0 | 3.4 | 20.3 | 23.7 | 7.5 | 19.7 | |
| 5 | 23.1 | 3.2 | 19.9 | 22.5 | 6.1 | 22.9 | |
| 6 | 25.8 | 3.7 | 20.2 | 20.4 | 5.9 | 21.8 | |
| 7 | 27.1 | 4.8 | 21.2 | 18.8 | 6.1 | 19.9 | |
| 8 | 27.8 | 3.0 | 19.9 | 19.4 | 5.2 | 22.9 | |
| 9 | 31.0 | 2.9 | 19.6 | 17.9 | 5.1 | 21.6 | |
| 10 | 32.9 | 2.7 | 19.1 | 17.4 | 5.4 | 20.0 |
The camera was a Baumer SLR camera with a frame rate of 20 pictures per second and an exposure time of 50 ms. The camera looked through a 1 cm UV-transparent glass into the furnace and was filtered with three standard colored (green band-pass) welding filters. The images were analyzed with a Matlab based code to extract finer details from the electric arc, such as length, area, brightness, and position of the arc on the slag. The images were first converted to grayscale, and thus the pixel (px) brightness range is 0 − 255 (RGB averages).
An example of an arc image is presented in figure 2. The initiation point of the electric arc on the electrode was determined as a weighted average of the hot-spot on the electrode, whereas the spot at which the arc hits the slag surface as the weighted average of the glow from the slag. The length of the arc was approximated to be the distance between these two image coordinates. The area was estimated with an ellipse centered at the position of the arc on slag. Since the position of the arc on slag changes throughout the measurements, the same analysis method was used for all the arc images to determine the area of the arc on slag. Thus, the ellipse was set perpendicular with respect to the arc axis. The lengths of major and minor axes of the ellipse were determined so that the brightness of the pixels at the end of the axes had decreased to 90% of the brightness value at the center of the ellipse.

Figure 2. An example image of an arc with a length of 16.3 cm. Positions of the electrode and slag coordinates for the length analysis together with ellipse for the area analysis have been marked.
Download figure:
Standard image High-resolution imageThe arcs in the images are projections of the real arcs on the two-dimensional image, and thus the effects of the changing position of the arc to the length interpretation were taken into account by observing the stability of the length and position of the arc. The error caused by the image analysis was estimated to be 5% for the arc lengths. The origins of x- and y-axes were set to the left lower corner of the images. The height and width of the images are 520 and 696 pixels, respectively. As can be seen from figure 2, the arc moves away from the camera if the y-position of the arc on slag increases significantly. For arcs that have very high y-position, this effect will distort the length analysis. Thus, the time periods that were used to determine the properties of the arcs were selected so that the y-position of arc on slag was stable. For a video displaying the arc behavior in the pilot-scale AC EAF, see supplemental Video I available online at stacks.iop.org/PREX/1/035007/mmedia.
A Czerny-Turner spectrometer Avaspec-ULS2048 provided by Luxmet Oy was used in this study. The spectra were recorded at a rate of 20 spectra per second. The orientation of the measurement head was aligned with the camera before the measurements. The wavelength range of the spectrometer was 298.267 − 866.400 nm. The emission lines that were used in this study have been listed in table 2. The computer was used to store the data both from the camera and the spectrometer. The atomic emission lines were fitted with self-developed software designed to efficiently analyze a large number of spectra. The spectral data were analyzed by approximating the line profiles with Gaussian functions. An example spectrum from the pilot-scale EAF is presented in figure 3.
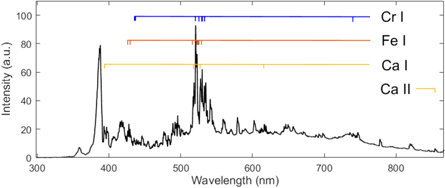
Figure 3. An example spectrum from the pilot-scale AC EAF. The emission lines from table 2 have been marked.
Download figure:
Standard image High-resolution imageTable 2. Cr I, Fe I, Ca I, and Ca II lines and line parameters for plasma analysis. Wavelengths λ are in nm, transition probabilities Aij in s−1, and upper and lower level energies Ei and Ej, respectively, in electron volts.
| Line | # | λ | Aij | Ej | Ei | gi |
|---|---|---|---|---|---|---|
| Cr I | 1 | 435.963 | 5.4E+06 | 0.982 9 | 3.826 0 | 5 |
| 2 | 436.313 | 1.6E+07 | 2.967 4 | 5.808 3 | 7 | |
| 3 | 520.844 | 5.1E+07 | 0.941 4 | 3.321 2 | 7 | |
| 4 | 524.756 | 1.9E+06 | 0.961 0 | 3.323 0 | 3 | |
| 5 | 529.669 | 3.1E+06 | 0.982 9 | 3.323 0 | 3 | |
| 6 | 529.829 | 3.3E+06 | 0.982 9 | 3.322 3 | 5 | |
| 7 | 532.834 | 6.2E+07 | 2.913 5 | 5.239 7 | 11 | |
| 8 | 740.021 | 1.4E+07 | 2.899 5 | 4.574 5 | 7 | |
| Fe I | 1 | 425.895 | 2.3E+05 | 3.017 6 | 5.927 9 | 9 |
| 2 | 429.804 | 1.2E+06 | 3.046 9 | 5.930 7 | 11 | |
| 3 | 516.628 | 1.5E+03 | 0.000 0 | 2.399 2 | 11 | |
| 4 | 522.719 | 2.9E+06 | 1.557 4 | 3.928 6 | 5 | |
| 5 | 523.539 | 3.8E+06 | 4.075 8 | 6.443 3 | 7 | |
| 6 | 524.249 | 2.4E+06 | 3.634 3 | 5.998 7 | 11 | |
| 7 | 528.179 | 5.0E+06 | 3.038 5 | 5.385 2 | 7 | |
| Ca I | 1 | 395.705 | 9.8E+06 | 1.885 8 | 5.018 2 | 3 |
| 2 | 518.885 | 4.0E+07 | 2.932 5 | 5.321 3 | 5 | |
| 3 | 526.556 | 4.4E+07 | 2.523 0 | 4.877 0 | 3 | |
| 4 | 616.376 | 5.6E+06 | 2.521 3 | 4.532 2 | 3 | |
| Ca II | 1 | 854.209 | 9.9E+06 | 1.699 9 | 3.151 0 | 4 |
3. Theoretical
All the variables and constants for equations are explained in table 3. As has been argued by C Aragón and J A Aguilera [26], the plasma temperature can be determined from Boltzmann plot

The term in the far right in (1) is constant at a fixed temperature, and can thus be neglected. Once the left-hand-side is plotted as a function of Ezu, a straight line with −(kT)−1 as a slope is expected. The plasma temperature can be determined by measuring the intensities of the emission lines, since  is proportional to the intensity of the emission line when it is assumed that plasma is in local thermal equilibrium (LTE) and the atmosphere is optically thin [26].
Table 3. Description of the variables and constants for (1)–(4).
| Variable | Description |
|---|---|
| z | Ionization state of the particle |
 z z |
Wavelength-integrated emissivity |
| n, j | Lower energy level |
| m, i | Upper energy level |
| λmn | Wavelength of the emission 
|
| gm | Degeneracy of the upper level |
| Amn | Transition probability for 
|
| k | Boltzmann constant |
| T | Plasma temperature (in K) |
| Ez | Energy of the upper level |
| Nz | Number density |
| Uz(T) | Partition function |
| q | Number of emission lines |
| δ/ |
General relative error of line intensity |
| δA/A | General relative error of transition probability |
| C |

|
| me | Mass of electron |
| h | Planck's constant |
| Iz | Intensity of emission line |
| Eion | Ionization energy of the ground state |
| ΔE | Energy difference between energy levels (in eV) |
The errors of the temperatures obtained from (1) can be estimated with

The general relative errors [27] δ/ and δA/A were estimated to be 10 and 20%, respectively. Due to varying quality of the spectra caused by altering plasma conditions and shape of the electric arc, only the temperatures with the coefficient of determination, R2, exceeding 0.85 were taken into the plasma analysis.
Electron density of the plasma, which can be used to evaluate the LTE condition, has been determined with Saha-Boltzmann equation [26]. If correction term of ionization energy is neglected, the Saha-Boltzmann equation can be derived into

The correction term of ionization energy takes into account the lowering of ionization energy due to electric microfields [28]. Since its value is significantly smaller than the actual ionization energy of any atom, it can safely be approximated to zero for the scope of this study.
The requirement for LTE, stating that the rate of collisional processes in plasma is at least 10 times the rate of radiative processes, follows the McWhirter criterion [26, 29]

The right-hand side of the (4) is referred to as NLTE. Another indicator for the fulfillment of the LTE criterion is that plasma temperatures derived from different elements agree with each other [26], and this temperature agreement has been taken into account in the analysis. Other parameters than line intensities and natural constants in (1)–(4) have been acquired from NIST Atomic Spectra Database [30].
Plasma temperatures were determined with Cr I, Fe I, and Ca I emission lines using (1), and electron densities with Ca I and Ca II emission lines using Cr I temperatures and (3). All of these elements are frequently present in both the laboratory and industrial EAF slag components and have prominent emission lines in the visible region. Furthermore, only calcium has distinguishable emission lines from singly ionized atoms in the EAF spectra, which is a requirement for (3). However, calcium has its downsides in plasma analysis, since it has been observed to be prone to self-absorption in LIBS measurements [26]. In our work, this effect was seldom seen only in the Ca II lines near ultra-violet range.
The heat and sample specific emission lines that were used for plasma temperature analysis are listed in table 4. The number of emission lines was restricted to five most stable lines, because including more lines to the Boltzmann plots in (1) substantially decreased the R2 values of the plots. The ideal case would be that all the emission lines in the spectral range of the spectrometer would be analyzed, from which the plasma analysis lines could be selected. However, the vast amount of emission lines and spectra obliges to choose several wavelength sub-ranges from the spectra that are analyzed. Thus, some of the suitable emission lines for plasma analysis might not have been analyzed in this study. The most important aspect was to find out temperatures with high R2 rather than analyze the temperatures with the highest amount of emission lines possible. Low amount of emission lines, however, yields into higher errors, as can be seen from (2). The errors for Fe and Cr temperatures were usually below 10 and 15%, respectively, whereas Ca temperatures had errors larger than 20%.
Table 4. Emission lines that were used for plasma temperature analysis. The listed numbers refer to the emission line numbers under column # in table 2.
| H | S | Cr I | Fe I | Ca I |
|---|---|---|---|---|
| 1 | 1 | 1, 2, 3, 6, 8 | 1, 2, 3, 4, 6 | 1, 2, 3, 4 |
| 2 | 1, 2, 3, 6, 8 | 1, 2, 3, 4, 6 | 1, 2, 3, 4 | |
| 3 | 1, 2, 3, 8 | 1, 2, 3, 4, 6 | 1, 2, 3, 4 | |
| 2 | 1 | 4, 5, 6, 7, 8 | 2, 3, 4, 5, 7 | Not valid |
| 2 | 4, 5, 6, 7, 8 | 2, 3, 4, 5, 7 | Not valid | |
| 3 | 4, 5, 6, 7, 8 | 2, 3, 4, 5, 7 | Not valid | |
| 4 | 4, 5, 6, 7, 8 | 2, 3, 4, 5, 7 | Not valid | |
| 5 | 4, 5, 6, 7, 8 | 2, 3, 4, 5, 7 | Not valid | |
| 6 | 4, 5, 6, 7, 8 | 2, 3, 4, 5, 7 | Not valid | |
| 7 | 4, 5, 6, 7, 8 | 2, 3, 4, 5, 7 | Not valid | |
| 8 | 4, 5, 6, 7 | 2, 3, 4, 5, 7 | Not valid | |
| 9 | 4, 5, 6, 7 | 2, 3, 4, 5, 7 | Not valid | |
| 10 | 4, 5, 6, 7 | 2, 3, 4, 5, 7 | Not valid |
As can be seen from the table 4, the emission lines had to be changed between heats and, in case of Cr I, even between samples. These changes were associated with the highly varying relative amounts of Cr2O3, FeO, and CaO in the slag between heats and samples as shown in the table 1. The optimal situation would be that the same set of emission lines would be viable for all slag compositions, but this proved to be very hard with fluctuating slag composition. In this study, the slag composition was intentionally changed radically between heats, because weak emission lines are hard to be observed in low concentrations, whereas very intensive emission lines tend to be self-absorbed in high concentrations.
4. Results and discussion
An example graph that was used in the analysis is provided in figure 4. The graph displays a 5-minute measurement of H1 S1. The arc length is stable between 50 and 150 s and the shortening in the arc length around 70 s is related to the decreasing x-position of the arc on slag. The electrode is manually plunged into the slag and then lifted up between 150 and 200 s, after which the arc length is not as stable as before. The Cr temperature is stable both before and after the plunge, but Fe and Ca temperatures are more irregular, especially after the plunge. The time periods during which stable arc lengths were observed ranged from 5 to 90 s. Longer time periods were not observed, which was mainly caused by manual changes in electrode height during measurements.

Figure 4. Arc properties and plasma diagnostics for H1 S1.
Download figure:
Standard image High-resolution image4.1. Plasma characterization
The arc properties with respect to the arc length are displayed in figure 5 for H1. The values have been presented as averages with 0.5 cm interval beginning from 2.5 cm and ending to 26 cm for better display. The electron densities Ne have been derived with Ca I 1 and Ca II 1 lines in the table 2 using Cr temperatures. No matter what Ca I lines were used for electron density, the electron densities were several magnitudes above the LTE criterion density. For complete tabulated values that were used for the averaged values in the figure 5, see appendix table A1.
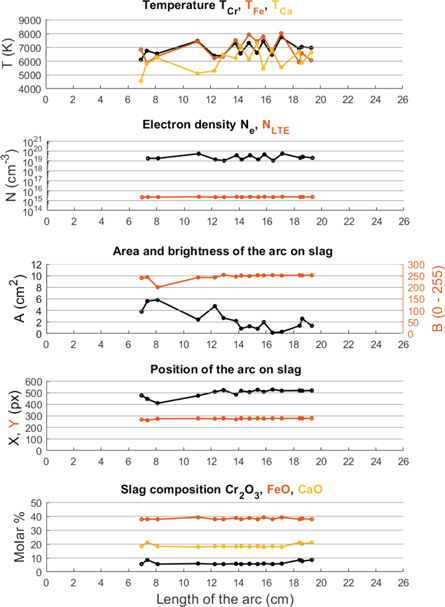
Figure 5. Arc properties with respect to the arc length on H2. The values have been displayed as 0.5 cm averages.
Download figure:
Standard image High-resolution imageFor H1, only three periods with arc length shorter than 10 cm were observed. The lack of stable short arcs in H1 can be reasoned with the very high brightness of the arc on slag, which causes excessive glow on the slag distorting the length analysis. The high overall brightness of over 200 can also be observed in figure 5. Visual inspection of the H1 arc images shows that the glow from the slag for short arcs is so intense, that the bright electrode, the arc, and the hit position of the arc on slag sometimes merge together. As can be seen from the table 1, H1 has very high FeO content. Iron has hundreds of emission lines in the visible region, which contributes a lot to the general brightness of the arc. In H2, where the FeO content is lower than 30%, such problems were not encountered. The major effect of FeO content in the slag to the overall brightness of the plasma column and the area on the slag can be explained by the relatively high concentration of metal vapor in the arc plasma, which increases the radiative heat transfer, emissivity, and conductivity of the plasma column [31, 32].
Very high differences of 2000 K between Cr and Ca temperature are usually observed when Ne is over 4 × 1019 cm−3 in H1. However, when Ne is this high, Fe temperature is usually close to or higher than Cr temperature. This indicates that higher Ne results into self-absorption of Ca lines, whereas the Fe I and Cr I emission lines do not show prominent signs of self-absorption. For some arcs the Ne cannot be determined reliably indicating a disturbance in Ca lines. The highest temperature differences for H1 occur between 12 and 20 cm, for which the brightness of the arc on slag is near its maximum value of 255. The stable high brightness with respect to increasing arc length between 12 and 20 cm suggests that the oxides on the slag surface evaporate at high rates for these arc lengths. The fluctuation of plasma temperatures can be reasoned by the varying arc area on slag and different evaporation ratios between Cr2O3, FeO, and CaO.
As can be observed from the appendix table A1, the electron densities for H1 S3 are around 4–5 × 1019 cm−3, whereas around 1–2 × 1019 cm−3 for S1 and S2. High plasma temperatures around 7000 and 8000 K are observed for Cr and Fe in S3, whereas they are mostly in the range of 5000 and 7000 K for S1 and S2. The number of Cr I lines for plasma temperatures was decreased from five to four between S2 and S3, whereas the number of Fe I and Ca I lines was constant. Regardless of the change in the number of Cr I lines, Fe temperatures are near Cr temperature in S3 while Ca temperatures remain in the range between 5000 and 6000 K in S3. For a better temperature agreement between Cr, Fe, and Ca temperatures, an electron density lower than 1 × 1019 cm−3 is required. However, electron density values higher than 4 × 1019 cm−3 result into better temperature agreement between Cr and Fe temperatures. The low Ca temperatures between 4000 and 6000 K suggest that Ca I radiation originates from the surface of the plasma cone, where the plasma temperature is lower than in the center.
For H1, the highest fluctuations in temperatures occur when the area of the arc on slag is less than 2 cm2 and arc length between 14 and 18 cm. Since the brightness and position of the arc on slag do not fluctuate much and the spectra are dominated by the emission lines from the slag, the effect of changing area of the arc on slag to the temperature differences is rational. When compared to a large area of the arc on slag, lower area suggests that the energy from the arc concentrates on a smaller surface on the slag. Thus, the evaporation ratios from the slag are higher due to higher energy per area and the plasma becomes more dense, which is a suitable condition for self-absorption and an increase in the optical thickness of the plasma.
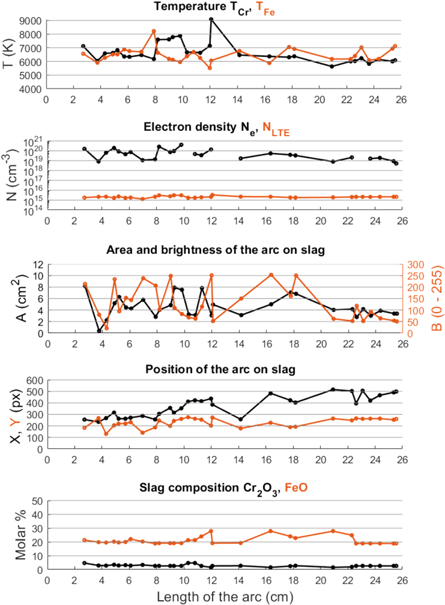
The arc properties with respect to the arc length are displayed in figure 6 for H2. The criteria for length averaging and plasma parameters are the same as in the description of the figure 5 for H1. In comparison with H1, Ca temperatures could not be determined for H2 with reliable R2 values for Boltzmann plots using (1). This is linked to the increase in the relative CaO content in the slag for S6—S10, as can be seen from the table 1. However, Ca temperatures were not viable also for S1—S5, which was associated with the high electron densities of over 2 × 1019 cm−3. For complete tabulated values that were used for the averaged values in the figure 6, see appendix table A2.
Figure 6. Arc properties with respect to the arc length on H2. The values have been displayed as 0.5 cm averages.
Download figure:
Standard image High-resolution image
In this study, all the arc lengths of over 20 cm were observed in H2 S2. Fe temperature usually exceeds Cr temperature for arcs longer than 20 cm, for which both the area and brightness of the arc on slag have decreased when compared to the shorter arc lengths. As can be seen from the figure 6, Ne values for all of the arcs longer than 20 cm cannot be determined and the plasma temperatures are close to one another only occasionally. In H2, an overall gradual decrease in the electron density is observed with increasing arc length. Long arcs heat up a larger volume of the atmosphere, as stated by Paik et al [25], which could mean that also the electron density drops as a smaller volume of the slag surface is heated and evaporated into the plasma column. The brightness and the area of the arc on slag are more stable for these long arcs when compared to shorter arcs, meaning that the energy distribution of the arc on slag is more stable. This indicates that for a given slag composition, the radiative properties of these long arcs are nearly the same.
In H2, the brightness and area of the arc on slag are not as stable as in H1. The lower and fluctuating brightness of H2 is related to the lower FeO amount in the slag, as can be observed from the table 1. This difference also explains why the area of the arc on slag has no effect to the behavior of the plasma temperatures. However, the temperature differences between Cr and Fe have a fluctuating trend below electron density 4 × 1019 cm−3. This resembles the case that was observed in H1. Between Ne 4 × 10¹⁹ and 1 × 1020 cm−3, nearly all temperature differences between Cr and Fe are within ±600 K. The major exceptions are from S10, for which Cr temperatures are over 7400 K and Fe temperatures around 6000 and 6500 K. Above electron densities of 1 × 1020 cm−3, the temperature differences are usually high.
For H2, the position coordinates of the arc on slag increase from 8 to 26 cm, but get low at 14 and 18 cm. This means that the arc is closer to the left lower corner of the viewing cone of the camera and that the electrode is relatively high. A rise in Fe temperature compared to Cr temperature can be observed at these instances. It is very likely that the higher Fe temperature arises from only partial line of sight visibility of the arc since the arc tends to be partially outside of the viewing cone with low position coordinates. This affects the received light emissions and thus also the quality of the spectra.
Generally, the plasma parameters are dependent on the chemical composition of the slag and the line of sight visibility of the arc, but not the arc length. An exception to this is the electron density, which gradually decreases with increasing arc length if the FeO content of the slag is lower than 30%. If the slag has higher FeO content, the contribution of the metal vapor in the plasma decreases the effect of the arc length to the electron density. Also the behavior of the brightness and area of the arc on slag have strong dependence on the composition of the slag, whereas the position coordinates of the arc on slag surface tend to increase with increasing arc length. For the coordinates of the arc on slag in this study, see figure 1.
4.2. Comparison to other electric arc studies and LIBS
The electric arcs in general have been studied extensively due to their applicability e.g. in plasma arc cutting and welding. Spectroscopic studies including metal vapor in the arc column display plasma temperatures and electron densities in the ranges of 5000–8000 K and 1015–1016 cm−3, respectively, depending on the current [33]. A study regarding plasma arc cutting studied with OES presented that the plasma temperature in the center of the column can reach over 20000 K, whereas outside the center the plasma temperatures are roughly between 7000 and 8000 K [34]. Also higher overall temperatures between 12000 and 19000 K have been analyzed with spectroscopic methods [35]. The arcs can also be operated under a specific gas atmosphere, and a study of an arc under argon atmosphere had plasma temperatures in the range of 5000–9000 K at the edges of plasma column and over 20000 K at the center with electron densities around 1017 cm−3 [36].
The computational studies on electric arcs support the plasma temperature profile in which the plasma has high temperatures of over 15000 K in the center and lower temperatures away from the center [37, 38], to which one study gives also experimental validation [39]. The plasma temperatures closest to the EAF plasma results are the ones with metal vapor inside the plasma arc, which is also the case in EAF plasma. The high electron densities exceeding 1018cm−3 in an EAF plasma are expectable, since the evaporation ratios from the molten metal bath are high, and the low plasma temperatures between 5000 and 10000 K can be linked to cooling effects caused by the metal vapors e.g. via an increase in electrical conductivity of the arc [32]. Furthermore, plasma temperatures in an industrial EAF have been measured by Aula et al, where the majority of the plasma temperatures with good accuracy are between 5000 and 9000 K [20].
Regarding the EAF spectroscopy research, the methods and data analysis of LIBS are close to the ones used in OES. As demonstrated in various studies, the plasma temperature of LIBS measurements on solid metallurgical slags are usually well beyond 10000 K and electron densities range mostly from 1016–1018 cm−3 [4–8, 10–18]. LIBS spectra usually have many emission lines from ionized elements that are not observed in EAF spectra, with the exception of distinguishable Ca II lines in EAF spectra. This can be reasoned with higher plasma temperatures of LIBS experiments when compared to EAF plasma. Several experiments by Fu et al have demonstrated applicability of LIBS in studying metallurgical slag samples [14] and both stainless and heat resistant steel samples [15, 16]. In situ steel melt analysis with LIBS in industrial steel plant has also been carried out, providing plasma temperatures around 11000K [9]. It has also been suggested that LIBS could be used as on-line tool for process control in vacuum devices [40] and raw material analysis [41]. However, it has been stated by Z. Wang et al that long-term stability and durability together with the focusing of the laser beam of LIBS equipment are hard to achieve in industrial conditions [42].
One of the advantages of the OES measurements directly from the EAF arc plasma is that an external excitation source is not required. This aspect significantly simplifies the measurement equipment, since only the optical fiber needs to be well aligned and focused. OES has already been evaluated for EAF process condition monitoring [19], and the viability in industrial steel plant has been established [20]. The results of the pilot-scale AC EAF measurements with OES can be used to evaluate the industrial data in future experiments, since camera footage of the arc will not be available in industrial steel plants. Furthermore, the experimental EAF plasma characterization is beneficial also from the computational point of view, to which the unpredictable plasma fluctuation, plasma properties with respect to the length of the arc, and the effect of slag composition to the radiative behavior of the arc on slag provide new insights.
5. Conclusions
In the present work, the physical properties and plasma characteristics of electric arcs in a pilot-scale AC electric arc furnace have been studied with image analysis and optical emission spectroscopy. The plasma temperatures were in the range of 4500 and 9000 K, and the electron densities between 1018 and 1020 cm−3. It was found out that the plasma is in local thermal equilibrium according to the evaluation of electron density. However, the plasma temperatures derived individually from the emission lines of chromium, iron, or calcium can have large variability. These differences were observed to be frequent and unpredictable. In some arc conditions the electron density values could not be determined reliably. The lack of reliable calcium plasma temperatures was associated with high relative CaO content in slag and self-absorption of calcium emission lines, especially with high electron densities of over 2 × 1019 cm−3. Chromium and iron temperatures were observable with electron densities larger than 2 × 1019 cm−3, but the temperature differences were high when electron density exceeded 1 × 1020 cm−3. The relatively low plasma temperatures and high electron densities of EAF plasma were linked to the presence of metal vapors in the arc evaporated from the melt.
The line of sight visibility of the arc had a distorting effect on the spectra when the arc was only partially in the viewing cone of the camera and spectrometer. High FeO content in slag was observed to have a significant effect on the brightness of the arc and thus also to the radiative heat transfer. In the image analysis, very intensive brightness of the arc on slag was observed for slag FeO content of over 35%, whereas the brightness was not as prominent for slag FeO content less than 30%. Highest fluctuations in the area and brightness of the arc on slag were observed for arc lengths shorter than 10 cm. For arc lengths between 20 and 26 cm, the brightness and area of the arc on slag were observed to be relatively stable for a given slag composition, indicating constant radiative properties of the arc on slag.
The observations from the plasma analysis support the feasibility of optical emission spectroscopy for versatile EAF plasma characterization. The demand for more profound process modeling and control for industrial EAFs sets high requirements for both the experimental and theoretical research objectives. Thus, it is very important to improve the understanding of the behavior and the plasma properties of the electric arcs. This work serves as experimental validation of OES for EAF plasma studies using simple measurement equipment with nominal maintenance requirements for industrial applications.
Acknowledgments
We wish to acknowledge the support of Research Fund for Coal and Steel under grant agreement No. 709923 and Academy of Finland for Genome of Steel grant No. 311934. We are grateful to Luxmet Oy for providing us the spectrometer and the OES analysis software.
Appendix
Table A1. Characteristic values for electric arcs in H1. Length L is in cm, x and y in px, area A in cm2, brightness B in RGB averages, Cr T, Fe T, and Ca T in K followed by error in%, electron densities Ne and NLTE in cm−3, and Cr2O3, FeO, and CaO slag contents in%. The values have been sorted with increasing arc length.
| S | L | x, y | A | B | Cr T | Fe T | Ca T | Ne | NLTE | Cr2O3 | FeO | CaO |
|---|---|---|---|---|---|---|---|---|---|---|---|---|
| 1 | 6.9 | 478, 269 | 3.8 | 240 | 6 097.4, 7.5 | 6 849.0, 5.2 | 4 546.5, 25.2 | — | 2.19E+15 | 5.6 | 37.9 | 18.3 |
| 2 | 7.4 | 447, 263 | 5.6 | 244 | 6 762.6, 8.9 | 5 898.9, 5.2 | 5 833.5, 29.1 | 1.82E+19 | 2.30E+15 | 8.7 | 37.9 | 21.2 |
| 1 | 8.1 | 410, 275 | 5.8 | 200 | 6 550.3, 8.2 | 6 347.2, 6.0 | 6 247.4, 31.0 | 1.86E+19 | 2.26E+15 | 5.6 | 37.9 | 18.3 |
| 3 | 11.0 | 475, 277 | 2.4 | 243 | 7 479.5, 11.5 | 7 429.7, 10.1 | 5 111.2, 25.6 | 5.39E+19 | 2.42E+15 | 6.0 | 39.3 | 18.0 |
| 1 | 12.2 | 515, 278 | 5.2 | 251 | 6 536.7, 8.2 | 6 143.8, 4.9 | –, – | 1.64E+19 | 2.26E+15 | 5.6 | 37.9 | 18.3 |
| 1 | 12.3 | 502, 274 | 4.3 | 234 | 6 269.7, 8.2 | 6 313.0, 5.0 | 5 300.4, 33.3 | 1.12E+19 | 2.22E+15 | 5.6 | 37.9 | 18.3 |
| 1 | 12.9 | 524, 279 | 2.7 | 254 | 6 414.4, 7.9 | 6 322.9, 5.1 | 6 458.5, 35.4 | 1.07E+19 | 2.24E+15 | 5.6 | 37.9 | 18.3 |
| 1 | 13.8 | 528, 279 | 0.3 | 254 | 6 453.8, 7.9 | 6 681.1, 5.7 | 6 819.5, 36.4 | 1.17E+19 | 2.25E+15 | 5.6 | 37.9 | 18.3 |
| 3 | 13.8 | 461, 267 | 3.1 | 240 | 7 747.6, 11.4 | 8 099.0, 9.8 | 6 087.9, 31.0 | 4.73E+19 | 2.46E+15 | 6.0 | 39.3 | 18.0 |
| 3 | 13.9 | 466, 267 | 3.2 | 246 | 7 807.8, 11.4 | 7 807.7, 9.8 | 5 787.1, 30.3 | 5.23E+19 | 2.47E+15 | 6.0 | 39.3 | 18.0 |
| 1 | 14.1 | 526, 279 | 0.9 | 254 | 6 470.1, 8.0 | 6 641.3, 5.5 | 6 555.3, 35.4 | 1.02E+19 | 2.25E+15 | 5.6 | 37.9 | 18.3 |
| 1 | 14.3 | 508, 278 | 0.8 | 247 | 6 652.7, 8.2 | 7 412.5, 7.2 | 7 637.2, 41.8 | 1.59E+19 | 2.29E+15 | 5.6 | 37.9 | 18.3 |
| 1 | 14.5 | 511, 278 | 0.5 | 248 | 6 671.4, 8.2 | 7 750.0, 8.0 | 7 239.7, 41.1 | 1.59E+19 | 2.28E+15 | 5.6 | 37.9 | 18.3 |
| 1 | 14.7 | 512, 278 | 0.7 | 248 | 6 618.5, 8.2 | 6 979.6, 6.7 | 6 892.6, 40.4 | 5.04E+19 | 2.47E+15 | 5.6 | 37.9 | 18.3 |
| 3 | 14.8 | 497, 274 | 2.3 | 251 | 7 769.0, 10.9 | 7 942.1, 10.2 | 5 667.8, 29.8 | 4.89E+19 | 2.47E+15 | 6.0 | 39.3 | 18.0 |
| 3 | 14.8 | 475, 268 | 3.4 | 240 | 7 781.1, 10.9 | 7 947.4, 10.0 | 5 784.9, 29.2 | 1.64E+19 | 2.29E+15 | 6.0 | 39.3 | 18.0 |
| 1 | 14.8 | 517, 278 | 0.5 | 247 | 6 703.3, 8.3 | 8 264.6, 7.4 | 7 353.8, 39.8 | 5.21E+19 | 2.46E+15 | 5.6 | 37.9 | 18.3 |
| 3 | 14.9 | 515, 278 | 0.6 | 253 | 7 767.6, 10.8 | 8 341.3, 10.6 | 5 474.8, 29.1 | 4.92E+19 | 2.43E+15 | 6.0 | 39.3 | 18.0 |
| 3 | 14.9 | 517, 279 | 0.3 | 251 | 7 541.2, 10.5 | 8 000.8, 9.9 | 5 294.1, 27.1 | 5.02E+19 | 2.47E+15 | 6.0 | 39.3 | 18.0 |
| 3 | 14.9 | 506, 276 | 1.8 | 252 | 7 788.4, 10.9 | 8 289.2, 10.5 | 5 422.3, 29.3 | 1.39E+19 | 2.28E+15 | 6.0 | 39.3 | 18.0 |
| 1 | 15.4 | 527, 278 | 0.8 | 252 | 6 609.7, 8.1 | 7 442.4, 6.7 | 7 324.8, 37.6 | 4.96E+19 | 2.43E+15 | 5.6 | 37.9 | 18.3 |
| 3 | 15.8 | 505, 275 | 1.2 | 249 | 7 528.1, 11.9 | 7 634.6, 9.4 | 5 262.0, 26.0 | 4.10E+19 | 2.40E+15 | 6.0 | 39.3 | 18.0 |
| 3 | 15.9 | 512, 278 | 2.8 | 254 | 7 384.3, 10.3 | 7 958.8, 8.5 | 5 656.8, 28.3 | 1.09E+19 | 2.25E+15 | 6.0 | 39.3 | 18.0 |
| 1 | 16.5 | 528, 279 | 0.1 | 253 | 6 468.2, 8.0 | 6 698.0, 5.7 | 6 814.3, 37.0 | 5.53E+19 | 2.46E+15 | 5.6 | 37.9 | 18.3 |
| 3 | 17.1 | 518, 279 | 0.3 | 251 | 7 756.3, 10.8 | 8 042.9, 10.4 | 5 552.2, 29.7 | 2.07E+19 | 2.33E+15 | 6.0 | 39.3 | 18.0 |
| 2 | 18.4 | 520, 279 | 1.4 | 252 | 6 911.3, 8.5 | 5 921.1, 5.3 | 6 711.4, 34.3 | 1.39E+19 | 2.28E+15 | 8.7 | 37.9 | 21.2 |
| 2 | 18.5 | 512, 277 | 5.7 | 249 | 6 636.5, 8.2 | 5 841.0, 5.1 | 6 416.0, 33.8 | 1.47E+19 | 2.30E+15 | 8.7 | 37.9 | 21.2 |
| 2 | 18.6 | 522, 279 | 1.7 | 253 | 6 765.3, 8.3 | 5 865.6, 5.2 | 5 977.0, 32.7 | 5.03E+19 | 2.46E+15 | 8.7 | 37.9 | 21.2 |
| 3 | 18.7 | 518, 279 | 0.4 | 252 | 7 720.6, 10.8 | 8 066.5, 10.0 | 5 209.0, 27.7 | 1.94E+19 | 2.33E+15 | 6.0 | 39.3 | 18.0 |
| 2 | 19.2 | 518, 278 | 2.8 | 252 | 6 943.0, 8.6 | 5 917.3, 5.5 | 6 505.0, 32.7 | 2.20E+19 | 2.34E+15 | 8.7 | 37.9 | 21.2 |
| 2 | 19.3 | 520, 279 | 1.4 | 253 | 7 007.9, 8.7 | 6 062.5, 5.6 | 6 556.2, 33.2 | 2.02E+19 | 2.35E+15 | 8.7 | 37.9 | 21.2 |
| 2 | 19.4 | 521, 279 | 0.5 | 252 | 7 042.7, 8.7 | 6 116.7, 5.6 | 6 745.8, 33.5 | 2.01E+19 | 2.33E+15 | 8.7 | 37.9 | 21.2 |
| 2 | 19.5 | 520, 241 | 0.6 | 251 | 6 925.4, 8.5 | 6 161.6, 6.0 | 6 722.7, 36.6 | 2.01E+19 | 2.33E+15 | 8.7 | 37.9 | 21.2 |
Table A2. Characteristic values for electric arcs in H2. Length L is in cm, x and y in px, area A in cm2, brightness B in RGB averages, Cr T and Fe T in K followed by error in%, electron densities Ne and NLTE in cm−3, and Cr2O3 and FeO slag contents in%. The values have been sorted with increasing arc length.
| S | L | x, y | A | B | Cr T | Fe T | Ne | NLTE | Cr2O3 | FeO |
|---|---|---|---|---|---|---|---|---|---|---|
| 7 | 2.7 | 255, 183 | 8.2 | 214 | 7 118.3, 11.0 | 6 565.1, 15.6 | 1.59E+20 | 1.82E+15 | 4.8 | 21.3 |
| 8 | 3.5 | 240, 271 | 0.3 | 77 | 5 926.1, 9.3 | 5 949.1, 15.8 | 1.19E+19 | 2.15E+15 | 3.0 | 19.9 |
| 8 | 4.0 | 230, 264 | 0.4 | 82 | 6 139.0, 9.5 | 5 868.4, 15.5 | 4.79E+18 | 2.19E+15 | 3.0 | 19.9 |
| 9 | 4.1 | 267, 129 | 2.3 | 19 | 6 579.6, 9.9 | 6 294.8, 12.0 | 4.55E+19 | 2.24E+15 | 2.9 | 19.6 |
| 9 | 4.5 | 269, 132 | 2.1 | 22 | 6 598.5, 10.3 | 6 240.6, 11.9 | 8.28E+19 | 2.22E+15 | 2.9 | 19.6 |
| 3 | 4.8 | 294, 219 | 5.6 | 214 | 6 324.3, 11.0 | 6 906.5, 13.5 | 2.00E+19 | 1.90E+15 | 3.4 | 20.3 |
| 6 | 5.0 | 338, 191 | 4.7 | 254 | 6 919.9, 11.3 | 6 115.3, 12.3 | 3.71E+20 | 1.51E+15 | 3.7 | 20.2 |
| 3 | 5.1 | 284, 218 | 5.8 | 229 | 6 198.1, 11.4 | 6 876.3, 13.5 | 2.00E+19 | 2.20E+15 | 3.4 | 20.3 |
| 8 | 5.1 | 274, 233 | 5.2 | 58 | 6 535.7, 10.1 | 5 931.6, 11.3 | 1.72E+19 | 2.26E+15 | 3.0 | 19.9 |
| 9 | 5.2 | 256, 146 | 4.3 | 36 | 6 309.7, 9.8 | 6 689.9, 10.2 | 3.55E+16 | 2.22E+15 | 2.9 | 19.6 |
| 10 | 5.2 | 230, 238 | 9.3 | 46 | 7 921.3, 11.9 | 6 464.7, 11.9 | 2.91E+20 | 3.15E+15 | 2.7 | 19.1 |
| 10 | 5.3 | 217, 264 | 6.4 | 45 | 7 476.8, 11.6 | 6 274.3, 13.5 | 9.42E+19 | 2.90E+15 | 2.7 | 19.1 |
| 5 | 5.4 | 317, 217 | 6.5 | 152 | 6 497.0, 10.9 | 6 882.6, 14.3 | 9.60E+19 | 1.42E+15 | 3.2 | 19.9 |
| 5 | 5.5 | 231, 254 | 3.6 | 97 | 6 271.6, 10.8 | 6 888.4, 14.7 | 2.23E+19 | 1.46E+15 | 3.2 | 19.9 |
| 5 | 5.6 | 232, 256 | 5.1 | 147 | 6 113.1, 10.4 | 7 058.3, 14.1 | 3.08E+19 | 1.46E+15 | 3.2 | 19.9 |
| 9 | 5.6 | 300, 188 | 3.0 | 25 | 6 057.3, 9.5 | 6 423.7, 14.7 | 9.04E+18 | 2.18E+15 | 2.9 | 19.6 |
| 9 | 5.7 | 220, 249 | 1.1 | 178 | 6 807.1, 10.6 | 6 434.0, 14.4 | 3.03E+19 | 2.31E+15 | 2.9 | 19.6 |
| 3 | 5.8 | 243, 236 | 1.6 | 241 | 6 149.0, 10.4 | 7 075.1, 12.7 | 1.84E+19 | 1.68E+15 | 3.4 | 20.3 |
| 4 | 5.8 | 315, 152 | 9.7 | 242 | 6 535.2, 10.6 | 7 147.8, 14.2 | 1.57E+19 | 1.29E+15 | 3.4 | 20.3 |
| 6 | 6.0 | 296, 208 | 7.0 | 142 | 6 581.7, 10.7 | 7 091.3, 16.0 | 1.91E+20 | 1.46E+15 | 3.7 | 20.2 |
| 4 | 6.0 | 246, 260 | 0.8 | 246 | 6 216.2, 10.4 | 6 878.8, 12.7 | 3.25E+18 | 2.04E+15 | 3.4 | 20.3 |
| 5 | 6.1 | 305, 230 | 7.5 | 145 | 6 587.6, 10.9 | 6 967.8, 13.8 | 2.65E+20 | 1.43E+15 | 3.2 | 19.9 |
| 1 | 6.1 | 294, 259 | 1.3 | 81 | 6 393.2, 9.4 | 6 353.2, 11.3 | 2.26E+19 | 2.24E+15 | 1.6 | 27.9 |
| 4 | 6.2 | 241, 179 | 7.4 | 103 | 6 147.6, 11.6 | 6 834.6, 14.2 | 9.27E+18 | 1.62E+15 | 3.4 | 20.3 |
| 4 | 7.0 | 287, 141 | 5.8 | 238 | 6 467.8, 10.6 | 6 700.0, 14.5 | 1.13E+19 | 1.30E+15 | 3.4 | 20.3 |
| 2 | 7.9 | 256, 187 | 2.8 | 206 | 6 180.1, 10.3 | 8 221.0, 14.4 | 1.35E+19 | 2.20E+15 | 2.7 | 18.9 |
| 10 | 8.2 | 304, 247 | 4.0 | 103 | 7 595.3, 11.7 | 6 632.0, 13.1 | 2.64E+20 | 3.07E+15 | 2.7 | 19.1 |
| 10 | 9.0 | 356, 200 | 4.8 | 248 | 7 613.0, 11.7 | 6 184.5, 12.4 | 7.52E+19 | 2.43E+15 | 2.7 | 19.1 |
| 10 | 9.3 | 314, 244 | 7.9 | 109 | 7 778.8, 12.0 | 6 122.6, 13.8 | 9.35E+19 | 3.12E+15 | 2.7 | 19.1 |
| 10 | 9.8 | 353, 261 | 7.5 | 83 | 7 870.6, 12.2 | 5 952.1, 11.7 | 4.11E+20 | 3.10E+15 | 2.7 | 19.1 |
| 7 | 10.3 | 411, 276 | 3.2 | 68 | 6 668.2, 10.2 | 6 377.0, 13.6 | — | 1.74E+15 | 4.8 | 21.3 |
| 7 | 10.8 | 422, 263 | 3.1 | 62 | 6 686.6, 10.4 | 6 676.6, 14.2 | 4.74E+19 | 1.75E+15 | 4.8 | 21.3 |
| 6 | 11.2 | 422, 267 | 8.7 | 73 | 6 739.2, 9.9 | 6 652.1, 14.7 | — | 1.64E+15 | 3.7 | 20.2 |
| 1 | 11.4 | 407, 242 | 7.0 | 156 | 6 521.4, 10.7 | 5 860.0, 7.8 | 3.56E+19 | 2.26E+15 | 1.6 | 27.9 |
| 1 | 12.0 | 437, 203 | 3.1 | 251 | 7 141.8, 11.9 | 5 511.3, 6.3 | 1.35E+20 | 2.14E+15 | 1.6 | 27.9 |
| 10 | 12.1 | 385, 273 | 5.0 | 52 | 9 084.0, 12.2 | 6 056.7, 15.7 | — | 3.38E+15 | 2.7 | 19.1 |
| 9 | 14.1 | 253, 167 | 2.6 | 62 | 6 685.2, 10.4 | 6 423.7, 14.2 | 2.23E+19 | 2.29E+15 | 2.9 | 19.6 |
| 2 | 14.2 | 262, 190 | 3.6 | 238 | 6 248.7, 10.7 | 7 109.8, 13.6 | 1.17E+19 | 2.21E+15 | 2.7 | 18.9 |
| 1 | 16.3 | 483, 227 | 5.0 | 253 | 6 368.4, 9.7 | 5 886.0, 6.6 | 5.45E+19 | 2.23E+15 | 1.6 | 27.9 |
| 1 | 17.6 | 507, 255 | 5.8 | 69 | 6 398.9, 9.7 | 6 348.7, 13.6 | 3.62E+19 | 2.24E+15 | 1.6 | 27.9 |
| 3 | 17.9 | 339, 123 | 8.3 | 253 | 6 218.1, 10.8 | 7 747.9, 14.4 | 4.23E+19 | 1.46E+15 | 3.4 | 20.3 |
| 3 | 18.0 | 347, 153 | 7.4 | 250 | 6 195.9, 10.7 | 7 363.3, 13.2 | 1.98E+19 | 1.55E+15 | 3.4 | 20.3 |
| 3 | 18.1 | 366, 172 | 5.9 | 246 | 6 186.6, 10.8 | 7 234.8, 14.3 | 1.65E+19 | 1.66E+15 | 3.4 | 20.3 |
| 1 | 18.4 | 496, 253 | 7.2 | 253 | 6 744.0, 10.8 | 6 153.3, 9.1 | 6.49E+19 | 2.24E+15 | 1.6 | 27.9 |
| 1 | 20.9 | 516, 264 | 4.0 | 62 | 5 630.0, 10.0 | 6 175.3, 9.1 | 8.05E+18 | 1.92E+15 | 1.6 | 27.9 |
| 2 | 22.0 | 508, 253 | 3.4 | 56 | 5 824.1, 11.0 | 6 542.2, 14.9 | — | 2.13E+15 | 2.7 | 18.9 |
| 1 | 22.4 | 501, 230 | 3.7 | 44 | 6 342.1, 10.1 | 6 176.2, 11.3 | 2.13E+19 | 2.23E+15 | 1.6 | 27.9 |
| 1 | 22.4 | 500, 262 | 5.3 | 56 | 5 856.6, 10.6 | 5 805.0, 7.5 | — | 1.83E+15 | 1.6 | 27.9 |
| 2 | 22.6 | 396, 265 | 2.8 | 118 | 6 027.6, 10.4 | 6 401.7, 12.7 | — | 2.14E+15 | 2.7 | 18.9 |
| 2 | 23.1 | 506, 261 | 4.2 | 52 | 6 231.4, 10.7 | 7 024.8, 14.7 | — | 2.15E+15 | 2.7 | 18.9 |
| 2 | 23.5 | 426, 267 | 3.3 | 68 | 5 762.4, 10.1 | 5 852.7, 8.6 | 1.82E+19 | 2.12E+15 | 2.7 | 18.9 |
| 2 | 23.7 | 415, 259 | 2.7 | 116 | 5 891.2, 10.6 | 6 315.8, 12.5 | 1.44E+19 | 2.11E+15 | 2.7 | 18.9 |
| 2 | 24.2 | 428, 266 | 4.2 | 79 | 6 311.9, 10.1 | 5 719.1, 12.5 | 1.92E+19 | 2.18E+15 | 2.7 | 18.9 |
| 2 | 24.5 | 505, 261 | 3.6 | 49 | 5 981.4, 10.2 | 6 650.0, 13.7 | — | 2.16E+15 | 2.7 | 18.9 |
| 2 | 25.3 | 493, 257 | 3.4 | 53 | 6 069.9, 10.2 | 6 945.9, 14.5 | 7.88E+18 | 2.17E+15 | 2.7 | 18.9 |
| 2 | 25.4 | 490, 250 | 3.3 | 54 | 5 937.9, 10.0 | 6 924.4, 14.4 | 9.94E+18 | 2.16E+15 | 2.7 | 18.9 |
| 2 | 25.5 | 507, 263 | 3.5 | 47 | 6 054.2, 10.5 | 7 367.7, 14.4 | 6.94E+18 | 2.18E+15 | 2.7 | 18.9 |
| 2 | 25.6 | 491, 257 | 3.3 | 53 | 6 112.1, 10.2 | 6 879.2, 15.2 | 3.44E+18 | 2.19E+15 | 2.7 | 18.9 |