

Abstract
The temperate Eurasian steppe (TES) is a region where various environmental, social, and economic stresses converge. Multiple types of disturbance exist widely across the landscape, and heavily influence carbon cycling in this region. However, a current quantitative assessment of the impact of disturbances on carbon sequestration is largely lacking. In this study, we combined the boreal ecosystem productivity simulator (BEPS), the Shiyomi grazing model, and the global fire model (Glob-FIRM) to investigate the impact of the two major types of disturbance in the TES (i.e. domestic grazing and fire) on regional carbon sequestration. Model performance was validated using satellite data and field observations. Model outputs indicate that disturbance has a significant impact on carbon sequestration at a regional scale. The annual total carbon lost due to disturbances was 7.8 TgC yr−1, accounting for 14.2% of the total net ecosystem productivity (NEP). Domestic grazing plays the dominant role in terrestrial carbon consumption, accounting for 95% of the total carbon lost from the two disturbances. Carbon losses from both disturbances significantly increased from 1999 to 2008 (R2 = 0.82, P < 0.001 for grazing, R2 = 0.51, P < 0.05 for fire). Heavy domestic grazing in relatively barren grasslands substantially reduced carbon sequestration, particularly in the grasslands of Turkmenistan, Uzbekistan, and the far southwest of Inner Mongolia. This spatially-explicit information has potential implications for sustainable management of carbon sequestration in the vast grassland ecosystems.
Export citation and abstract BibTeX RIS

Original content from this work may be used under the terms of the Creative Commons Attribution 3.0 licence.
Any further distribution of this work must maintain attribution to the author(s) and the title of the work, journal citation and DOI.
1. Introduction
Grassland ecosystems cover about 40% of the Earth's land surface and represent a significant carbon pool of about 20% of the world's soil carbon stocks (Wang et al 2008). Of these ecosystems, the Eurasian steppe belt is the largest temperate grassland eco-zone in the world and is also a wide, continuous vegetation transition zone stretching from Hungary to northeast China. It is bounded by the forests of Siberia to the north and the deserts of Kyzylkum, Karakum, and Gobi to the south, and spans almost one-fifth of the longitudinal belt around the globe with an area of more than 1.3 × 10⁸ km2 (Wesche and Treiber 2012). This eco-zone plays an important role in the regional and global carbon cycle due to its high capacity for carbon storage and high variability in carbon source/sink conditions (Goldammer and Stocks 2000). At present, it remains a focus of global change research (Mu et al 2013b, Peng et al 2013, Wang et al 2013).
The temperate Eurasian steppe (TES) is a region with various environmental, social, and economic stresses. In this vast area, disturbances induced by human beings and climate change exist widely across the landscape, and significantly affect vegetation productivity and carbon stock conditions. One of the major human activities in the grasslands is animal husbandry. According to an FAO Report (Conant 2010), grasslands are widely used as a crop and grazing source, and 27% of milk and 23% of beef produced in the world comes from grasslands. In the past 30 years, the TES has suffered from continuous degradation, partly caused by over-grazing (Conant and Paustian 2002, Gong H 2006). In some pasture ecosystems that traditionally had good forage quality and high productivity (e.g. the Xilinhot Steppe and the HulunBuir Steppe in Inner Mongolia), the quality of grass resource is now much worse than during the nomadic period (Barger et al 2004, He et al 2005). Grassland degradation and even desertification have been found in some areas of the TES during the past several decades (Mu et al 2013a, Zhou et al 2014). Obvious declines in productivity were found by field studies with medium or high stocking density of livestock (Fernandez-Gimenez and Allen-Diaz 2001, Li et al 2008, Li et al 2012). One recent study reported that domestic grazing ('grazing' from now on) reduced large amounts of vegetation carbon uptake and turned grasslands in Central Asia from carbon sinks to sources (Han et al 2016).
The underlying mechanisms of how grazing influences terrestrial carbon cycling stem from three processes: defoliation; carbon inputs from livestock excrement; and effects of trampling (Liu et al 2015, Vuichard et al 2007). Defoliation from grazing is the primary impact on grassland ecosystems because it directly removes biomass from plants and standing litter, which reduces carbon inputs to litter and soil carbon pools. It could also increase the carbon investment in roots as well as the CN ratio, both of which promote turnover of soil organic carbon (Mikola et al 2009). Excretion (urine and feces) from livestock returns carbon to the soil, and facilitates re-distribution of soil nutrients (Stumpp et al 2005), but also negatively affects above-ground vegetation due to the urine scorching effect (Guthery and Bingham 1996). Trampling mainly changes physical and chemical properties of soil by increasing soil alkalinity, soil water holding capacity, and porosity, and thus changes the environment where microbial decomposition occurs (Francini et al 2014, Hiltbrunner et al 2012, Li et al 2011, Steffens et al 2008). Bagchi and Ritchie (2010) further proposed that changes in soil temperature, aeration, and insolation induced by grazing would indirectly influence microbial activities and decomposition. These three factors interact with each other in grasslands and determine the overall effects of grazing on the entire ecosystem.
Fire events are another potentially important disturbance that influences regional carbon sequestration. More frequent and severe steppe fires were found in Kazakhstan due to the recent warming trend (Smelansky and Tishkov 2012). This trend has been detected in the past several decades and is predicted to continue (Kamp et al 2016, Tchebakova et al 2009). In Mongolia, a multi-century chronological dataset showed that elevated temperatures did not directly increase fire events, but persistent drought events induced higher fire frequency and shorter fire return time (Hessl et al 2016).
Although the importance of disturbances to carbon sequestration has been recognized and supported by many field experiments, the quantitative assessment of disturbance to regional carbon sequestration is still mostly lacking (Barros and Field 2014, Li et al 2015, Lioubimtseva and Henebry 2009). The lack of these data contributes to uncertainty in mitigation estimates for global grasslands with a range of 0.15 to 1.3 Gt CO2 yr−1 (Henderson et al 2015, Lal 2004). In addition, the distribution of livestock has been unmanaged for many years, which has led to excessive carbon removal from the system (Lioubimtseva and Henebry 2009). Suitable manage practices are proven to be efficient for recovery and augmentation of carbon stocks, e.g. moving grazing pressure to lightly grazed areas, and growing legumes or more productive grass species (Henderson et al 2015, Phelan et al 2015). Insights into the spatial patterns of disturbance intensity and their relative importance are required to identify problem regions and properly implement sustainable management practices. High-resolution, geographically explicit mapping of livestock grazing intensity is essential to identify where mitigation efforts are urgently needed for sustainable management of grassland carbon stocks.
In order to properly understand carbon sequestration patterns in the TES and the regional impacts of two major disturbances (grazing and fire damage in this study), we combined the late version of the boreal ecosystem productivity simulator (BEPS), the Shiyomi grazing model, and the global fire model (Glob-FIRM) to quantify how carbon sequestration was changed by disturbances from 1999 to 2008. Based on the model results, we explored: (1) to what extent the two disturbances influenced carbon sequestration; and (2) the spatio-temporal pattern of disturbance intensity that may potentially be instructive for sustainable management in the region.
2. Materials and methods
2.1. Study region
The study region lays in the central part of Eurasia, spanning from Volgograd Oblast, Russia in the west to Mongolia and Inner Mongolia, China in the east (figure 1). The longitudinal and latitudinal extents are 39°–125°E and 35°–55°N, respectively. The region is generally dominated by a temperate continental climate with different degrees of aridity. Mean annual precipitation in much of the region is less than 400 mm. Temperature conditions have large spatiotemporal variations. Mean annual temperature ranges from −5 °C to 15 °C with a latitude gradient except for the Tian Shan and Altai mountain ranges (Mohammat et al 2013). For seasonal variation, summer is typically hot averaging around 20 °C–26 °C, peak daily temperature could exceed 40 °C, while in winter, the climate is extremely harsh, with low temperatures reaching −30 °C. With longitudinal differences of climate and continentality variations, zonal grassland types vary from meadow steppe (forest steppe), typical (true) steppe to desert/semi-desert steppe. Based on these longitudinal divisions of the Eurasian steppe biome, the region is separated into two sub-regions: Transvolga–Kazakhstan Steppe (TKS) and Mongol Steppe (MS) (figure 1).

Figure 1. Map of the study region. The green colored areas on the top map represent the grassland areas; the scale bar belongs to the top map.
Download figure:
Standard image High-resolution image2.2. The pixel-based livestock distribution map
Political and social factors largely influence the livestock distribution pattern at both spatial and temporal scales among different countries or sub-regions (Chen et al 2015b). To exclude the factors of political/social heterogeneity that control or alter the regional livestock distribution pattern, a resource-oriented scheme was developed. The basic concept is that the livestock distribution is proportional to the local grassland productivity at large scales. We first incorporated official province/prefecture level statistics to generate the regional administrative map of livestock distribution. Thereafter, we applied a net primary productivity (NPP)-driven scheme to predict the pixel level of livestock distribution pattern.
The detailed description and validation of the livestock distribution map are presented in section S1, in the online supplementary data.
2.3. Model description
2.3.1. The BEPS model
BEPS is a remote sensing based terrestrial biogeochemical model. The model was initially developed to simulate vegetation production in boreal ecosystems (Chen et al 1999, Liu et al 1997). Then the model was coupled with terrestrial water and energy cycling and a CENTURY-derived soil carbon scheme (Chen et al 2007, Ju et al 2006, Liu et al 2003). It has been well validated and applied in multi-scale studies (Zhang et al 2012, Zhang Fangmin et al 2014). The model was recently revised to improve its simulation ability on grassland ecosystems (Chen et al 2016).
Here we only describe the algorithms to calculate the major indexes of terrestrial carbon flux used in this study.
NEP is the difference between NPP and soil respiration (Rh):

where NPP is the difference between GPP and autotrophic respiration rate (Ra):

GPP is calculated using the canopy 'two-leaf' scheme and the Farquhar biochemical model (Farquhar et al 1980). Ra is simulated as the sum of growth respiration (Rg) and maintenance respiration (Rm). Rg is calculated as a fixed percentage from GPP. For the Rm simulation, we replaced the original scheme of Rm for grassland in BEPS with a component-specific scheme:
Tk is the biomass of the plant component k, and rm,k is a coefficient of the maintenance respiration. T and Tref are air temperature and reference temperature for maintenance respiration, respectively. Q10,r is a temperature sensitivity factor for respiration calculated as a function of temperature (Arora 2003):

Rh is calculated by multiplying the carbon release rate (pk) from the total carbon amount of soil carbon pool k (Ck).

2.3.2. The grazing model
The Shiyomi grazing model (Shiyomi et al 2011) was modified and applied to assess the grazing consumption. This model was initially developed and successfully tested in the TES.
In the model, livestock cycling is linked to ecosystem cycling by the following processes: (1) direct consumption of aboveground biomass; (2) livestock respiration to the atmosphere; (3) excretion that adds carbon back to the soil and we further added (4) detrimental physical and chemical detrimental effects to the grassland.
Detailed algorithms of the grazing model can be found in section S2, online supplementary data available at stacks.iop.org/ERL/12/115005/mmedia.
2.3.3. The fire model
The Glob-FIRM model (Thonicke et al 2001) was used in this study. The model predicts the length of fire season using a conception of extinction moisture. The areas affected by fire are estimated as following:

Where N(w) is a temporal and spatial combination fraction of the fire weather for a specific pixel during the year, w is the fraction of days in a year with particular fire condition, which is calculated by the upper soil layer moisture status (Viegas et al 1992).
The fire effect on grasslands is calculated by the prescribed fire resistance. Above-ground biomass and litter are assumed to be fully consumed. So the carbon burned by fire can be calculated as a product of available surface carbon (Csurface, ave) and N(w):

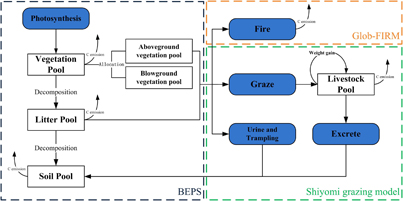
Figure 2. The outline of the model pool and flux scheme in the disturbance-coupled model.
Download figure:
Standard image High-resolution image2.4. Model simulations
Due to quick responses and short recovery times of herbaceous plants, lagged effects of disturbances are implicitly included in the BEPS simulation (Oesterheld and McNaughton 1991, Röder et al 2008). In this study, we defined the impacts of disturbances as direct carbon losses due to grazing and fire. The model first simulated the grazing carbon loss and then the fire loss was then simulated after an update of the carbon pool states. At the current stage, we do not consider the interactive effect between grazing and fire events. Hence, the total disturbance impact was calculated as the sum of grazing and fire carbon consumption.
2.5. Pilot evaluation of modeling results
Prior to the regional scale simulations, model outputs were evaluated using several approaches. The model outputs of plant and soil carbon were validated against multi-site field observations distributed in Kazakhstan, Xinjiang, China and Inner Mongolia, China. The net ecosystem exchange (NEE, equal to minus NEP) outputs were validated using the gap-filled eddy covariance (EC) dataset.
To further test the specific performances of the two disturbance models, two other validations were set. The simulated temporal trend of grazing was validated against a multi-year fenced experiment with different livestock density levels; regional results of fire events were compared to an established remote sensing based dataset, the L3JRC product (Tansey et al 2008). Both the burnt area and the date of fire occurrence were validated.
2.6. Data use and preparation
2.6.1. Regional model inputs
The IGBP land cover map (Loveland et al 2000) was used to identify the grassland areas. The regional vegetation, meteorology, soil and livestock datasets were used to drive the model from 1999–2008, including the GlobalLAI leaf area index dataset (www.globalmapping.org/globalLAI/), daily meteorological data from Global Meteorological Forcing Dataset for Land Surface Modeling (http://rda.ucar.edu/datasets/ds314.0/), monthly atmospheric CO2 data from the Mauna Loa Observatory, Hawaii (20°N, 156°W) (http://cdiac.esd.ornl.gov/ftp/trends/co2/maunaloa.co2) and a soil texture dataset from Global Soil Dataset for use in Earth system models (http://globalchange.bnu.edu.cn/research/soilw). All the input data were extracted to the study region and resampled to 8 × 8 km2 spatial resolution within ArcGIS 10.0 software ((ESRI) www.esri.com/software/arcgis/).
2.6.2. Model validation data
Flux data. Data from nine grassland eddy covariance (EC) flux stations were collected to validate NEP results: five of them are located in the TES (in or near the study region). We also used flux data of three other stations from the temperate grassland areas. These stations share the same climate conditions with the TES according to world maps of the Köppen–Geiger climate classification (http://koeppen-geiger.vu-wien.ac.at/). The data were collected from the Fluxnet web site (www.fluxdata.org/). We selected the flux sites with complete meteorological information needed for model simulation.
Field research data. 120 sites of field observations were used to validate the modeled plant and soil carbon. The sites of field measurements were distributed in eastern Kazakhstan, Xinjiang and Inner Mongolia. Plant biomass was measured in all 120 sites, and soil organic carbon was measured in 64 sites. Each of the test sites could represent the homogenous areas of 1 hm2.
Total carbon was defined as the sum of plant and soil carbon pools. The samples were collected from four replicates for each site. The plant biomass was defined as the sum of the herbaceous, litter and root biomass. The peak-season living aboveground biomass and litter was measured by the destructive sampling of 1.0 m2. The recent litters were selected and weighted. Roots were collected by excavating to a depth of 0.5 m. Root matter was hand sorted from soil, washed, dried and weighted. The dry matter values were converted to carbon assuming a proportional factor of 0.475 (Garbulsky and Paruelo 2004).
Fenced grazing observation. A multi-year fenced site observation was used to evaluate the performance of the grazing model (Wang, 1998). The experiment sites located in the center of Inner Mongolia (116°04'E–117°05'E, 43°26'N–44°08'N) were under different mean stocking intensities (1.33, 2.0, 4.0, 5.33 sheep per hm2). Three independent fields of 1 hm2 were set for each stocking intensity experiment. Aboveground biomass was measured using the destructive sampling method with four couples of 1 m2 for each experiment field (four plots inside the field and four plots outside the field). The observations were taken in 1990, 1993 and 1997. The experiment started May and ended on October in each year, and biomass was measured every 15 days.
Fire regime dataset. The L3JRC product (Tansey et al 2008) was used to validate the performance of the fire model. The dataset is based on SPOT VEGETATION Earth Observation system with 1 km2 spatial resolution and daily intervals. The product also records the date of fire occurrence. The temporal extension is from 2000–2007.
All sites' information is shown in table S2 in the online supplementary data.
3. Results
3.1. Model validations
Comparisons between modeled and observed results are shown in figure 3. The modeled results were consistent with field measurements. The R2 values are 0.84 and 0.58 for plant and soil C, respectively. The corresponding slopes are 0.74 and 0.78.
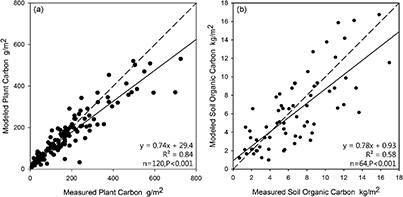
Figure 3. Comparisons between simulated and measured (a) plant carbon and (b) soil organic carbon.
Download figure:
Standard image High-resolution imageModel outputs of NEE were generally consistent with continuous observations at the eight grassland flux sites (figure 4), and we were able to simulate temporal tendencies in the model. Modeled annual net ecosystem exchange (NEEMOD) values were higher than measured values (NEEEC). The R2 values between NEEMOD and NEEEC ranged from 0.616 (US_BKG) to 0.848 (RU_HA2), and RMSE values ranged from 0.4 gC m−2 d−1 (RU_HA1) to 1.307 gC m−2 d−1 (US_BKG) (figure 4(b)).
Comparisons against the fenced observations show that our model set could reproduce seasonal trends of grassland production under different levels of stocking pressure (figure 5). The overall R2 is 0.71 (P < 0.01).
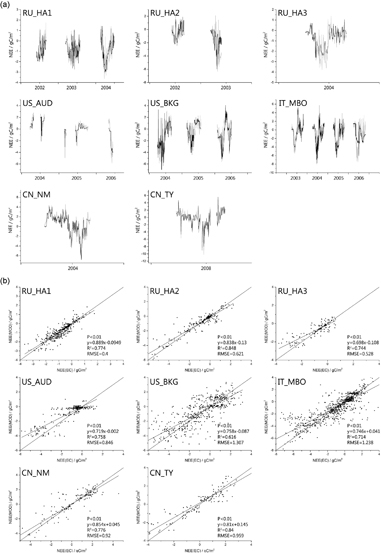
Figure 4. Validation of modeled NEE (NEEMOD) using the daily eddy covariance data (NEEEC) at eight sites (RU_HA1, RU_HA2, RU_HA3, US_AUD, US_BKG, IT_MBO, CN_NM, CN_TY). (a) Growing season variations of daily measured NEE (gray line) and modeled NEE (black line); (b) linear regressions of NEEMOD to NEEEC at the eight sites.
Download figure:
Standard image High-resolution image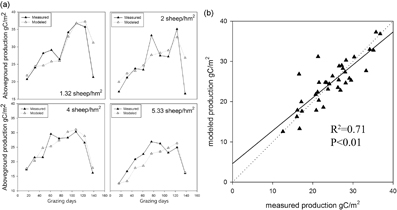
Figure 5. Grazing model results against field control experiments under different grazing intensities: (a) temporal trends and comparisons; (b) correlation between measured and modeled production. Grazing days represent the grazing durations in the experimental field.
Download figure:
Standard image High-resolution imageComparisons of burned areas between the L3JRC dataset and model simulation are shown in (figure 6(a); 86% of the pixels are in agreement with the L3JRC dataset. We also compared the regional mean fire occurrence day from 2000–2007; the model identified the regional temporal pattern when fire starts to appear (R2 = 0.52, P < 0.05, figure 6(b)).
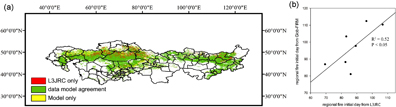
Figure 6. Fire model validation results. (a) Comparison of observed and simulated burned areas during 2000 and 2007; (b) correlation between observed and simulated regional mean for the first fire day during 2000 and 2007.
Download figure:
Standard image High-resolution image3.2. Regional pattern of NPP and NEP
Spatial distributions of mean NPP and NEP from 1999–2008 are shown in figure 7. As a widespread biome transition belt, the TES connects deserts in the southwest and forests in the north; vegetation productivity varies based on these regions. High productivity grasslands are mainly concentrated in areas that are connected with forested areas, such as: meadow steppe in the eastern part of the Mongol Steppe, which is joined to Great Khingan and Siberia; alpine meadow steppe around the Tian Shan and Altai Mountains; and Russian steppe areas that are close to the North Caucasus Forest. Low productivity areas are distributed around the deserts of Kyzylkum and Karakum in the TKS and the Gobi Desert in MS (figure 7(a1)). The model-calculated spatial pattern of NEP is basically consistent with NPP, but may be modified in part by the heterotrophic respiration distribution (figure 7(b1)). Low productivity areas generally acted as carbon sources or were neutral, and high productivity areas acted as carbon sinks. The major differences of spatial distribution were located in the northern provinces in Mongolia (Dornod and Hentiy) and Kazakhstan (Pavlodar and Qaraghandy). High productivity did not result in higher carbon sequestration in the southwest part of the Russian grasslands due to the high soil respiration rate in the red soil of the North Caucasus (Alexandrovskiy et al 2014).
Based on these results, the mean and total NPP of TES were 88.41 gC m−2 yr−1 and 392 TgC yr−1for the study period. The mean NPP in the TKS and the MS were similar: 87.7 gC m−2 yr−1 and 89.5 gC m−2 yr−1, respectively. The total NPP in these two regions was 240 TgC yr−1 and 152 TgC yr−1, respectively (figure (a2)).
The decadal mean NEP of TES was 12.86 gC m−2yr−1, indicating that the region was a net carbon sink. The total NEP was 39.2 TgC yr−1. The values were positive for both sub-regions. The total NEP for the TKS and the MS was 14.4 TgC yr−1 and 24.8 TgC yr−1, respectively (figure 7).
3.3. The regional patterns of grazing and fire disturbances and their impacts on carbon sequestration
The spatial distribution of the two types of disturbances was very uneven in the TES. For the fire regime, the major influenced areas were the northern and north-eastern TKS. However in the MS, fire rarely happened (figure 7(a3)). For grazing, there was a distinct spatial imbalance in carbon consumption in different countries and in different provinces or prefectures (figure 7(a4)). In the MS, major consumption was concentrated in China, especially in Inner Mongolia. The most extensively used grasslands were found in the traditional natural pastures with relatively high productivity, such as XilinGol Prairie in mid-Inner Mongolia and Hulunbuir Prairie close to the Great Khingan. In the TKS, high consumption was found in Uzbekistan and Turkmenistan, where two deserts (Kyzylkum and Karakum) are located and the major grassland type is desert steppe.
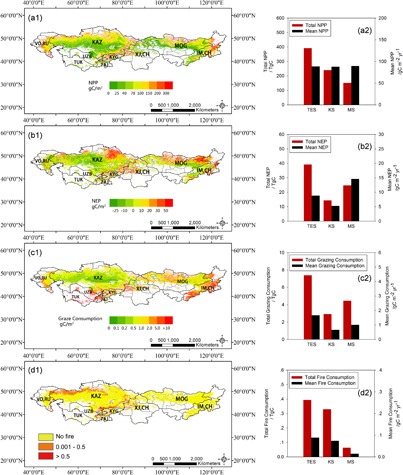
Figure 7. Spatial distribution of mean annual (a) NPP, (b) NEP, (c) grazing consumption and (d) fire consumption.
Download figure:
Standard image High-resolution imageBoth types of disturbance increased significantly during the study period (R2 = 0.82, P < 0.001 for grazing, R2 = 0.51, P < 0.05 for fire, figure 8). For grazing, carbon loss was on a near-linear increasing trend in the TKS; and for the MS, the trend was similar, except for a curved valley in 2002, which was probably caused by a long-term dzud (severe winter) in Mongolia in that year (Tachiiri et al 2008). For the fire regime, the main affected region was the TKS, and NPP loss from fire increased significantly over the decade of the study. In the TKS, the means and total disturbance consumption values were 1.76 gC m−2 yr−1 and 7.8 TgC yr−1, respectively (figure 7(b3)). Carbon consumption from grazing was much higher than for fire, and accounted for 95% of the total carbon loss.

Figure 8. Variation in annual total carbon consumption due to grazing and fire from 1999–2008.
Download figure:
Standard image High-resolution imageFor the first seven years, the region acted as a carbon sink, but in the last three years it turned into a weak source. This trend was mainly caused by a rapid NEP decrease, from 34.56 gC m−2 to −30.96 gC m−2 in the TKS during between 2002–2008 (with a slight increase in 2007). The inter-annual results indicated that the disturbances alleviated the regional carbon sink from 1999–2005 and aggravated the carbon source effect from 2006–2008 (figure 9).
The disturbance impact was much larger in the MS than in the TKS due to the higher level of grazing in the MS sub-region. According to our results, the mean percentage of grazing consumption from the NEP was 13.5% during the decade. The values were 7.6% and 16.6% for the TKS and the MS, respectively. For fire events, the percentages were 0.7% for the entire region, 0.86% for the TKS, and 0.2% for the MS. If the carbon losses from disturbances were explicitly considered, regional carbon sequestration decreased from 39.2 Tg C yr−1 to 31.4 Tg C yr−1.
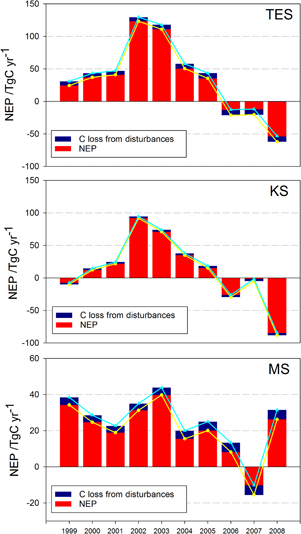
Figure 9. The impact of disturbances to regional NEP of (a) the TES, (b) the TKS, and (c) the MS from 1999–2008.
Download figure:
Standard image High-resolution imageThe spatial distribution of the impact of grazing to NEP is displayed in figure 10. Grazing could reverse the local carbon sink to a source in some areas, if the grazing consumption was higher than the absolute value of NEP. This phenomenon is especially significant in barren areas, such as the grasslands in Turkmenistan and Uzbekistan and the southwest boarder of grasslands in Inner Mongolia, China.
We further quantified the grazing impact to NEP for each country and sub-region and found a great spatial imbalance presented in figure 10. Grazing has minor impacts in Kazakhstan, Kyrgyzstan, Russia, Xinjiang, China and Mongolia with a percentage lower than 1% from NEP. However, in arid countries like Uzbekistan and Turkmenistan, over-grazing widely exists. Grazing consumption exceeded NEP in 71.9% and 92.6% of grasslands in these two countries, respectively. These results demonstrate the strong impact of grazing in altering the carbon budget in these areas.

Figure 10. Map (a) and statistical summary (b) of the percentage of grazing consumption from the absolute values of NEP.
Download figure:
Standard image High-resolution image
4. Discussions
4.1. Recent trends and characteristics of disturbances in the TES
The two types of disturbances we studied lead to profound impacts on carbon sequestration in the TES. If the carbon losses from disturbances were explicitly considered, carbon sequestration was significantly reduced in this region. According to our study, the total consumption from the two types of disturbances was 7.8 Tg C yr−1, accounting for 14.2% of the regional NEP, and grazing is the major contributor to carbon loss. Although the importance of grazing has been recognized for a long time, it has not been well quantified into the regional or global carbon sequestration calculations. Therefore, our results could contribute to understanding the large uncertainty in carbon sequestration abilities in arid and semi-arid ecosystems around the world (Ahlström et al 2015).
Chen et al (2015b) proposed the concept of coupled human and natural systems (CHANS), which focuses on the strong interactions between biophysical and socioeconomic systems among TES regions. The CHANS framework suggests that the importance of anthropogenic influences might produce stronger impacts on the grasslands than climate change (Chen et al 2015a). Although it is still difficult to explicitly disentangle the relative contributions of the two factors, our study provides strong quantitative evidence for the anthropogenic part. Furthermore, the carbon consumption caused by both types of disturbance significantly increased during the study period. These trends correspond to the official statistics and previous observations. FAO statistics (FAOSTAT, http://faostat.fao.org/) showed that the livestock numbers in all nations and regions in TES have increased since the late 1990s. Chen et al (2013) reported that more than 40% of grasslands in Central Asia were used for animal husbandry in 2009 compared to 2000 based on remote sensing data. With the continually expanding demand of livestock products and a 'warming and drying' trend, both the scale of animal husbandry and fire danger are predicted to increase (Flannigan et al 2013, Godber and Wall 2014). Hence, the effects of disturbance in TES will probably continue to expand and strongly impact regional carbon cycling in the future.
Moreover, the uneven distribution of disturbances and different management styles need to be considered and mitigated. Our results suggested that similar net grazing consumption occurred in southern countries in the TKS and in Inner Mongolia, China in the MS, but the effect of grazing on carbon sequestration in the southern TKS was much higher than in Inner Mongolia. These regional patterns are related to fundamental differences in grassland quality and productivity. But more importantly, the absolute number of livestock in the two countries (i.e. Uzbekistan and Turkmenistan) is far beyond a suitable stocking rate, leading to the overall over-grazing condition. We have not found detailed statistics from these two countries, however, it is reported that the average stocking rate near settlements in Kyrgyzstan is about 2.74 sheep head hm−2, which is 3.2 times higher than the recommended scale (0.85 sheep head hm−2) (Mirzabaev et al 2016). This result may reflect uncontrolled and excessive stocking rates in Uzbekistan and Turkmenistan, since livestock density in the two countries is obviously higher than in Kyrgyzstan. Because the grasslands are managed by state-controlled cooperatives or farmer associations, this situation is closely related to the national condition. Historically, the national economy in the two countries largely has relied on grassland resources since the collapse of the USSR (Lioubimtseva and Henebry 2009). The huge numbers of livestock and years of over-utilization has directly caused the deserts to expand (Robinson et al 2003). Now grassland resources are diminished but livestock numbers continue to increase after the USSR has collapsed (Chen et al 2013).
Pasture management practices are the other important contributor to the current regional patterns. In China, livestock numbers have experienced a boom period since the 2000s to meet the social and economic needs for animal products in China (Rae and Zhang 2009). To alleviate pressure from unmanaged pasture use and to preserve grassland resources, the Chinese government has promoted several regional programs like the Grain to Green Program (GTGP) and the Grazing Withdrawal Program (GWP) since the 1990s. The primary goal of both programs is to conserve pastures under a different level of degradation by transforming grazing and cropping activity to be sustainable. According to our previous study in Inner Mongolia, construction of infrastructure, including animal sheds and corrals, increased by 20%, and the size of fenced grassland increased by nearly three times from 1999–2008. Accordingly, grassland NPP increased by 40.6 g C m−2 yr−1 between 2001 and 2009 (with climatic factors excluded) (Mu et al 2013c). On the other side of TES, in the TKS, the influence of high grazing intensity on carbon cycling has not received enough attention from the scientific community or from government officials. Although some management suggestions to conserve carbon stocks, such as rotational and migratory grazing, have been supported by empirical evidence (ICARDA 2001, 2002), field studies are still urgently needed in arid areas. Furthermore, the huge amount of investment needed to carry out rehabilitation might be a greater obstacle to reversing degradation on a large scale (Blench and Sommer 1999, Mirzabaev et al 2016). Over the long term, economic development is the primary task for developing countries in this region, but finding a balance between living improvements of human beings and ecosystem sustainability is an essential topic to consider.
4.2. Model uncertainty and potential improvements
We validated model outputs in several ways. The results showed general consistency of our model with continuous carbon flux observations, field data, and remote sensing product. However, model uncertainties are sometimes unavoidable when simulating a complex system with multiple factors. First, uncertainty exists in the model input of leaf area index (LAI). Unstable surface reflectance, foliage clumping, and soil effects in regions with sparse vegetation are among the major sources of LAI deviation (Liu et al 2012). The latter two factors generally cause under-estimation of LAI, which could have caused the under-estimations of NPP and NEP in this study. Second, the uncertainty could arise from mathematical descriptions and corresponding parameterization of biogeochemical processes in the model. We compared our model results with previous studies in this region (table 1). Our results are more comparable with models that share the same photosynthesis scheme (i.e. Farquhar model), but our results are often lower than light use efficiency (LUE) models.
Table 1. Recent model results of grassland in the Eurasian steppe and comparison with this study.
| Study area | Study period | Method | Model type of carbon assimilationa | Results (gC m−2 yr−1) | Corresponding results in this study (gC m−2 yr−1)b | Reference |
|---|---|---|---|---|---|---|
| Mongolia | 2000–2005 | Improved CASA model | LUE | NPP: 125.33 | 75.2 | (Xing et al 2010) |
| Northern China | 2000–2005 | Improved CASA model | LUE | NPP:153.26 | 113.8 | |
| China | 2000 | CASA | LUE | NPP:245 | 121.23 (for Inner Mongolia) | (Gao and Liu 2008) |
| CEVSA | Farquhar | NPP:208 | ||||
| GLOPEM | NPP:145 | |||||
| GEOLUE | LUE | NPP:178 | ||||
| GEOPRO | Farquhar | NPP:168 | ||||
| China | 2007 | BEPS | Farquhar | NPP: 122.6 | 121.23 (for Inner Mongolia) | (Feng et al 2007) |
| Eastern Kazakhstan | 2004 | Modified light use efficiency (LUE) model | LUE | NPP:168 | 152.1 | (Propastin et al 2012) |
| Xilinhot, Inner Mongolia | 2002 | GLPM | Farquhar | NEP:1.91 | 2.23 | (Zhang et al 2009) |
| Inner Mongolia | 1951–2007 | TEM model | Farquhar | NEP:11.25 | 15.97 for the period of 1999 to 2007 | (Sui et al 2013) |
aLUE: light use efficiency model; Farquhar: Farquhar biochemical model. bThe results are extracted from the simulated map in this study with the same spatiotemporal scale to the corresponding recent studies.
In the current soil carbon model, the mechanical description of microbial activities is relatively weak in soil carbon circulation and the algorithms to calculate environmental factors on soil decomposition are not well supported (Luo et al 2015). Moreover, the disturbance intensity, especially the stocking rate, could significantly affect the magnitude of changes in carbon pools and fluxes. Light grazing might contribute to accumulation of carbon, whereas moderate and heavy grazing would induce carbon loss in both plant and soil pools and lead to soil erosion and degradation (Yan et al 2013, Zhou et al 2016). Responses of grasslands to different disturbance intensities should be considered in future models and simulations.
With the input of data based on governmental official statistics, regional livestock consumption could be constrained at a certain range. The model validation results also support the effectiveness of the grazing model. However, the current model assumes a constant daily intake rate of livestock, which ignores the effects of environmental change such as climatic warming and CO2 enhancement on the livestock intake rate (Collier and Zimbelman 2007, Nardone et al 2010). In addition, more frequent extreme weather events cause more severe stresses that are closely related to higher livestock mortality (Vitali et al 2009).
For the fire regime, the major disagreement between the model results and the field observations is from the mountainous areas in north Kazakhstan and Kyrgyzstan. We suspect that deviations in the model come from the discrepancy between the model scheme and real climate patterns in these areas. The model used soil water content as a scalar to determine fire occurrence. That is, if surface soil water content is lower than 'extinction moisture', then the area has the potential to burn. In these mountainous areas, the climate pattern is different from the rest of the region. Rainfall mainly happens in the winter and spring, and the temperature is mild throughout the year, rarely exceeding 30 °C, even during the mid-summer (Rachkovskaya and Bragina 2012). Thus it is possible that the soil water content is low but energy conditions for fire occurrence are not met.
The period of our study avoids significant land use and cover change (LUCC) from political events, e.g. the collapse of the former USSR. However, some studies have highlighted the potential impacts from LUCC in recent years. For example, Chen et al (2013) reported that the grasslands were gradually reclaimed after the overall recovery during the 1990s in Central Asia. Mu et al (2013c) suggested that the increasing grassland areas lead to carbon accumulation in Inner Mongolia. Based on our results, we speculate that persistent over-grazing will largely accelerate irreversible land degradation, especially in the southern countries in the TKS. In addition, the emergence of mining and oil production, as well as the current trend of urbanization are also potential factors affecting LUCC in the TES (Peng et al 2009, Pomfret 2016, Suzuki 2013).
5. Conclusions and perspectives
In this study, we found that grassland carbon sequestration could be significantly reduced in the TES if carbon losses from major disturbance events (grazing and fire) were explicitly considered. Grazing dominated the carbon losses from the two disturbances with a percentage of 95%. Although uncertainties exist in the model, the huge impacts of disturbances are quantified. Based on the literature search result from the ISI Web of Knowledge database (www.isiwebofknowledge.com), this study is among the first regional quantitative assessment of the disturbance impact to carbon sequestration in the TES. We pinpointed major over-grazing areas in the TES, which is a first step towards achieving sustainable management of regional grasslands. A potential further study would apply different grazing scenarios to see how management practices contribute to conservation of terrestrial carbon stocks.
As summarized by Qi et al (2012), regional grassland ecosystems are especially vulnerable to both climate change and intensified human activities. Our results support the idea that disturbance has the potential to change terrestrial ecosystems from carbon sinks to carbon sources in some areas. At the same time, our assessment of disturbance is not completely inclusive. For example, grazing mainly represents the disturbance from animal husbandry during the growing season, but during the non-growing season, livestock mainly rely on drylot feed. Total carbon loss should be carefully considered, because forage could be locally provided or imported from outside the region. Other disturbances due to mining and the petroleum industry have gradually been established in the TES since the late 1990s. The fundamental ways that mining and the petroleum industry influence grasslands could be very different from the disturbances we focused on in this study. These potential differences need to be considered in future studies.
Acknowledgments
This work is supported by the National Key R&D Program of China (2016YFA0600202), the Fundamental Research Funds for the Central Universities (KYZ201758) the National Key R&D Program of China (2016YFD0600204), APN Global Change Fund Project (No. ARCP2013-16NMY-Li), National Youth Science Fund of China (41501575) and the Priority Academic Program Development of Jiangsu Higher Education Institutions (PAPD).
We acknowledge all producers and providers of the datasets used in this study. We also greatly acknowledge Dr Jingming Chen from the University of Toronto for offering the model codes of BEPS and useful instructions, Dr Yiqi Luo from the University of Oklahoma and Dr Jianyang Xia from the East China Normal University who gave suggestions. The model design and construction is largely inspired by the topics and discussions during the NEESPI/NEFI events. Without this kind help and encouragement, this work could not be finished.