
Abstract
We developed a novel electroporation method using a scanning ion conductance microscope (SICM) with a theta capillary nanopipette probe that has two apertures at the edge of the pipette. One aperture of the pipette probe was used to control the pipette–surface distance and to apply pulse voltage for electroporation. The other was used to eject material over the cell by local electrophoresis. Using the nanopipette, propidium iodide was successfully introduced into a targeted single Hela cell without influencing the surrounding cells. Furthermore, by scanning the theta nanopipette probe using the SICM, the morphological behaviors of the electroporated cells could be observed.
Export citation and abstract BibTeX RIS
1. Introduction
How best to introduce biomolecules into human cells is currently one of the most important issues not only for basic cellular research but also in many clinical fields. Several techniques have been developed to deliver molecules to cells, including microinjection,1,2) liposome complexes,3–7) viral vector mediated systems,8–11) and electroporation.12) In particular, the development of methods for manipulating single cells is of major importance for the rapidly growing field of genomics and proteomics to enhance the control accuracy of the research conditions, though few techniques enable the manipulation of a single cell with low invasion. For specific targeting, microinjection has been used for single-cell manipulation. However, it often induces severe damage to the cell membrane owing to penetration with the microcapillary.13) Thus, cell viability after such manipulation is very low.14) For material delivery into cells without needle injection, electroporation is a frequently used technique. Applying large electric fields to cells causes temporary pores to form in the cell membrane, which increases the membrane permeability to ions, molecules, and even macromolecules.12,15–18) However, in conventional electroporation, single-cell manipulation is difficult because large electrodes separated by millimeter to centimeter scale are generally used to electroporate whole populations of cells in created homogeneous fields.
Recently, we have developed an electroporation technique for introducing molecules into a single cell using a nanopipette.19) The single-cell electroporation system was based on a scanning ion conductance microscope (SICM)20) for positioning the pipette edge in the vicinity of the cell membrane. The nanopipette was prepared to act as a tiny electrode to form a local electric field at the edge of the nanopipette for single-cell electroporation. This method has some difficulties; a significant amount of delivery materials must be dispersed throughout the buffer solution in the petri dish, even when expensive and valuable molecules are used. Furthermore, the materials dispersed in advance in the buffer often influence the cells not receiving electroporation.
In this work, to solve the above problems, we developed a novel electroporation method using a theta aperture nanopipette that has two apertures used for different functions. One aperture was used for local electrophoresis, delivering the materials that filled the capillary channel, while the other was used to control the pipette–surface distance through the detection of ion current using the SICM. The latter aperture was additionally used to form a local electrical field for single-cell electroporation, by applying pulse voltage. The use of the theta nanopipette meant that only a small amount of the delivery material was required to fill the pipette, and it was not necessary to disperse the material in the buffer solution; the technique can thus save on materials and avoid influencing other cells as there are no dispersed molecules. We describe demonstrations of delivering fluorescent molecules into a single Hela cell. Electroporation properties such as delivery rate, cell viability, and morphological change of electroporated cells were investigated using the novel SICM system.
2. Experimental procedure
2.1. Single-cell electroporation using a theta nanopipette
In this study, a theta capillary nanopipette was employed to act as an electrode. By using a laser puller (Sutter Instruments P-2000), the borosilicate theta pipette (o.d. 1.50 mm, i.d. 1.17 mm, Sutter Instruments) was pulled to a sharp point. As shown in Fig. 1(a), the theta nanopipette had two apertures at the edge, namely, two channels. In this study, the diameter of the apertures was approximately 100 nm. One pipette channel (A) was filled with solution of delivery molecules; the other channel (B) was filled with electrolyte. An Ag/AgCl wire, 0.1 mm in diameter, was inserted into each channel. The wire inserted into channel A acted as the electrode for local electrophoretic material delivery, while the wire inserted into channel B played a part in electroporation. In addition, the electrode wire in channel B acted as an electrode of the SICM to detect ion current for positioning the pipette edge in the vicinity of the targeted cell and for imaging the morphology of cells.

Download figure:
Standard image High-resolution image
Fig. 1. Experimental setup of SICM for single-cell electroporation using a theta nanopipette: (a) method for single-cell electroporation using theta nanopipette; (b) experimental setup of SICM configuration for single-cell electroporation.
Download figure:
Standard image High-resolution image2.2. SICM setup using the theta nanopipette for local electroporation
The SICM is a form of scanning probe microscope using a nanopipette that detects ion-current flow through the pipette aperture.20) It is possible to obtain the sample topography by scanning the nanopipette without contacting the sample surface in liquid, thus, in particular, techniques of SICM have been developed for biological applications such as high resolution imaging,21–23) fast imaging,24) material delivery on the surface,25) and measurement using a theta pipette.26–28) The operation principle of SICM is as follows. When the pipette edge approaches a sample surface within a pipette–surface distance that is less than the aperture diameter, the ion current is reduced owing to the surface occluding the aperture. By detecting the drop in the ion current, the distance between the pipette edge and sample surfaces can be controlled. Therefore, it is possible to position the pipette edge in close proximity to the sample surface. Under this condition, the pipette can be used to scan the sample without inflicting mechanical damage to its surface.
Figure 1(b) shows the experimental setup of the homemade SICM using the theta nanopipette for single-cell electroporation. The apparatus based on the SICM was mounted on the sample stage of an inverted fluorescence microscope (Olympus IX-71) with a cooled CCD camera attachment (Olympus DP72). Living cells cultivated in a petri dish were placed on an X–Y flat scanner (Nanonics NIS-70). The SICM probe consisting of the theta nanopipette was fixed on a piezo actuator driven by a piezo driver. The theta nanopipette was filled with electrolyte and molecules. Ag/AgCl electrodes were inserted into each channel of the theta nanopipette. A DC bias voltage output from a function generator was applied to the bath electrode with respect to the electrode of channel B for SICM operation. The electrode inserted into channel B was connected to a homemade current–voltage (I–V) converter that could detect the ion current passing from the liquid medium through the pipette aperture. The detected ion current was amplified and fed into a field-programmable gate array (FPGA) board (National Instruments NI-7831R) controlled by a program written in LabVIEW2013 (National Instruments). The gain of the I–V converter was fixed at 109 V/A. For the SICM operation, the applied DC voltage of the bath electrode was 0.1 V and the detected average current was 1 nA. Here, the SICM was employed to position the pipette edge in the vicinity of the cell surface. The positioning sequence was as follows. The nanopipette driven by the piezo driver controlled by the FPGA approached the sample surface. During the approach, the ion current passing through the aperture of the pipette was detected with the I–V converter connected with the FPGA board. The detected current signal was monitored, and when it was reduced to a predefined level, the pipette approach was stopped. In this research, the predefined level was 1% current reduction. Thus, it was possible to position the pipette edge in the vicinity of the cell membrane without inflicting mechanical damage.
The electroporation process was as follows. After the pipette edge approached the vicinity of the cell membrane, the electrode in channel A was connected to the ground terminal to apply a DC bias potential between it and the bath electrode to eject the molecules from the aperture over and around the cell by electrophoretic migration. Then, the bath electrode was sequentially switched to connect to the high-voltage amplifier that applied voltage between the electrode of channel B and the bath electrode, which created a local electric field concentration at the pipette edge owing to the high electrical resistance at the aperture. Thus, the local electric field formed at the pipette edge realized local electroporation of the target single cell.
2.3. Cultured Hela cell and delivery materials
Hela cells were cultured in Petri dishes (Greiner bio-one) containing Dulbecco's Modified Eagle Medium (Life Technologies) supplemented with 10% FBS at 37 °C under a 5% CO2 atmosphere. To evaluate electroporation, we used two dyes. For the evaluation of cell viability, whole cells were stained with 2 µL/mL Calcein AM29) (Dojindo). Calcein AM readily passes through the cell membrane of viable cells because of its enhanced hydrophobicity compared to Calcein. After Calcein AM permeates into the cytoplasm, it is hydrolyzed by esterases to Calcein, which remains inside the cell. However, it is released if the cell is damaged.30) This fluorephore was primarily employed as a viability marker of living cells. The excitation and emission wavelengths of Calcein AM are 495 and 515 nm, respectively. To evaluate the creation of aqueous pathways in the cell membrane by electroporation, we used propidium iodide (PI)31) (Dojindo). PI is a membrane-impermeant dye that emits red fluorescence upon intercalation with double-stranded DNA. PI cannot permeate viable cell membranes, but passes through dead cell membranes and stains the nuclei. The excitation and emission wavelengths of PI are 535 and 615 nm, respectively. In this experiment, one pipette channel was filled with PI of 300 µM. If a cell were successfully electroporated, the PI would penetrate the cell membrane and indicate its presence with red fluorescence. In this experiment, cells were stained in advance with Calcein AM as green fluorescence. Thus, the viability of the electroporation cells could be evaluated.
3. Results and discussion
3.1. Approach current behavior obtained using the theta nanopipette
Positioning the pipette edge in the vicinity of the target cell is very important for single-cell electroporation. Figure 2 shows the approach curves using the theta nanopipette on a Hela cell. In general, on a glass substrate, the ion current sharply decreases when the pipette edge reaches the substrate. However, the approach curve on the cell indicated different behavior. When the pipette edge reached the vicinity of the cell membrane, the ion current began to drop, as indicated by the arrow in Fig. 2. After that, the ion current gently decreased while the pipette approached, pushing and deforming the cell owing to its low elasticity. Then ion current increased again when the pipette tip punctured the cell membrane. Finally, the ion current was sharply reduced when the pipette edge reached the substrate. Thus, by setting the stop position of the pipette approach around the first dropping point of the ion current, it is possible to position the pipette edge on the cell membrane with gentle interaction. In this study, the pipette was positioned where the current decreased 1% from the basal value.

Fig. 2. Approach curve that indicates normalized ion current as a function of the theta nanopipette displacement. The curve was obtained on a Hela cell.
Download figure:
Standard image High-resolution image3.2. Molecular ejection using the theta nanopipette
To calibrate the amount of PI ejected from the pipette aperture by electrophoresis, the volume was measured as a spherically ejected model of fluorescent PI. A DC voltage of −3 V was applied to the bath electrode to eject positively charged PI into the bath solution. To visualize the ejected PI, buffer solution including DNA-Na (Nippon Chemical Feed) with a concentration of 1 g/L was prepared, which allowed us to observe the fluorescence of the ejected PI reacting with the DNA. Figure 3(a) shows the optical micrograph of the pipette edge ejecting PI molecules by electrophoretic discharge. Figure 3(b) shows the fluorescence image of Fig. 3(a), in which the ejected PI from the pipette aperture is visualized as red fluorescence. The images were obtained 3 s after the ejection began. The ejection volume was calculated under the assumption that the ejection was spherical. The intensity profile was dealt with as a Gaussian profile; thus, the diameter of the sphere was determined from the 1/e2 width of the intensity profile. Figure 3(c) shows the relationship between the time of applied voltage and volume of ejection. The volume of ejection increased monotonically with increasing applied voltage time. From this result, the volume reached over 10 pL after 2 s of ejection, which corresponded to more than twice the volume of a typical Hela cell.32,33) Thus, we selected 2 s as the time of applied voltage for ejection.

Fig. 3. Ejection of PI into the bath solution: (a) optical microscope image of PI ejected; (b) fluorescence image of PI ejected from the pipette aperture. The white broken line indicates the position of the pipette; (c) relationship between the ejected quantity and applied voltage time.
Download figure:
Standard image High-resolution image3.3. Delivering materials into a single cell and morphological imaging
Figure 4 shows the optical microscope images and SICM images of a single cell injected with PI by the electroporation method. Figures 4(a) and 4(b) show a bright-field image and the red fluorescence image of the electroporated cell, respectively. In the images, the arrow indicates the target cell electroporated by applying pulse voltage. The pulse parameters of voltage, frequency, and applied voltage time were 30 V, 100 Hz (10% duty ratio), and 1.0 s, respectively. As shown in Fig. 4(b), only the single cell emitted the red fluorescence of PI molecules; thus, the target cell was selectively electroporated and PI molecules were introduced. Figure 4(c) shows the fluorescence image of green emission from living cells stained with Calcein AM dispersed in the bath buffer. As may be seen in the image, the electroporated cell emitted green fluorescence like the surrounding cells even after the electroporation process. Thus, it is possible to deliver the molecules into the target cell and maintain it in a live condition.
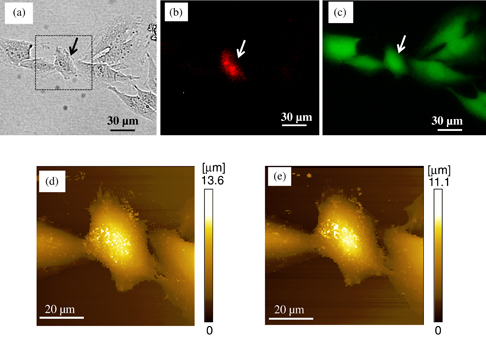
Fig. 4. Delivery of PI into a single cell by electroporation applying pulse voltage of 30 V. Other pulse parameters of frequency and applied time were 100 Hz with 10% duty ratio and 1.0 s, respectively. (a) Optical microscope image of an electroporated cell. The target cell is indicated by the arrow. (b) Fluorescence microscope image of the cell stained with PI. (c) Fluorescence microscope image of the living cell stained with Calcein AM. (d) SICM image of the cell before electroporation, obtained by scanning the square area shown in optical microscope image (a). (e) SICM image of the cell 30 min after electroporation.
Download figure:
Standard image High-resolution imageUsing the SICM system, we investigated the morphological properties of the cells manipulated by electroporation. Figures 4(d) and 4(e) show the SICM images of a cell obtained by scanning the square area in Fig. 4(a) before and 30 min after electroporation, respectively. The topography of the Hela cells was clearly obtained using the theta nanopipette. For the sequential process of imaging and electroporation, the same nanopipette was used. In a comparison of the cell images, topographical differences before and after the electroporation process were not recognized. Under the condition of applied pulse voltage for electroporation, the electroporated pores on the membrane could be rapidly repaired; as a result, the cell could survive without any change in its topography.
On the other hand, higher electroporation voltage decreased the cell viability. We carried out electroporation with higher applied voltage. Figures 5(a), 5(b) and 5(c) show a bright-field image, red fluorescence image for visualizing cells stained with PI, and green fluorescence image for visualizing cells stained with Calcein AM, respectively. In the images, the arrows indicate the target cell electroporated with a pulse voltage of 200 V. The other pulse parameters of frequency and applied time were 100 Hz (10% duty ratio) and 1.0 s, respectively. As may be seen in the images, PI was certainly delivered into the single cell. However, no green fluorescence of the electroporated cell stained with Calcein AM was recognized. The application of the large electrical field significantly damaged the membrane of the cell, and the pores in the membrane were unable to recover. This resulted in weaker green fluorescence from the cell, and finally, the disappearance of the fluorescence owing to cell death.
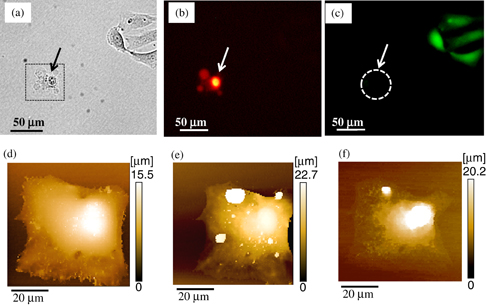
Fig. 5. Delivery of PI into a single cell by electroporation applying pulse voltage of 200 V. Other pulse parameters of frequency and applied time were 100 Hz with 10% duty ratio and 1.0 s, respectively. (a) Optical microscope image of an electroporated cell. The target cell is indicated the arrow. (b) Fluorescence microscope image of the cell stained with PI. (c) Fluorescence microscope image of the living cell stained with Calcein AM. (d) SICM image of the cell before electroporation, obtained by scanning the square area shown in optical microscope image (a). (e) SICM image of the cell 30 min after electroporation. (f) SICM image of the cell 115 min after electroporation.
Download figure:
Standard image High-resolution imageTo investigate the process of the morphological change of the cell upon electroporation, we obtained SICM images of the target cell. Figures 5(d) and 5(e) show the SICM images of the target cell obtained by scanning the square area in Fig. 5(a) before and 30 min after electroporation, respectively. As shown in the images, significant morphological changes were observed in the cell after electroporation. As shown in the topographical image in Fig. 5(e), the cell burst and cellular components spilled out from the membrane under the process of cell death. Figure 5(f) is an SICM image of the cell obtained 115 min after electroporation; it indicates the morphology of the cell shrinking owing to plasma membrane rupture and leakage of the cell constituents.34) Therefore, as shown by these images, the sequential process of morphological behaviors of cells manipulated by electroporation can be obtained using SICM; this will be very effective for the investigation of single-cell manipulation and analysis.
3.4. Evaluation of delivery rate and viability
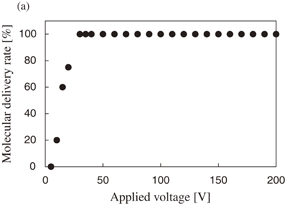
Figure 6(a) shows the molecule delivery rate as a function of the applied voltage. The applied voltage was changed from 5 to 200 V. The other pulse parameters of frequency and applied time were 100 Hz (10% duty ratio) and 1.0 s, respectively. The delivery rate was obtained from 20 cells for every applied voltage condition. As shown in the figure, the molecule delivery rate increased with increasing applied pulse voltage. For applied voltage of over 30 V, all of the electroporated cells in this study were stained with PI. Figure 6(b) shows the survival rate as a function of applied voltage, which was obtained simultaneously with the data of molecule delivery rate in Fig. 6(a) using Calcein AM. Thus, the survival rate was also obtained from 20 cells for every applied voltage condition. When applied voltage was less than 80 V, all of the electroporated cells in this study survived. However, for applied voltage of more than 90 V, the survival rate of electroporated cells decreased with increasing applied voltage. Thus, with respect to PI delivery into Hela cells while maintaining a live condition, the optimized range of applied voltage was from 30–80 V when using this electroporation method.
Download figure:
Standard image High-resolution image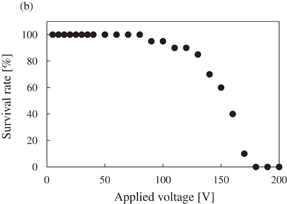
Fig. 6. (a) Relationship between molecular delivery rate and applied voltage. The pulse parameters of frequency and applied time were 100 Hz (10% duty ratio) and 1.0 s, respectively. The applied voltage was changed from 5 to 200 V with steps of 5 V. Under each condition, 20 cells were evaluated. (b) Relationship between the survival rate of the electroporated cells and the applied voltage. The data of the survival rate was obtained simultaneously with that of the molecule delivery rate in (a).
Download figure:
Standard image High-resolution image
It will be important to monitor the ion current during the electroportion process. However, in this study, the fixed-gain I–V converter was built into the SICM unit to detect ion current of nanoampere order under applied voltage of 0.1 V for pipette approach and imaging. Thus, in the electroporation process, the large current under applied voltage of several tens volts was out of the range of the I–V converter and could not be measured. In future work, a variable-gain I–V converter should be employed to measure the current in the electroporation process to investigate the relationship between the current and cell viability.
As we described in this article, using the single-cell electroporation system based on the SICM, we were able to bring the nanopipette close to the cell membrane without mechanical damage and carry out the electroporation safely and effectively under the optimized pulse conditions.
4. Conclusions
We proposed a single-cell electroporation technique based on a scanning ion conductance microscope with a theta nanopipette. One aperture of the pipette probe was used to locally deliver electrophoretic material. The other was used to control the pipette–surface distance and to apply pulse voltage for electroporation. The use of the SICM system allowed us to position the pipette edge on the cell membrane with gentle interaction. As the electrophoresis function of the theta nanopipette, it was possible to control the amount of ejected molecules. By using the technique, propidium iodide was successfully introduced into a single Hela cell without influencing surrounding cells. The electroporation system based on SICM with the theta nanopipette will become a powerful tool for material delivery into a single cell.
Acknowledgements
This work was supported in part by Grants-in-Aid for Scientific Research from the Ministry of Education, Culture, Sports, Science and Technology of Japan (MEXT) and from CREST of the Japan Science and Technology Agency (JST).