In vivo genetic dissection of tumor growth and the Warburg effect
- University of California, Los Angeles, United States
Abstract
A well-characterized metabolic landmark for aggressive cancers is the reprogramming from oxidative phosphorylation to aerobic glycolysis, referred to as the Warburg effect. Models mimicking this process are often incomplete due to genetic complexities of tumors and cell lines containing unmapped collaborating mutations. In order to establish a system where individual components of oncogenic signals and metabolic pathways can be readily elucidated, we induced a glycolytic tumor in the Drosophila wing imaginal disc by activating the oncogene PDGF/VEGF-receptor (Pvr). This causes activation of multiple oncogenic pathways including Ras, PI3K/Akt, Raf/ERK, Src and JNK. Together this network of genes stabilizes Hifα (Sima) that in turn, transcriptionally up-regulates many genes encoding glycolytic enzymes. Collectively, this network of genes also causes inhibition of pyruvate dehydrogenase (PDH) activity resulting in diminished ox-phos levels. The high ROS produced during this process functions as a feedback signal to consolidate this metabolic reprogramming.
https://doi.org/10.7554/eLife.18126.001Introduction
During cancer formation, developing tumor cells acquire multiple biological capabilities that ultimately lead to malignancy. These events include, sustained proliferation, resistance to cell death, induction of angiogenesis, cellular metastasis and a reprogrammed energy metabolism (Hanahan and Weinberg, 2011; Pavlova and Thompson, 2016). Warburg discovered that many cancer cells reprogram their glucose metabolism by transitioning from oxidative phosphorylation to glycolysis even in the presence of oxygen (Warburg, 1956a, 1956b; Vander Heiden et al., 2009). Such a metabolic state was termed 'aerobic glycolysis' and the ability of cancer cells to acquire this new metabolic state has since been referred to as the 'Warburg effect'. The phenomenon was understudied for decades, as it became clear, that contrary to Warburg’s assertions, cancers were largely attributable to oncogenes and tumor suppressors, rather than to exclusive changes in metabolic status (Huebner and Todaro, 1969; Stehelin et al., 1976; Martin, 2001; Knudson, 1971; Shih and Weinberg, 1982). However, more recent studies have explored the link between metabolic processes and oncogenesis, and have noted that altered metabolism is an important element that contributes to the etiology of cancer (Pavlova and Thompson, 2016). Drugs targeting key regulators of aerobic glycolysis are being developed to be included in the cancer therapy regimen (Weinberg and Chandel, 2015; Galluzzi et al., 2013). Several oncogenic pathways, including PI3K/TOR, JNK, Ras/ERK, regulate the catalytic activity or expression of key metabolic enzymes (Chambers and LoGrasso, 2011; Jones and Thompson, 2009; DeBerardinis et al., 2008).
Perhaps not any longer universally supported by modern evidence in cancer-metabolism, Warburg had also proposed that cancer cells undergo a glycolytic shift for the purpose of generating the bioenergetic makeup of the rapidly dividing cell (Warburg, 1956a). Pyruvate is the key metabolite that is used to control the last step of glycolysis in a tumor, and in the presence of lactate dehydrogenase (LDH), pyruvate is converted to lactate. In contrast, oxidative phosphorylation requires the mitochondrial enzyme complex pyruvate dehydrogenase (PDH) that converts pyruvate to acetyl-CoA, essential for the initiation of the tricarboxylic acid (TCA) cycle (Linn et al., 1969; Leiter et al., 1978). PDH is rendered inactive when it is phosphorylated by pyruvate dehydrogenase kinase (PDHK) and is activated when dephosphorylated by the phosphatase, PDHP (Harris et al., 2002; Bowker-Kinley et al., 1998). Many cancers maintain high ox-phos as well as glycolysis, maximizing the anapleuretic functions of the cell that provide the building blocks for lipid, protein and nucleotide synthesis.
The mammalian transcription factor, Hypoxia-inducible factor-1α (Hif-1α; called Sima or Hifα in Drosophila), regulates a number of target genes that promote various aspects of cancer, including metabolism, angiogenesis, cell survival, drug resistance, and invasive motility (Wykoff et al., 2000; Carmeliet et al., 1998; Ryan et al., 1998; Pennacchietti et al., 2003; Ema et al., 1997; Semenza, 2003; Dang and Semenza, 1999). Hif-1α participates in this process as hypoxia favors glycolysis over oxidative phosphorylation for ATP generation (Zhong et al., 2000; Keith and Simon, 2007; Bertout et al., 2008; Dang and Semenza, 1999; Kim et al., 2006). Hypoxia has been the proposed mechanism for oncogenes to effect a change in metabolic state (Finley et al., 2013; Ying et al., 2012; Vander Heiden et al., 2009; Levine and Puzio-Kuter, 2010; Fukuda et al., 2002). Mammalian studies often involve immortalized cell-lines with a variable and often unknown genetic background. Furthermore, while initiation of glycolysis has been studied (Lunt and Vander Heiden, 2011), the mechanism for the maintenance of the altered metabolic state under normoxic conditions is not as clear. Using Drosophila as a model system, we provide here, a complete genetic dissection of one mechanism that leads to and sustains a metabolic reprogramming in which Hifα, but not hypoxia, plays an important role.
Hif-1α and c-Jun N-terminal kinase (JNK) are associated together in many tumor types (Comerford et al., 2004; Laderoute et al., 2004; An et al., 2013). It is well established that reactive oxygen species (ROS) such as superoxide and peroxide radicals can cause both activation of the JNK pathway (Lo et al., 1996; Owusu-Ansah and Banerjee, 2009) and stabilization of Hif-1α (Dröge, 2002; Chandel et al., 2000). It is increasingly apparent that persistent activation of JNK signaling is involved in cancer development, progression and perhaps cellular transformation (Manning and Davis, 2003; Raitano et al., 1995; Smeal et al., 1991; Wagner and Nebreda, 2009). In addition to the above functions, it is likely that JNK could have an indirect role in attenuating oxidative phosphorylation by activating PDHK, thus blocking PDH function (Zhou et al., 2009, 2008). Determining how a variety of oncogenic pathways interact together to cause the metabolic reprogramming from oxidative phosphorylation to glycolysis is the central focus of this investigation. We achieve this by activating a single oncogene and show that this leads to a cascade of events that ultimately cause a glycolytic activation and allow maintenance of this altered metabolic state. There are multiple ways to model the 'Warburg effect'. This study takes advantage of the powerful genetic techniques in Drosophila used to identify epistatic relationships to provide a comprehensive and mechanistic basis for the establishment and maintenance of this metabolic transition in a receptor tyrosine kinase (RTK) induced tumor.
Results
LDH activation and transcription by a specific RTK
Aerobic glycolysis in tumors is characterized by the conversion of pyruvate to lactate by the enzyme, lactate dehydrogenase (LDH). Importantly, LDH has been demonstrated to be a marker for poor prognosis in multiple malignancies such as renal cell carcinoma (Armstrong et al., 2012). The Drosophila genome contains a single gene encoding an LDH enzyme (ImpL3), and biochemical studies demonstrate that it functions most like LDHA, the human form predominantly expressed in skeletal muscle that favors the conversion of pyruvate to lactate (Rechsteiner, 1970). An increase in LDHA enzymatic activity has been observed in diverse malignant cancers (Dang and Semenza, 1999).
We adapted a classic biochemical enzymatic assay (Abu-Shumays and Fristrom, 1997) to visualize the activity of LDH in vivo. Endogenous LDH activity is not observed in epithelial imaginal tissues such as the wing and eye discs (Figure 1a; Figure 1—figure supplement 1a) that developmentally mature in the larva to give rise to the corresponding appendages in the adult (Swammerdam, 1737), although evidence for such endogenous expression can be observed in the brain and salivary glands (Figure 1—figure supplement 1c–d). Using the Gal4/UAS system (Brand and Perrimon, 1993) to individually activate oncogenes in the wing disc, we found that the activated PDGF/VEGF receptor (known as Pvr) causes robust LDH activity (Figure 1b) while many other oncogenes do not (see later).
Figure 1 with 1 supplement see all

LDH induction by a single activated oncogene.
Wing discs are from wandering third instar larvae. Scale bars, 50 μm. (a–b) LDH enzymatic activity is induced by Pvract (full genotype: dppblk-1-Gal4, UAS- GFP, UAS-Pvract) stained for LDH activity (brown precipitate). The green channel is not shown in this panel for clarity. (a) Control, (dpp-Gal4, UAS-GFP) no detectable LDH enzymatic activity. (b) Expression of Pvract (dpp-Gal4, UAS-GFP, UAS-Pvract) induces LDH activity. (c–j) LDH-GFP transgene induction (shown in green) monitors the expression of LDH. Nuclei are marked with To-Pro (blue). Full genotype in each panel includes the driver (dppblk-1-Gal4), a UAS-transgene as indicated and mCherry to mark expressing cells (red channel omitted for clarity). (c) Control. No LDH-GFP expression is detected in dpp-Gal4, UAS-mCherry wing disc. (d) Pvract (dpp-Gal4, UAS-mCherry, UAS-Pvract) causes robust LDH-GFP induction. (e–j) Either no expression or very mild expression (arrows in e, h) of LDH is seen when Rasact (e), wingless (f), unpaired (g), yorkie (h), InRact (i), or Egfract (j) transgenes are expressed under the control of dpp-Gal4 in the wing disc.
To determine whether the increase in LDH activity is due to an increase in LDH transcription, a GFP-based enhancer trap (Quiñones-Coello et al., 2007) was used to visualize LDH expression. This reporter (called LDH-GFP) consists of EGFP inserted within 50 base pairs upstream of the LDH transcriptional start site within its native locus. LDH-GFP is a direct insertion of GFP into the endogenous LDH locus and is not affected when combined with UAS/Gal4 constructs. As expected, no GFP is detected in the developing wild-type wing or eye disc of LDH-GFP larvae that are otherwise wild type (Figure 2c; Figure 1—figure supplement 1b), and similar to the results of the activity assay, endogenous LDH-GFP expression is readily apparent in the brain and in the salivary gland (Figure 1—figure supplement 1c–d). However, in a dppblk1Gal4, UAS-Pvractgenetic background, in which Pvract is mis-expressed along the anterior/posterior boundary of the wing disc, a large tumorous overgrowth is observed with the mutant cells exhibiting robust LDH-GFP expression (Figure 1d). Ras1act, functioning downstream,also causessome LDH expression, but this effect is modest compared to that seen with activation of Pvr (Figure 1e). Together, the enzyme and the reporter assay establish that activation of PDGF/VEGF Receptor leads to transcriptional up-regulation of LDH and the subsequent formation of active LDH enzyme in the tumor tissue.
Figure 2 with 1 supplement see all
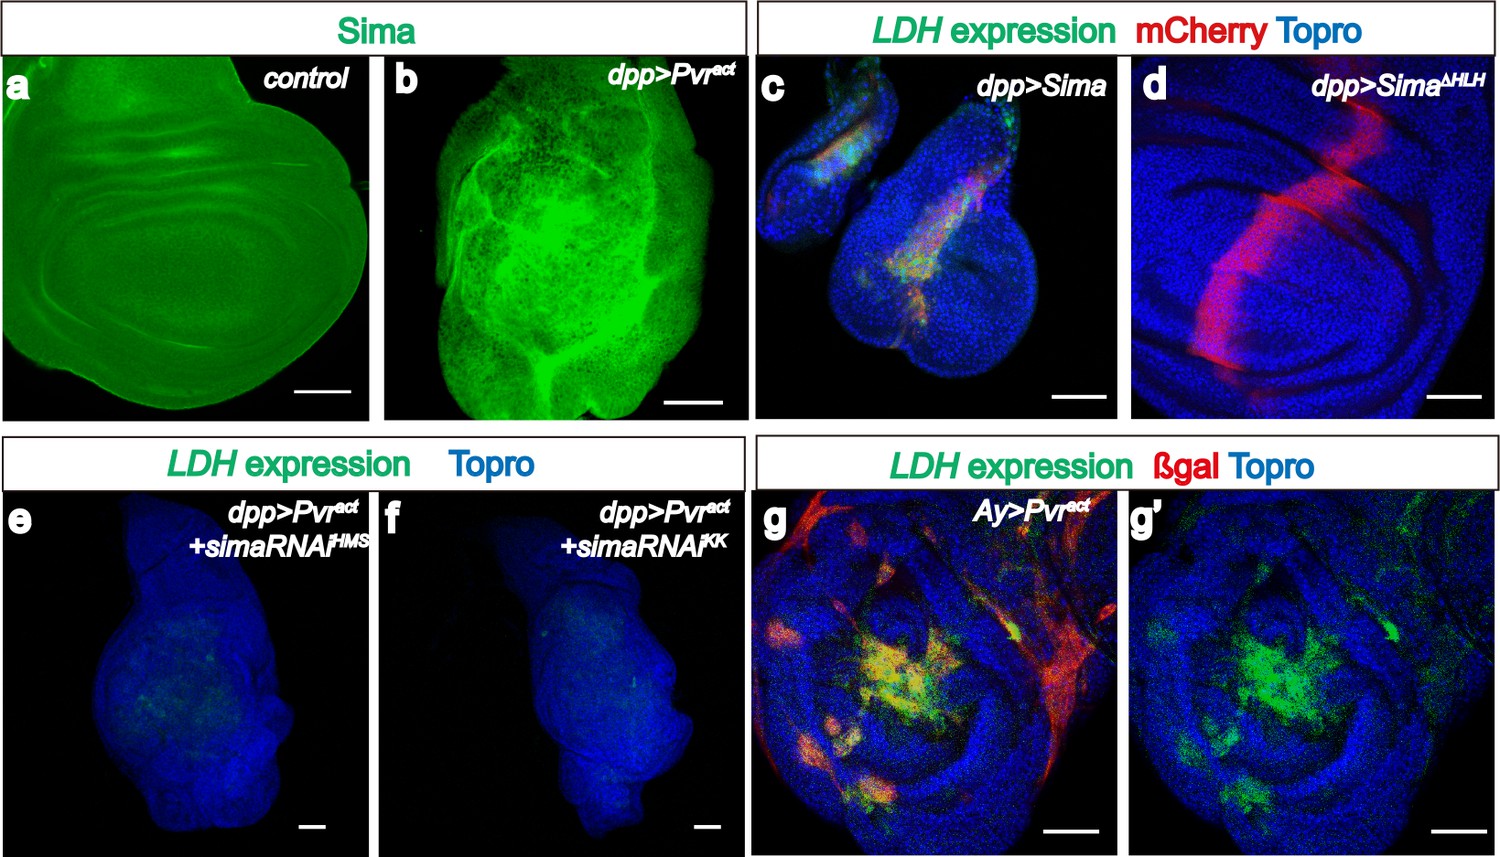
Sima mediates LDH expression.
All wing discs shown are from wandering third instar larvae. All transgenes are driven using dppblk-1-Gal4. Scale bars, 50 μm. Nuclei are marked with To-Pro (blue). (a–b) Sima protein accumulation upon Pvract expression is detected with an α-Sima antibody (green). The expression domains are independently marked (not shown for clarity). (c–d) Direct overexpression of Sima protein (c), but not Sima lacking DNA-binding domain (d) leads to LDH-GFP (green) expression. mCherry (red) independently marks the zone of expression. (e–f) Two independent RNAi constructs against Sima (simaRNAiHMS and simaRNAiKK) can each suppress Pvract-induced expression of LDH-GFP. (g–g’) Ay-Gal4 induced small clones expressing Pvract (g, marked in red) autonomously induces LDH-GFP (green) (hs-flp, UAS-lacZ, UAS-Pvract).
Expression of many oncogenes cause large tumorous overgrowths that superficially look like the Pvr induced tumors. However, LDH is not expressed in every tumor that shows increased cell proliferation and over-growth. For example, over-expression of the secreted ligand, Wingless (Neumann and Cohen, 1996), causes overgrowth and duplication of the tissue but does not cause LDH expression (Figure 1f). Similarly, overexpression of the JAK/STAT pathway ligand Unpaired (Upd), promotes tissue growth (Chao et al., 2004; Rodrigues et al., 2012), but does not induce LDH expression (Figure 1g). The transcription factor Yorkie is a potent growth-promoting signal in the wing disc (Huang et al., 2005), but at best, it induces very weak and variable expression of LDH-GFP in the wing pouch (Figure 1h). These results indicate that the up-regulation of LDH by Pvr is not a general consequence of stepped up cell proliferation seen in all tumors.
Furthermore, given Pvr’s function as an RTK, it was initially a surprise to find that neither constitutively signaling form of the insulin receptor (InRact, Figure 1i) nor the activated form of epidermal growth factor receptor (Egfract; Figure 1j) can induce LDH-GFP expression even though both cause significant overgrowth of the tissue. This observed specificity of Pvr, compared with other RTKs, in the expression of LDH, presents a unique opportunity for investigating the mechanism by which an oncogene can regulate the metabolism of a tumor tissue.
Hif-1α is a well-known inducer of LDHA expression in many cancer cell lines (Dang and Semenza, 1999). As with the mammalian counterpart, Drosophila Hifα (called Sima) is rapidly degraded under normoxic conditions and therefore no Sima protein is detected in the wild-type wing disc (Figure 2a), but Sima protein is stabilized in a Pvract background (Figure 2b). Overexpression of Sima (but not of a Sima mutant lacking its DNA binding domain) robustly induces both LDH activity and expression (Figure 2c–d; Figure 2—figure supplement 1a). It also causes growth defects, similar to the phenotypes of the Hph mutant (Centanin et al., 2005). These growth defects associated with gross overactivity of Sima are likely independent of its role in hypoxia related responses.
Importantly, LDH expression induced by Pvract is strongly suppressed upon silencing sima using either one of two independent transgenic RNAi constructs (Figure 2e–f). Thus, Sima is essential for LDH induction by Pvract. Knockdown of sima does suppress some of the overgrowth caused by Pvract, but this effect is small (about a 20% reduction in volume. see Figure 2—figure supplement 1b) and the tumor-growth loss is clearly not as robust as the complete loss of LDH-GFP seen using the same knockdown construct. We conclude that tumor growth is a result of multiple interacting events, and blocking glycolysis alone will not be sufficient to fully rescue the growth of a tumor.
The Pvr induced tumor is characterized by unrestrained, disorganized growth, and in principle, one mechanism for Sima stabilization could involve the hypoxic environment that might exist within the disorganized mass of a tumor tissue. Examples of such a mechanism in which deeper tissues within solid tumors become hypoxic have been demonstrated in human cancers (Bertout et al., 2008; Keith and Simon, 2007). However, it is also true that in addition to hypoxia, Hif can be stabilized under normoxic conditions by multiple metabolites such as NO, ROS, succinate, and fumarate (Chandel et al., 2000; Isaacs et al., 2005; Selak et al., 2005; Mateo et al., 2003). To address whether the Pvr induced LDH-GFP expression is specifically due to a hypoxic core within a tumor, we utilized the AyGal4 system (Ito et al., 1997) to generate flip-out clones expressing Pvract. This technique allows analysis of LDH expression in single or small groups of cells expressing Pvract that are surrounded by normal tissue. Under these conditions, there is no over-growth or tumor formation, yet these single/small number cell clones express LDH in a strikingly cell-autonomous fashion (Figure 2g). We conclude that a large tumor with a hypoxic core is not a requirement for Sima stabilization or LDH expression.
Both ERK and PI3K pathways are necessary for LDH expression
Ras is the major effector of RTK signaling (Moodie et al., 1993; Vivanco and Sawyers, 2002), and indeed we have found that constitutively active dRas1 is sufficient for a small increase in LDH expression and activity (Figure 1e). Also, induction of LDH by Pvract is suppressed by a dominant-negative mutant allele of Ras (dRas1N17) (Lee et al., 1996) (Figure 3h). Interestingly, although Ras is downstream of both the EGFR and InR (Insulin receptor) pathways, on their own, neither Egfract nor InRact causes LDH expression even as they individually cause overgrowth (Figure 1i–j). We found that Egfract causes phosphorylation of ERK but not AKT (Figure 3a,d), while InRact activates Akt but not ERK (Figure 3b,e). In this system, Pvract induces both pathways (Figure 3c,f) and thus we tested the function of each pathway and then both in combination in the control of LDH expression. RNAi initiated knock down of Dsor1 (MAPKK) or ERK (Rl, rolled), potently suppresses LDH-GFP induction downstream of Pvract (Figure 3i–j). Thus, ERK pathway is essential for Pvr-mediated LDH upregulation.
Figure 3 with 1 supplement see all

Downstream of Pvract, ERK and PI3K pathways control Sima translation.
All wing discs shown are from wandering third instar larvae. All transgenes are expressed using the dppblk-1-Gal4 driver. Scale bars, 50 μm. (a–f) Differential activation of ERK and PI3K pathways by RTKs. Phospho-specific antibodies against dp-ERK (a–c, green) or p-Akt (d–f, green) are used to detect activation of the corresponding pathways. (a–c) dp-ERK staining is seen in in Egfract(a) and Pvract(c) backgrounds, but not upon activation of InR (b). (d–f) In contrast to (a–c), p-Akt is detected upon activation of InR (e) and Pvr (f) but not Egfr (d). Thus only Pvract causes both the ERK (assayed by ERK phosphorylation) and PI3K (assayed by Akt phosphorylation) pathways to be activated. (g–v) Both PI3K and ERK pathways must be activated for LDH-GFP induction. Expression of LDH-GFP (green) marks glycolytic tissue. In (r), the Ay-Gal4 system is used to generate clones with nuclear β-Galactosidase staining (red) marking the clones. LDH-GFP (green) expression (g; Pvract control) is suppressed upon loss of ERK pathway members Ras (using a dominant negative, h), Downstream of Raf1, (Dsor1, using an RNAi construct, i), and ERK (Rolled, using an RNAi construct, j). (k–n) PI3K pathway components are also essential for LDH-GFP expression. LDH-GFP (green) expression (g; Pvract control) is suppressed upon loss of PI3K pathway members Ras (using a dominant negative, h), PI3K (using an RNAi construct, k or a dominant negative version, l), Akt (using an RNAi construct, m), or TOR (RNAi; n). (o–r) ERK and PI3K pathways must be co-activated for LDH expression. (o–p) Single activation of the ERK pathway (using hRafact; o), or of the PI3K pathway (using PI3Kact; p) is insufficient for LDH-GFP expression. (q,r) Co-activation of both pathways by co-expression of hRafact and PI3Kact together, either using a dpp-Gal4 driver (q) or in small Ay-Gal4-derived clones (r) induces robust LDH-GFP expression. (s–v) Translational regulators are essential for LDH transcriptional control. A dominant-negative form of S6k (s) or overexpression of Thor/4EBP (u), both acting downstream of PI3K as well as loss of a single copy of Mnk/Lk6 (t), functioning downstream of ERK, abolish transcription of LDH-GFP. In contrast, loss of the major transcriptional factor in the ERK pathway, the ETS domain protein, Pointed (v) has no effect on LDH transcription.
Similarly, when we blocked PI3K signaling in a Pvract background using several independent ways, including co-expression of an RNAi against PI3K (Figure 3k), a dominant-negative mutant form of PI3K (Figure 3l), inactivation of Akt by RNAi (Figure 3m), or silencing dTOR by RNAi (Figure 3n), each combination suppresses the induction of LDH-GFP. Finally, Pvract dependent accumulation of Sima protein is significantly suppressed when either Dsor1 or Akt is silenced (Figure 3—figure supplement 1a–b). Thus, the PI3K/Akt/TOR axis is also definitively needed for LDH regulation.
Importantly, individual overexpression of either an activated form of human Raf (hRafact) or a constitutively active form of PI3K (PI3Kact, active due to a mutation in the p110α catalytic subunit) (Brand and Perrimon, 1994; Leevers et al., 1996) does not induce LDH-GFP expression although each genotype causes significant over-growth (Figure 3o–p). In combination, however, co-expression of hRafact and PI3Kact either using drivers or in small clones, leads to extensive LDH induction even more robustly than what is seen for Pvract (Figure 3q–r). Furthermore, dual PI3K/ERK activation is also sufficient to increase Sima expression (Figure 3—figure supplement 1c–d). Knock down of Sima significantly attenuates PI3K/ERK induced LDH-GFP expression (Figure 3—figure supplement 1h–i). Similar to its role in mediating Pvract induced LDH expression, this demonstrates that Sima is the critical regulator of glycolytic genes upon co-activating PI3K and ERK pathways. We conclude that a combination of ERK and PI3K signaling is both necessary and sufficient to induce Hifα-dependent LDH induction. On its own, each signal is necessary but not sufficient to cause LDH expression.
InR/TOR pathway is associated with translational control in diverse systems (Fukuda et al., 2002; Hay and Sonenberg, 2004). In particular, both translation and degradation critically control Hifα level (Bacon et al., 1998; Gorr et al., 2004). Consistent with this notion, the induction of LDH by Pvract/Sima remains unaffected when Pointed (Drosophila ETS2), the well–established direct nuclear target of the ERK pathway (O'Neill et al., 1994), is mutated (Figure 3v). In contrast, the ribosomal S6 kinase, a known target of TOR signaling that promotes translation of a subset of mRNA transcripts, including Hif-1α (Ma and Blenis, 2009) is prominently involved in this process since a dominant-negative form of S6k is a strong suppressor of Pvr-mediated LDH induction and Sima accumulation (Figure 3s and Figure 3—figure supplement 1f). The ERK signal also modulates protein translation through the Mnk kinase (LK6 in Drosophila). Lk6 binds ERK and phosphorylates the initiation factor eIF4E to promote Cap dependent translation (Arquier et al., 2005; Parra-Palau et al., 2005). Strikingly, we find that a single-copy loss of lk6 strongly suppresses LDH induction and Sima accumulation downstream of Pvr (Figure 3t and Figure 3—figure supplement 1g). Finally, published literature (Miron et al., 2001) has established 4E-BP (Thor) as a downstream effector of the PI3K/Akt pathway that forms a complex with elF4E and inhibits translation. mTOR phosphorylates 4E-BP releasing it from eIF4E (Furic et al., 2010) allowing efficient translation. We found that co-expression of 4E-BP with Pvract suppresses LDH induction (Figure 3u). Taken together, these data strongly support a mechanism in which ERK and PI3K pathways converge at the level of translational control of gene products including Sima. We propose that initially, the increased translation of sima transcript generates sufficient Sima protein (in excess of the rate of Sima degradation), leading to LDH induction; later we will show that this reprogramming is further augmented by a feedback loop involving ROS.
Pvract induced metabolic changes
Intensification of glycolytic pathway
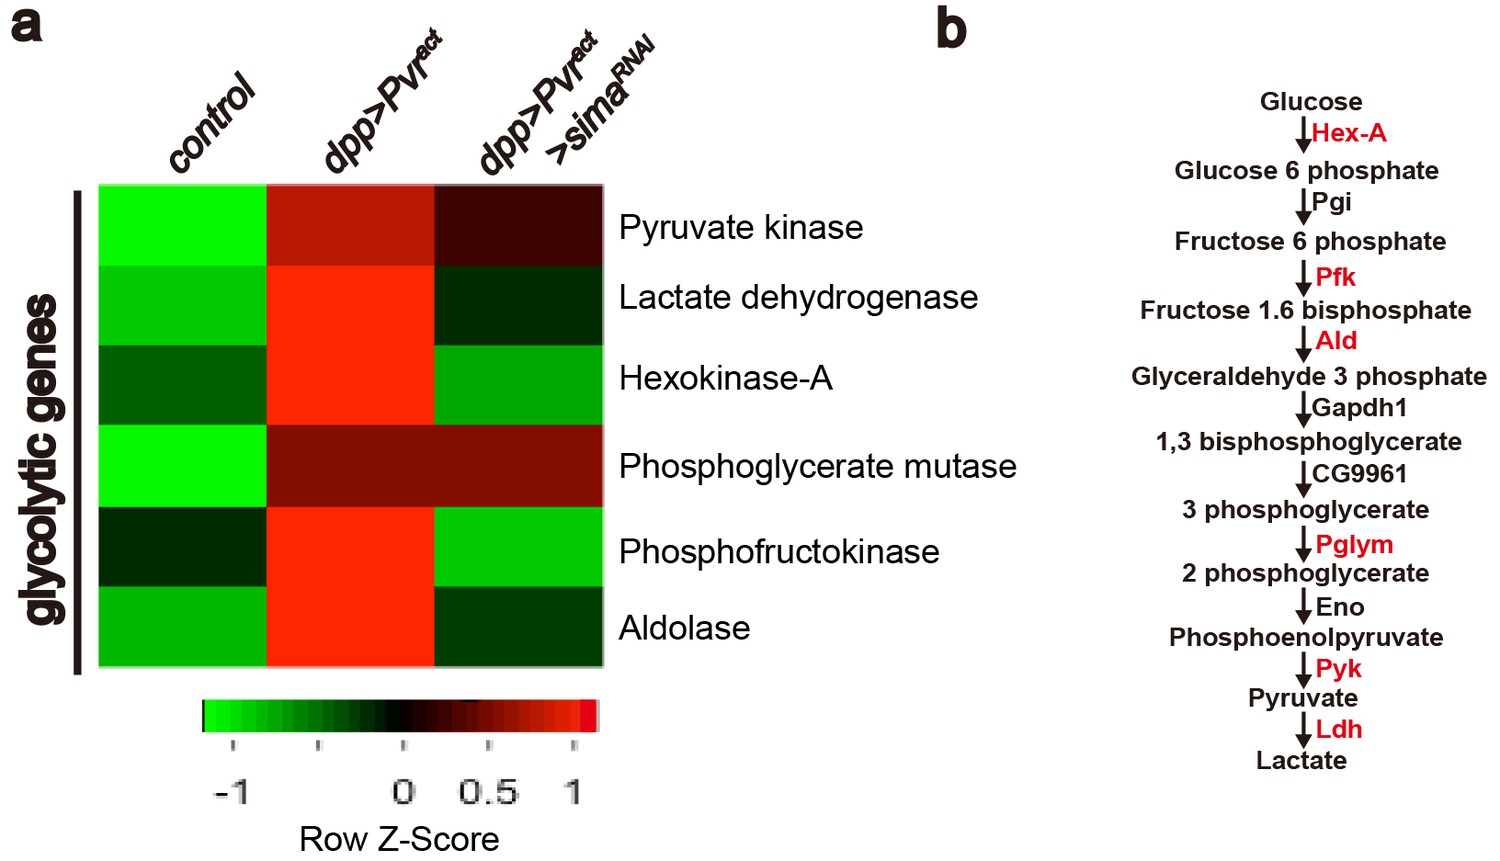
In order to gain better understanding of the transcriptional basis of Pvr-induced glycolytic transition at a genome-wide level and the role of sima in the regulation of this process, we carried out an RNA-Seq experiment in which transcriptomes of wild-type wing imaginal discs were compared with those with the genotypes Pvract(glycolytic activity), or InRact(no detectable glycolytic activity) or Pvract + simaRNAi (glycolytic activity suppressed). Each genotype was analyzed in triplicate. The data were filtered for the GO term 'metabolism', and further sorted for genes that are up-regulated in Pvract but not in InRact background.Amongst this subset, transcripts that are down-regulated in Pvract + simaRNAi background were analyzed further. Our results confirm the transcriptional up-regulation of LDH. Interestingly, the transcription of six of the ten glycolytic enzymes is up-regulated in a Pvract background of which four –Hex-A, Pfk, Ald and Impl3- are regulated in a Sima dependent manner (Figure 4a–b). The 73 sima-dependent metabolic genes identified in this assay are listed in Figure 4—figure supplement 1. GO and network analysis reveal enrichment in biological function for genes involved in regulating rate-limiting steps of glycolysis. Hex-A (hexokinase-A) phosphorylates glucose to generate glucose 6-p in the first step of glycolysis. Similarly, Pfk (phosphofructo kinase) phosphorylates fructose 1-p to generate fructose 1,6-bp, whereas Ald (Aldolase) converts fructose 1,6-bp to glyceraldehyde 3-p in the next step. Impl3/LDH (lactate dehydrogenase) converts pyruvate to lactate in the final step of glycolysis. Pvr and Sima-dependent regulation of these key enzymes indicates a more efficient usage of the entire glycolytic pathway.
Figure 4 with 1 supplement see all
Heat map of sima-dependent glycolytic gene expression.
An unsupervised hierarchical cluster heat map based on differential mRNA expression patterns yielded 73 sima-dependent genes responding to the GO term analysis as metabolic genes (see Figure 4—figure supplement 1). This includes transcripts for six up-regulated enzymes (marked in red) that belong to the glycolytic pathway (b). RNAs for four glycolytic enzymes are induced by Pvract in a Sima dependent manner (a).
Attenuation of oxidative phosphorylation
In addition to displaying increased aerobic glycolysis, a subset of cancer cells also attenuate mitochondrial respiration (Pelicano et al., 2006; Warburg, 1956a, 1956b). The RNA-seq data identifies a set of transcripts encoding mitochondrial proteins that is down-regulated in Pvract background. Attenuation of ETC complex protein activity has also been demonstrated to up-regulate transcripts for all glycolytic enzymes suggesting a cross talk between the two primary modes of metabolism (Owusu-Ansah et al., 2008).
Just as LDH drives glycolysis by converting pyruvate to lactate, pyruvate dehydrogenase (PDH) drives the TCA cycle and oxidative phosphorylation by converting pyruvate to acetyl-CoA. PDH is inactive when phosphorylated by p-PDHK. When stained with appropriate antibodies, Pvract cells are found to express PDHKtotal, active PDHK (phospho-PDHK), as well as the inactive form of PDH (p-PDH) (Figure 5a–f). The high p-PDH level is suppressed by co-expressing PDHK-dsRNA (Figure 5—figure supplement 1a) establishing that PDHK is indeed required for inactivation of PDH in Pvract cells.
Figure 5 with 1 supplement see all
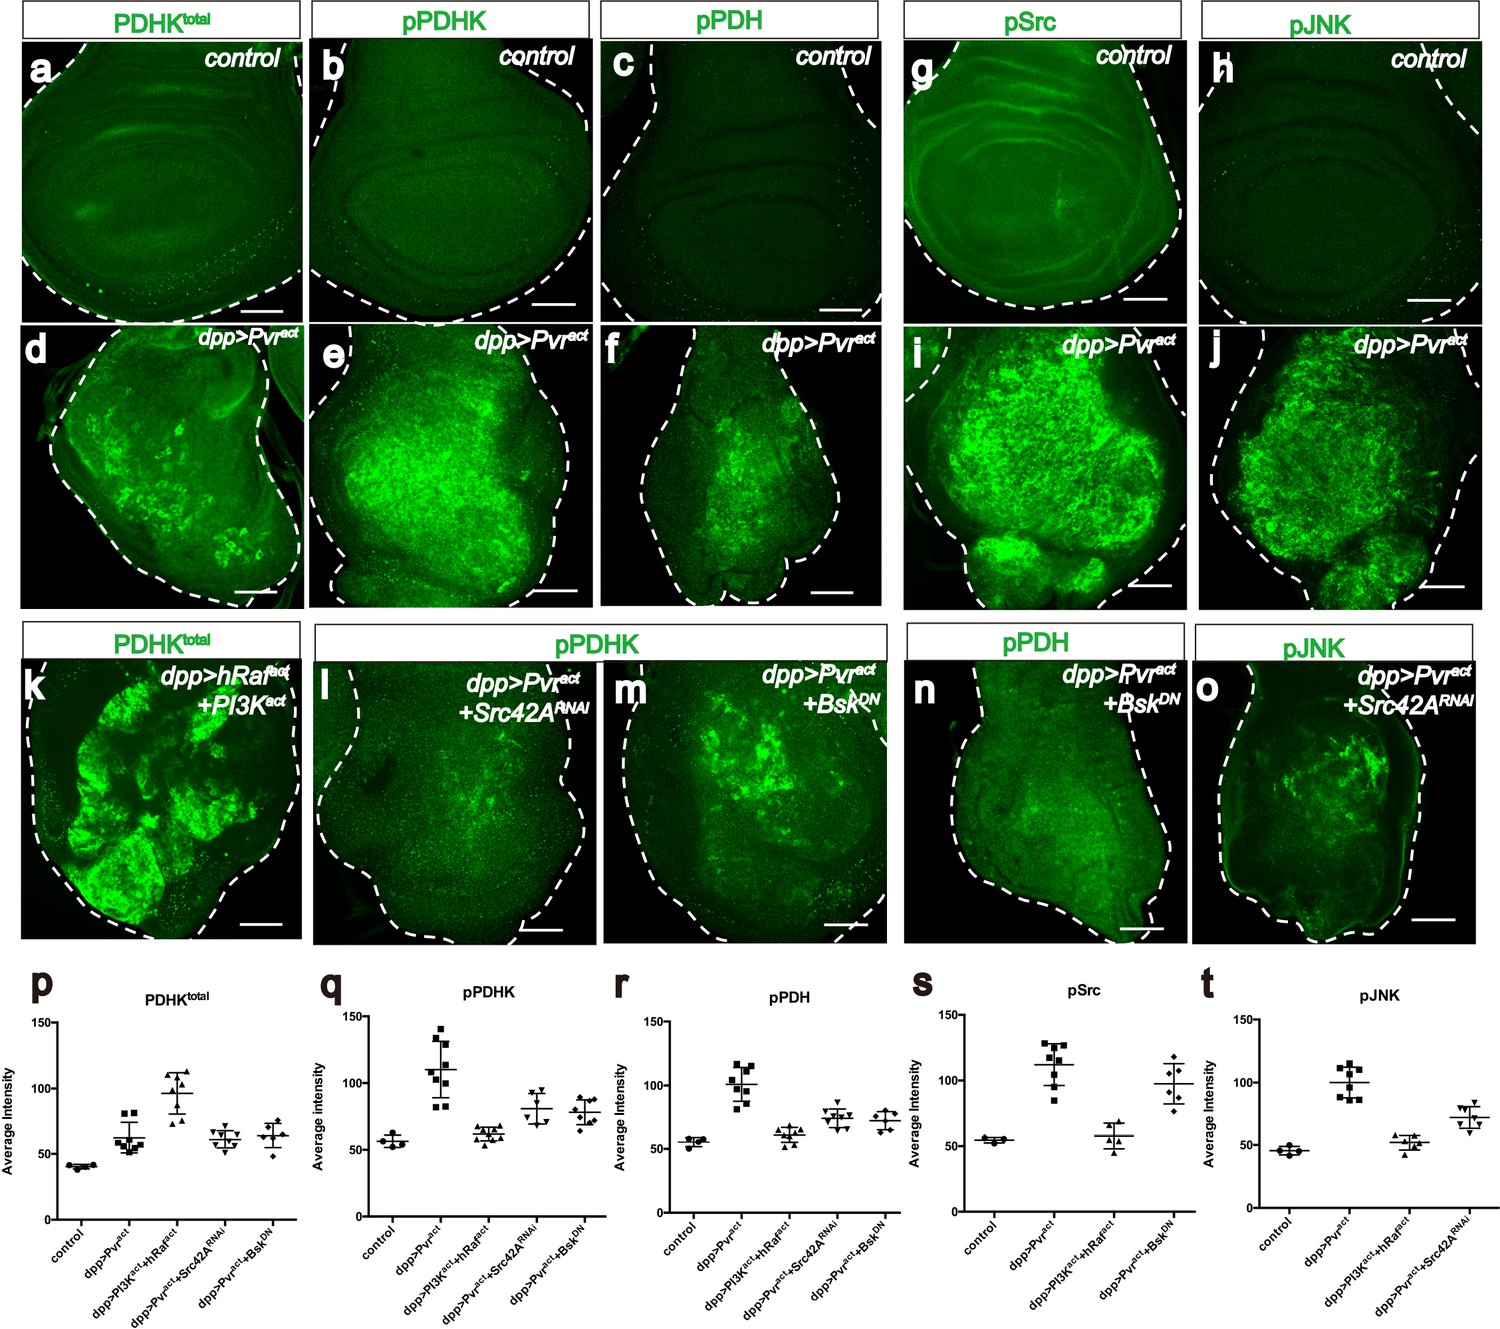
Src42A and JNK inhibit mitochondrial function by regulating PDHK activity.
All wing discs shown are from wandering third instar larvae. All transgenes are expressed using the dppblk-1-Gal4 driver. Scale bars, 50 μm. (a–f) Pvract up-regulates PDHK expression as well as its activity. Total PDHK protein expression detected using an α-PDHK1 antibody (a, d, green) while phospho PDHK-specific antibody detects only the activated form (b, e, green). p-PDH (c, f, green) is detected only if PDH is phosphorylated and inactivated by p-PDHK. Compared to control, Pvract tissue shows elevated expression of PDHKtotal (a, d), p-PDHK (b, e), and p-PDH (c, f). (g–j) Pvract activates Src and JNK. Compared with controls, Pvract tissue shows increased expression of activated Src ((g, i) phospho Src specific, green) and activated p-JNK ((h, j) phospho JNK specific, green). (k) Co-activation of ERK and PI3K pathways dramatically increases PDHKtotal (green) expression, but this PDHK is inactive (see Supplementary Figure 5c). (l–o) Src and JNK activate PDHK, which in turn inactivates PDH. p-PDHK (green) is suppressed upon loss of Src42A (using RNAi; l), or JNK (using a dominant-negative version BskDN; m). (n) Reduction in JNK signaling reduces p-PDH (o) Reduction in Src42A suppresses p-JNK (green) but loss of JNK does not affect p-Src (s) suggesting that JNK functions downstream of Src42A. (p–t) Quantitative analysis of p-PDHK, p-PDH, p-Src, p-JNK expression in various genotypes, indicated in each graph. Error bars indicate standard error of the mean with significance determined by t-test. (p) Activation of either Pvr or a combination of ERK and PI3K pathways causes translational up-regulation of PDHK protein (p=0.0045 and 0.0001), independent of Src and JNK (p=0.7864 and 0.7935). (q) Activation of PDHK by phosphorylation required Src and JNK function (p=0.0086, 0.0005 and 0.0013) downstream of Pvr, but is independent of the PI3K and ERK pathways (p=0.0978). (r) Src and JNK function downstream of Pvr (p=0.0002 and 0.0005), independent of PI3K/ERK pathway (p=0.1201) to inactivate PDH. (s) Pvr activates Src (p=0.0002). This regulation is independent of ERK/PI3K pathways (p=0.6064). (t) JNK phosphorylation requires Src (p=0.0002) but Src phosphorylation does not require JNK (p=0.1117). The regulation of JNK is independent of the ERK and PI3K pathways (p=0.0855).
-
Figure 5—source data 1
The numerical data for Figure 5p–t.
The quantitative intensity values of immuno-stainning (pPDHK, totalPDHK, pPDH, pSrc, pJNK) images between different genotype used in Figure 5p–t are shown.
- https://doi.org/10.7554/eLife.18126.011
An antibody that recognizes both the active and the inactive forms of PDHK shows that co-expression of hRafact and PI3Kact results in dramatic up-regulation of PDHKtotal. Similar to the results obtained for Sima, the regulation of PDHK protein is also at a translational level (Figure 5k; Figure 5—figure supplement 1o,q). Interestingly, while the combined activation of PI3Kact and hRafact is sufficient for PDHK production, the protein thus produced is inactive and is not recognized by a phospho-specific, p-PDHK antibody (Figure 5—figure supplement 1c). This is unlike in Pvract cells where both PDHKtotal and PDHKactive are seen (Figure 5d–e). Consistent with this observation, p-PDH (the inactive form of PDH) is also not seen when hRafact and PI3Kact are co-expressed (Figure 5—figure supplement 1b), and yet is readily detectable in a Pvract background (Figure 5f). These results establish that additional proteins independent of ERK and PI3K pathways function downstream of Pvr and are necessary to activate PDHK and thus inhibit PDH and mitochondrial oxidative phosphorylation.
Src42A, a Drosophila c-src proto-oncogene homolog, functions in epidermal closure during both embryogenesis and metamorphosis by regulating JNK signaling (Tateno et al., 2000). It has also been found that Src42A controls tumor invasion and cell death by activating JNK (Ma et al., 2013). In mammalian cancer studies, Src mediates tumor cell metastasis and angiogenesis induced by VEGF (Eliceiri et al., 1999; Weis et al., 2004). Using phospho-specific antibodies, we found that both Src42A and JNK are extensively phosphorylated in Pvract cells (Figure 5g–j). Knockdown of Src42A suppresses phospho-JNK accumulation induced by Pvract (Figure 5o), whereas over-expression of a dominant negative form of JNK (BskDN) does not significantly reduce phospho-Src levels (Figure 5s) indicating that Src42A functions upstream of JNK.
Knockdown of Src42A, or over-expression of BskDN partially suppresses the phosphorylation level of PDHK induced by Pvract (Figure 5l–m). As shown earlier, co-expression of hRafact and PI3Kact is unable to increase p-PDHK levels (Figure 5—figure supplement 1c), but the simultaneous activation of ERK, PI3K and JNK pathways by using hRafact, PI3Kact and active JNKK (hemipterous, hepact), clearly up-regulates PDHK activity (Figure 5—figure supplement 1d), and the resulting effect on PDH is also dramatic. A dominant negative form of JNK (BskDN) or loss of JNKK (hemipterous, hepRNAi) suppresses the formation of p-PDH upon Pvr activation (Figure 5n; Figure 5—figure supplement 1e). Thus JNK is required for activation of p-PDHK and as a result, sufficient to inactivate PDH by causing its phosphorylation.
In summary, the above results show that:
Src functions downstream of Pvr, independent of the PI3K/ERK pathway (Figure 5p; Figure 5—figure supplement 1g)
JNK functions downstream of Pvr and Src, independent of the PI3K/ERK pathway (Figure 5q,s; Figure 5—figure supplement 1h)
Activation of the ERK/PI3K pathways downstream of Pvr, causes translational up-regulation of the PDHK protein; neither Src nor JNK has a role in controlling total PDHK protein level (Figure 5p; Figure 5—figure supplement 1i,j,q)
The PDHK protein produced by the PI3K/ERK pathway is catalytically inactive. The activation process produces phospho-PDHK and involves the Src/JNK pathway (Figure 5l,m,q)
p-PDHK is necessary for inactivating PDH by phosphorylation. It follows that the process of phosphorylation dependent PDH inactivation is downstream of Src and JNk (Figure 5r; Figure 5—figure supplement 1e,f).
Feedback loops to strengthen the metabolic reprogramming
Although over-active PDH can promote reactive oxygen species (ROS) production during high mitochondrial flux (Kaplon et al., 2013), dysfunction of PDH within the mitochondrion is invariably associated with increased production of ROS (Glushakova et al., 2011; Ambrus et al., 2011). Thus, Pvract cells exhibit high ROS levels detected by direct staining with the DHE dye (Figure 6a–b) or as monitored by gstD-GFP expression (Robinson et al., 2006) (Figure 6c–d) frequently used as a surrogate for ROS, marking cells under oxidative stress (Ohsawa et al., 2012; Sykiotis and Bohmann, 2008). This ROS induction is suppressed when PDHKRNAi is co-expressed (Figure 6—figure supplement 1a).
Figure 6 with 1 supplement see all

ROS strengthens the metabolic reprogramming.
All wing discs shown are from wandering third instar larvae. All transgenes are expressed using the dppblk-1-Gal4 driver. Nuclei are marked with DAPI (blue; c–l). Scale bars, 50 μm. (a–f) JNK mediates ROS induction. DHE staining (green; a, b) directly monitors ROS levels and gstD-GFP expression (green; c–f) is a measure of oxidative stress caused by the generated ROS. No detectable ROS stress is seen in control discs (a, c), while Pvract causes robust ROS and gstD generation (b, d). Co-expression of hRafact and PI3Kact does not phenocopy Pvract in causing oxidative stress (e). A dominant negative form of JNK (BskDN) effectively suppresses ROS generation (f). (g–m) A ROS feedback signal plays a central role in Pvract induced metabolic reprogramming. Sima accumulation is detected by using an α-Sima antibody (m–n). Pvract induced ROS generation (g), p-JNK expression (i), LDH expression (k), and Sima accumulation (m), are all strongly suppressed by expressing a scavenger gene, Peroxidasin (Pxn h, j, l and n).
Co-expression of hRafact and PI3Kact does not cause ROS production unlike that seen for Pvract (Figure 6e; Figure 6—figure supplement 1b). Instead, Pvract induced ROS is effectively suppressed in a BskDN (JNK dominant negative) genetic background (Figure 6f; Figure 6—figure supplement 1c). Similar effects are seen upon knockdown of hep (JNKK) or Src42A (Figure 6—figure supplement 1d–e). Thus Src-JNK signaling plays an important role in the inhibition of mitochondrial activity and in raising ROS levels in Pvract tumors.
Two notable facts about ROS have a bearing on the data presented here. The first is that ROS can activate the JNK pathway through interaction with the upstream component ASK (JNKKK) (Tobiume et al., 2001; Owusu-Ansah and Banerjee, 2009). The second is that high ROS conditions result in potent stabilization of the Hif protein even under normoxic conditions (Chandel et al., 2000; Fandrey et al., 2006). This provides the opportunity for ROS generated downstream of both Hif and JNK, to feedback and reinforce these two pathways. To test this hypothesis, several antioxidant (free radical scavenging) proteins were expressed to reduce the level of ROS. Of these, the strongest ROS scavenging activity was seen upon Peroxidasin (Pxn) expression. In addition to a decrease in ROS (Figure 6g–h), we found that JNK is no longer activated when Pxn is co-expressed in Pvract discs (Figure 6i–j). Similarly, LDH-GFP expression (Figure 6k–l) and the accumulation of Sima protein are strongly suppressed by co-expression of Pxn (Figure 6m–n). These results establish ROS as the central player in enforcing the metabolic reprogramming. Initially established through the activation of three oncogenic pathways by Pvr, the shift to glycolysis is then reinforced when ROS is generated as a subsequent step. This establishes one means to maintain a stable Warburg effect by oncogene activation.
Discussion
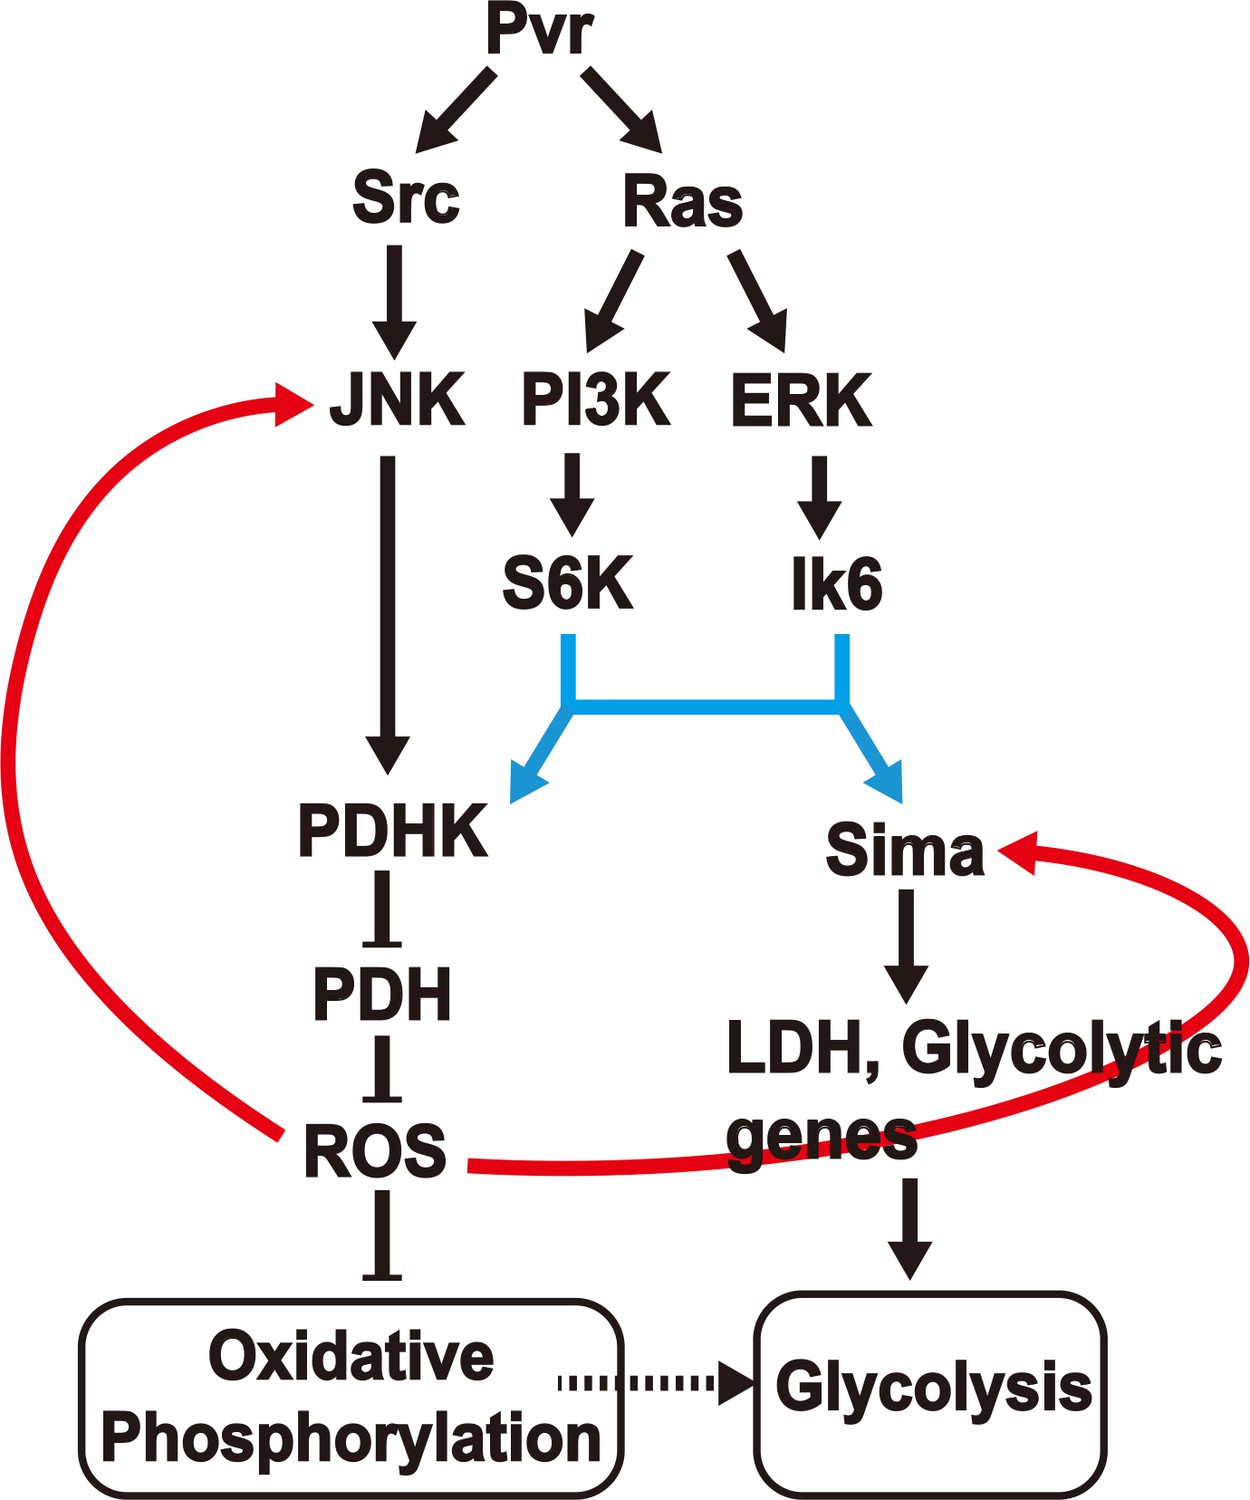
A model (Figure 7) can be constructed that is consistent with all our observations on the Pvract induced interacting network that leads to aerobic glycolysis and potentially also allows this new metabolic state to be maintained through later stages of tumor growth. This is a genetic model derived from analysis that allows placement of gene function according to their hierarchy along a pathway. Many genetic backgrounds that achieve full or partial Warburg effect have been described in the literature (Elstrom et al., 2004; Kim and Dang, 2005; Wang et al., 2011; Faubert et al., 2013; Hitosugi et al., 2009, Zhang et al., 2013, Yang et al., 2012; Hong et al., 2016; Jin et al., 2016). Although the details may seem to vary, the three critical components involved in this process are the two pyruvate-metabolism enzymes, LDH and PDH and the free radical metabolite class designated as ROS. During the acquisition of the aerobic glycolytic activity in a tumor environment, LDH actively converts pyruvate to lactate, and high PDHK inactivates PDH resulting in low pyruvate to acetyl-CoA conversion, low TCA flux and electron transport activity. Our results suggest that these events can be sustained over long periods of tumor growth only when coupled with a feed back signal from accumulating ROS in a mechanism that reinforces and enhances the high-LDH/low-PDH activity state. This genetic study was achieved in an in vivo context of an animal that is only mutant for the one specific activated oncogene that we introduce and is otherwise normal. Additional pathways are activated without accumulating new mutations. Also, while hypoxic conditions might favor a glycolytic activation in general, hypoxia is not an essential component for a tumor to become glycolytic, as in this system, where Hif is stabilized by alternative means in a normoxic environment.
Figure 7
A model for induction and maintenance of a metabolic reprogramming.
Pvract induced tumor tissues show a robust metabolic reprogramming from oxidative phosphorylation to aerobic glycolysis. The model describes the relationship between many pathways that are activated in response to the Pvract signal. ROS, generated as a consequence of the initial metabolic reprogramming feeds back to upstream components, to consolidate and maintain the Warburg effect. See text for details.
Pvract triggers two parallel pathways in a Ras dependent manner. The first is the PI3K/Akt pathway that targets the S6K protein important for translational initiation. The second is the Raf/ERK pathway targeting the L6K (MNK in mammals) protein that is also independently required for translational initiation. On their own, any one of these pathways can cause tumor growth, presumably due to independent downstream transcriptional events. But both pathways must act simultaneously in order to establish translational control of both Hifα (Sima), and PDHK. Interestingly, while the PI3K and ERK pathways acting together causes significant amounts of PDHK translation, the protein thus produced is inactive. In contrast, the PDHK translated in a Pvract background is enzymatically active and capable of inactivating PDH. Our data show that yet another parallel pathway initiated by Pvract that involves Src and JNK helps generate the active form of PDHK. Therefore all three downstream effectors of activated Pvr (Src/JNK, PI3K/S6K and ERK/Lk6, eIF4E) are essential in generating an active form of PDHK protein to down-regulate oxidative phosphorylation, while only the last two of these pathways are needed for LDH production and glycolysis. It is easy to visualize how, in the context of the triggering oncogene, the tumor caused could either be non-glycolytic, or be glycolytic but not lacking in oxidative phosphorylation (Pavlova and Thompson, 2016). In the system described in this paper, it is Inevitable that direct pyruvate to acetyl-CoA conversion within the mitochondrion, and therefore the TCA flux will be attenuated since PDH function is inhibited by PDHK in the tumor cells. However, we do not have direct evidence for or against any bypass mechanisms such as those using glutamine as the primary driver of anabolic processes being operational in the context of the Drosophila Pvract induced tumors as they are for many cancers. This issue requires further direct measurement of metabolic activity of the tumor tissue in the near future.
While this sequence of events can initiate a switch in the metabolic profile of the cell, an additional mechanism is required to sustain this transition over a long period of time. The central player in this sustenance is ROS. The level of these free-radical species rises as the mitochondrion becomes dysfunctional (Sun et al., 2009; Glushakova et al., 2011; Owusu-Ansah et al., 2008). Importantly, this excess ROS functions as a feedback signal that has at least two important consequences. First, ROS stabilizes Hif using the same mechanism that is used during hypoxia (Chandel et al., 2000; Fandrey et al., 2006), thus reinforcing the glycolytic pathways. The second is that ROS can activate the JNK pathway (Tobiume et al., 2001; Owusu-Ansah and Banerjee, 2009). Thus, after the initial reprogramming in metabolism, the transition is made stable over time, as the generated ROS reinforces the upstream members. All of the results shown here are consistent with this positive feedback model that enforces the Warburg effect and sustains it over time. For example, scavenging ROS blocks phosphorylation of components that are upstream of it (Figure 6i–j). Unlike Pvr, activation of PI3K and Raf together does not raise ROS even as it increases LDH (Figure 3q and Figure 6e); and activation of Ras, which will not lead to high ROS causes only very weak metabolic reprogramming compared with Pvract (Figure 1d–e). Thus, the positive feedback function of ROS is a critical step in tumors undergoing metabolic reprogramming or cell lines that are not necessarily under hypoxic conditions. Although tissue hypoxia does stabilize Hif (Wenger, 2002), this would be true of large non-vascularized solid tumors but not necessarily in circulating cells or in cancer cell lines. The mechanism detailed in Figure 7 is Hif dependent but hypoxia independent, a condition often observed in human cancers (Lee et al., 2008; Ivan et al., 2001; Zhong et al., 2000; Park et al., 2003).
Consistent with translational control, transcript levels of PDHK or Sima are not altered in Pvract cells, whereas the PDHK and Sima protein levels are very significantly up-regulated by Pvract through the translational module controlled by PI3K/ERK pathways. Unlike in several published mammalian studies (Kaplon et al., 2013; Kim et al., 2006), we did not find evidence for transcriptional control of PDHK by Hif. Analysis of our RNA-Seq data reveals that PDHK transcription levels remain unaltered in Pvract background (Figure 4—figure supplement 1). This was also confirmed by quantitative RT-PCR (Figure 5—figure supplement 1p), The reason for this discrepancy is unclear; perhaps Hif does control basal transcriptional levels of PDHK, but the oncogene induced up-regulation of activity results from a post-transcriptional control of PDHK activity as we observe here.
It is interesting that the activation of a single oncogene, the PDGF/VEGF Receptor (Pvr) induces multiple phenotypes associated with tumor formation, including overgrowth, cell shape change, local migration and importantly for this study, a likely shift in metabolism from oxidative phosphorylation to aerobic glycolysis. These tumors are not metastatic presumably because this requires complete loss of epithelial polarity (Pagliarini and Xu, 2003; Wu et al., 2010). Although only a single oncogene is activated, the observed Warburg effect is caused by the activation of several interconnected pathways that are precisely dissected in this genetically tractable model system. The distinct advantage of this analysis is that the tumor is generated in an otherwise wild-type background such that the pathways activated reflect primary drivers of the different aspects of the tumor and the analysis is not complicated by background mutations. In some cancer cell-lines, a Warburg effect is often entirely attributed to PI3K activation (DeBerardinis et al., 2008). This interpretation is complicated by the presence of background mutations that make cell-lines immortal, before they are transformed. For example, PI3K activated tumors are often seen only in backgrounds in which either Raf, ERK or Ras is activated (McCubrey et al., 2007; Steelman et al., 2008; Yuan and Cantley, 2008). With the advent of modern gene manipulation technologies, it is now possible to create in vivo models in mouse (Xue et al., 2014; Platt et al., 2014), but determining the epistatic relationships between all genetic components continues to be a challenge. Given the complete conservation of all the relevant components between Drosophila and mammals, it is reasonable to propose that a similar set of epistatic relationships to the one proposed here, will hold in mammalian cancers.
Materials and methods
Drosophila stocks
Request a detailed protocolThe following fly stocks were used: w1118, dpp-Gal4blk-1, UAS- dRas1V12(Rasact), UAS-wg, UAS-upd, UAS-CD8:mCherry, Ay-Gal4 UAS-CD2, Ay-Gal4 UAS-lacZ, MKRS hsFLP.86E, UAS-dRas1N17 (RasDN), UAS-S6kKQ (S6KDN), lk62, UAS-cRaf1gof, UAS-dp110CAAX(PI3Kact), UAS-PI3K92EA2860C (PI3KDN), UAS-InRA1325D (InRact), UAS-BskDN, UAS-hepact, UAS-simaRNAiHMS00832, UAS-Dsor1RNAiHMS00710, UAS-Dsor1RNAiHMS00145, UAS-Dsor1RNAiJF03100, UAS-rlRNAiHMS00173, UAS-PI3K92ERNAiJF02770, UAS-Akt1RNAiHMS00007, UAS-dTORRNAiHMS00504, UAS-dTORRNAiHMS01114, UAS-PDHKRNAiGL0009, UAS-Src42ARNAiHMS02755 (Bloomington Drosophila Stock Center, Bloomington, IN), UAS-Pvract (λ-Pvr) (N. Perrimon), UAS-yki (D. Pan), UAS-λEgfr (T. Schupbach), LDH-GFP (YD0852) (L. Cooley), UAS-simaRNAiKK106187(VDRC, Vienna, Austria), UAS-sima (P. Wappner), gstD-GFP (D. Bohmann)
Immunohistochemistry
Request a detailed protocolStandard protocols were used to fix and stain wing discs for immunohistochemistry. TO-PRO-3 or DAPI was used for a DNA counterstain (Invitrogen, Carlsbad, CA), and tissues were mounted in Vectashield (Vector Labs, Burlingame, CA). The following antibodies were used: anti-dpERK (1:100; Sigma-Aldrich, St. Louis, MO), anti-phospho Drosophila Akt (Ser505) (1:25; Cell Signaling, Danvers, MA), anti-Sima (1:100; generated by PRF&L, Canadensis, PA), anti-phospho PDH (S293) (1:100; Abcam, Cambridge, MA), anti-PDHK1 (1:100; Abcam), anti-phospho PDHK1 (Tyr243) (1:200; Cell Signaling), anti-phospho JNK (Thr183/Tyr185) (1:500; Cell Signaling), and anti-phospho Src (Tyr418) (1:200; Invitrogen). Single- plane fluorescence images were obtained using a Zeiss LSM 700 confocal microscope with Zen 2009 acquisition software. Images and average intensity of images were processed and measured using ImageJ. At least 20 discs were used for each genotype per experiment. Three technical replications were done for each experiment.
Flip-out clones
Request a detailed protocolThe Ay-Gal4 system (Ito et al., 1997), combined with a heat shock-driven FLP recombinase, was used to generate clones in which oncogenes and/or RNAi and other transgenes were expressed. Expressing cells were marked by including UAS-driven transgenes for rat CD2 or nuclear β- Galactosidase. A 30–45 min heat shock (37°C) was applied to larvae grown for approximately three days AEL (25°C), and larvae were dissected after approximately 48 hr of subsequent growth at 25°C.
RNA-seq library construction and analysis method
Request a detailed protocolTotal RNA was isolated using PureLink RNA Mini Kit (Life Technologies, Carlsbad, CA) according to manufacturer’s protocol. Total RNA fraction was processed using Illumina’s ‘‘TruSeq RNA Sample Preparation v2 Protocol’’ (Illumina, San Diego, CA). The resulting purified cDNA library was sequenced on the Illumina Hiseq 2000 by following manufacturer’s protocols. 50 bp single-end RNA-seq reads were obtained, and sequence files were generated in FASTQ format. The quality score of RNA-seq reads was obtained by using the FastQC. Reads were then aligned to the Drosophila melanogaster Reference Sequences UCSC dm6 from Illumina iGenome files using TopHat v2.0.10 (Kim et al., 2013).Transcript assembly and estimation of their abundances were calculated with Cufflinks 2.1.1 (Trapnell et al., 2012) by using the Drosophila melanogaster Reference annotation dataset UCSC dm6 from Illumina iGenome files (https://support.illumina.com/sequencing/sequencing_software/igenome.html). Differential expression for genes across the different conditions was calculated with Cuffdiff 2.1.1 (Trapnell et al., 2012). Heat maps showing gene expression levels (in FPKM, fragments per kilobase of transcript per million mapped fragments) through the different samples were drawn with package heatmap.2 in R studio for a subset of selected genes. Data deposited in ArrayExpress: E-MTAB-3808.
Quantitative real-time PCR analysis
Request a detailed protocolTotal RNA was extracted from approximately forty 3rd instar larval wing discs using PureLink RNA mini kit (Ambion, Waltham, MA). The SuperScript III First-Stand synthesis SuperMix kit (Invitrogen) was used for first-stand cDNA synthesis. Relative quantitative PCR was performed by comparative CT method using Power SYBR Green PCR master mix kit (Applied Biosystems, Waltham, MA) and a StepOne Real-Time PCR detection thermal cycler (Applied Biosystems). The levels of RpL10 were used to normalize total cDNA input.
Wing disc volume measurements and analysis
Request a detailed protocolTo synchronize larvae, eggs were collected on grape juice plates, and only larvae hatched within a three-hour period were used. After allowing newly hatched larvae to grow for 96 hr at 29°C, wing discs were dissected, fixed, washed, and stained with TO-PRO-3. Discs were then mounted in a drop of Vectashield and slowly moved to edge of drop (in increasingly less mounting medium) until they were stuck in position to the glass slide. Small, square coverslips were placed on either side of drop, and a larger, rectangular coverslip was placed spanning the smaller ones. All slides were fixed with nail polish. This mounting creates a gap (of coverslip thickness) between the top coverslip and slide, preventing the coverslip from pressing and deforming wing discs. When imaging, z-stacks were obtained with a distance between slices of 14 μm, and the entire disc was covered. To measure volumes, plugin 'A 3D editing' was used (ImageJ). Briefly, each disc was manually outlined in each z-section (using the channel for mCherry), and the plugin then calculated total volume. Brightness and contrast were enhanced identically for each sample to aid in outlining. At least 10 discs were used for each genotype per experiment.
ROS assay
Request a detailed protocolFor ROS detection in wing discs, after incubation with DHE (Invitrogen) in RT, discs were rinsed twice in Schneiders medium, fixed for 5 mins in 4% Formaldehyde, and rinsed once with 1XPBS before confocal imaging.
References
-
Stimulation of reactive oxygen species generation by disease-causing mutations of lipoamide dehydrogenaseHuman Molecular Genetics 20:2984–2995.https://doi.org/10.1093/hmg/ddr202
-
Regulation of the Drosophila bHLH-PAS protein Sima by hypoxia: functional evidence for homology with mammalian HIF-1 alphaBiochemical and Biophysical Research Communications 249:811–816.https://doi.org/10.1006/bbrc.1998.9234
-
The impact of O2 availability on human cancerNature Reviews Cancer 8:967–975.https://doi.org/10.1038/nrc2540
-
Evidence for existence of tissue-specific regulation of the mammalian pyruvate dehydrogenase complexBiochemical Journal 329 (Pt 1):191–196.https://doi.org/10.1042/bj3290191
-
Targeted gene expression as a means of altering cell fates and generating dominant phenotypesDevelopment 118:401–415.
-
Mitochondrial c-Jun N-terminal kinase (JNK) signaling initiates physiological changes resulting in amplification of reactive oxygen species generationJournal of Biological Chemistry 286:16052–16062.https://doi.org/10.1074/jbc.M111.223602
-
Reactive oxygen species generated at mitochondrial complex III stabilize hypoxia-inducible factor-1alpha during hypoxia: a mechanism of O2 sensingJournal of Biological Chemistry 275:25130–25138.https://doi.org/10.1074/jbc.M001914200
-
Oncogenic alterations of metabolismTrends in Biochemical Sciences 24:68–72.https://doi.org/10.1016/S0968-0004(98)01344-9
-
Free radicals in the physiological control of cell functionPhysiological Reviews 82:47–95.https://doi.org/10.1152/physrev.00018.2001
-
Akt stimulates aerobic glycolysis in cancer cellsCancer Research 64:3892–3899.https://doi.org/10.1158/0008-5472.CAN-03-2904
-
Regulating cellular oxygen sensing by hydroxylationCardiovascular Research 71:642–651.https://doi.org/10.1016/j.cardiores.2006.05.005
-
SnapShot: cancer metabolism pathwaysCell Metabolism 17:466–e2.https://doi.org/10.1016/j.cmet.2013.02.016
-
Insulin-like growth factor 1 induces hypoxia-inducible factor 1-mediated vascular endothelial growth factor expression, which is dependent on MAP kinase and phosphatidylinositol 3-kinase signaling in colon cancer cellsJournal of Biological Chemistry 277:38205–38211.https://doi.org/10.1074/jbc.M203781200
-
Metabolic targets for cancer therapyNature Reviews Drug Discovery 12:829–846.https://doi.org/10.1038/nrd4145
-
Increased superoxide accumulation in pyruvate dehydrogenase complex deficient fibroblastsMolecular Genetics and Metabolism 104:255–260.https://doi.org/10.1016/j.ymgme.2011.07.023
-
Regulation of the activity of the pyruvate dehydrogenase complexAdvances in Enzyme Regulation 42:249–259.https://doi.org/10.1016/S0065-2571(01)00061-9
-
Upstream and downstream of mTORGenes & Development 18:1926–1945.https://doi.org/10.1101/gad.1212704
-
The Drosophila mushroom body is a quadruple structure of clonal units each of which contains a virtually identical set of neurones and glial cellsDevelopment 124:761–771.
-
Tumor suppressors and cell metabolism: a recipe for cancer growthGenes & Development 23:537–548.https://doi.org/10.1101/gad.1756509
-
Multifaceted roles of glycolytic enzymesTrends in Biochemical Sciences 30:142–150.https://doi.org/10.1016/j.tibs.2005.01.005
-
Glucose utilization is essential for hypoxia-inducible factor 1 alpha-dependent phosphorylation of c-JunMolecular and Cellular Biology 24:4128–4137.https://doi.org/10.1128/MCB.24.10.4128-4137.2004
-
Two distinct roles for Ras in a developmentally regulated cell migrationDevelopment 122:409–418.
-
The Drosophila phosphoinositide 3-kinase Dp110 promotes cell growthThe EMBO Journal 15:6584–6594.
-
Relationshiop between phosphorylation and activity of pyruvate dehydrogenase in rat liver mitochondria and the absence of such a relationship for pyruvate carboxylaseJournal of Biological Chemistry 253:2716–2723.
-
Reactive oxygen species mediate cytokine activation of c-Jun NH2-terminal kinasesThe Journal of Biological Chemistry 271:15703–15707.https://doi.org/10.1074/jbc.271.26.15703
-
Aerobic glycolysis: meeting the metabolic requirements of cell proliferationAnnual Review of Cell and Developmental Biology 27:441–464.https://doi.org/10.1146/annurev-cellbio-092910-154237
-
Molecular mechanisms of mTOR-mediated translational controlNature Reviews Molecular Cell Biology 10:307–318.https://doi.org/10.1038/nrm2672
-
Targeting JNK for therapeutic benefit: from junk to gold?Nature Reviews Drug Discovery 2:554–565.https://doi.org/10.1038/nrd1132
-
The hunting of the SrcNature Reviews Molecular Cell Biology 2:467–475.https://doi.org/10.1038/35073094
-
Roles of the Raf/MEK/ERK pathway in cell growth, malignant transformation and drug resistanceBiochimica Et Biophysica Acta 1773:1263–1284.https://doi.org/10.1016/j.bbamcr.2006.10.001
-
A hierarchy of cross-regulation involving Notch, wingless, vestigial and cut organizes the dorsal/ventral axis of the Drosophila wingDevelopment 122:3477–3485.
-
Gastric epithelial reactive oxygen species prevent normoxic degradation of hypoxia-inducible factor-1alpha in gastric cancer cellsClinical Cancer Research 9:433–440.
-
The emerging hallmarks of cancer metabolismCell Metabolism 23:27–47.https://doi.org/10.1016/j.cmet.2015.12.006
-
The phosphatidylinositol 3-Kinase AKT pathway in human cancerNature Reviews Cancer 2:489–501.https://doi.org/10.1038/nrc839
-
Signal integration by JNK and p38 MAPK pathways in cancer developmentNature Reviews. Cancer 9:537–549.https://doi.org/10.1038/nrc2694
-
Targeting mitochondria metabolism for cancer therapyNature Chemical Biology 11:9–15.https://doi.org/10.1038/nchembio.1712
-
ERK1/2-dependent phosphorylation and nuclear translocation of PKM2 promotes the Warburg effectNature Cell Biology 14:1295–1304.https://doi.org/10.1038/ncb2629
-
Tumour-associated mutant p53 drives the Warburg effectNature Communications 4:2935.https://doi.org/10.1038/ncomms3935
-
Modulation of hypoxia-inducible factor 1alpha expression by the epidermal growth factor/phosphatidylinositol 3-kinase/PTEN/AKT/FRAP pathway in human prostate cancer cells: implications for tumor angiogenesis and therapeuticsCancer Research 60:1541–1545.
Article and author information
Author details
Funding
American Cancer Society (Postdoctoral fellowship (#PF-10-130-01-DDC))
- Kevin T Jones
National Institutes of Health (RO1-EY008152)
- Utpal Banerjee
The funders had no role in study design, data collection and interpretation, or the decision to submit the work for publication.
Acknowledgements
We would like to thank Wei Liao for his help with bioinformatic analysis of RNA expression data. We thank R Nagaraj for helpful comments and discussions, and the members of the Banerjee lab for support. We thank N Perrimon, D Pan, T Schupbach, L Cooley, P Wappner, D Bohmann, and the stock centers of Bloomington, the National Institute of Genetics (Tokyo, Japan), and the Vienna Drosophila RNAi Center (Vienna, Austria) for providing Drosophila stocks and reagents. KTJ was supported by a postdoctoral fellowship (#PF-10-130-01-DDC) from the American Cancer Society. This work is supported by National Institutes of Health (NIH) grant RO1-EY008152 to UB.
Version history
- Received: May 25, 2016
- Accepted: August 31, 2016
- Accepted Manuscript published: September 1, 2016 (version 1)
- Version of Record published: September 20, 2016 (version 2)
Copyright
© 2016, Wang et al.
This article is distributed under the terms of the Creative Commons Attribution License, which permits unrestricted use and redistribution provided that the original author and source are credited.
Metrics
-
- 5,366
- views
-
- 1,391
- downloads
-
- 66
- citations
Views, downloads and citations are aggregated across all versions of this paper published by eLife.
Download links
A two-part list of links to download the article, or parts of the article, in various formats.
Downloads (link to download the article as PDF)
Open citations (links to open the citations from this article in various online reference manager services)
Cite this article (links to download the citations from this article in formats compatible with various reference manager tools)
In vivo genetic dissection of tumor growth and the Warburg effect
eLife 5:e18126.
https://doi.org/10.7554/eLife.18126
Further reading
-
- Cell Biology
- Chromosomes and Gene Expression
Heat stress is a major threat to global crop production, and understanding its impact on plant fertility is crucial for developing climate-resilient crops. Despite the known negative effects of heat stress on plant reproduction, the underlying molecular mechanisms remain poorly understood. Here, we investigated the impact of elevated temperature on centromere structure and chromosome segregation during meiosis in Arabidopsis thaliana. Consistent with previous studies, heat stress leads to a decline in fertility and micronuclei formation in pollen mother cells. Our results reveal that elevated temperature causes a decrease in the amount of centromeric histone and the kinetochore protein BMF1 at meiotic centromeres with increasing temperature. Furthermore, we show that heat stress increases the duration of meiotic divisions and prolongs the activity of the spindle assembly checkpoint during meiosis I, indicating an impaired efficiency of the kinetochore attachments to spindle microtubules. Our analysis of mutants with reduced levels of centromeric histone suggests that weakened centromeres sensitize plants to elevated temperature, resulting in meiotic defects and reduced fertility even at moderate temperatures. These results indicate that the structure and functionality of meiotic centromeres in Arabidopsis are highly sensitive to heat stress, and suggest that centromeres and kinetochores may represent a critical bottleneck in plant adaptation to increasing temperatures.
-
- Cell Biology
High-altitude polycythemia (HAPC) affects individuals living at high altitudes, characterized by increased red blood cells (RBCs) production in response to hypoxic conditions. The exact mechanisms behind HAPC are not fully understood. We utilized a mouse model exposed to hypobaric hypoxia (HH), replicating the environmental conditions experienced at 6000 m above sea level, coupled with in vitro analysis of primary splenic macrophages under 1% O2 to investigate these mechanisms. Our findings indicate that HH significantly boosts erythropoiesis, leading to erythrocytosis and splenic changes, including initial contraction to splenomegaly over 14 days. A notable decrease in red pulp macrophages (RPMs) in the spleen, essential for RBCs processing, was observed, correlating with increased iron release and signs of ferroptosis. Prolonged exposure to hypoxia further exacerbated these effects, mirrored in human peripheral blood mononuclear cells. Single-cell sequencing showed a marked reduction in macrophage populations, affecting the spleen’s ability to clear RBCs and contributing to splenomegaly. Our findings suggest splenic ferroptosis contributes to decreased RPMs, affecting erythrophagocytosis and potentially fostering continuous RBCs production in HAPC. These insights could guide the development of targeted therapies for HAPC, emphasizing the importance of splenic macrophages in disease pathology.


