Abstract
Aims: To validate a new two dimensional (2-D) bifurcation quantitative coronary angiography (QCA) software.
Methods and results: In the latest edition of the Cardiovascular Angiography Analysis System (CAAS 5.9; Pie Medical Imaging, Maastricht, The Netherlands) video-densitometric information is dynamically integrated into the edge-detection algorithm of 11- and 6-segment models to reduce overestimation of small diameters. Furthermore, automatic reference obstruction analysis was optimised. Values of the minimal lumen diameter (MLD), reference vessel diameter (RVD), percent diameter stenosis (DS) and bifurcation angle (BA) for the different bifurcation segment models were validated against precision manufactured plexiglass phantoms. In anteroposterior views, accuracy and precision (mean difference±SD) of 11- and 6-segment models for MLD were 0.013±0.082 mm vs. 0.003±0.100 mm, for RVD –0.030±0.047 mm vs. –0.029±0.045 mm and for DS –0.48±3.66% vs. –0.11±3.97%. In smaller vessel segments (true MLD <0.7 mm), MLD overestimation was reduced. Inter-observer variability for MLD, RVD and DS for either model was ≤0.052 mm, ≤0.043 mm and ≤2.24%, respectively. Agreement between models for MLD, RVD and DS was ±0.076 mm, ±0.021 mm and ±2.53%, respectively. Accuracy and precision for BA were –2.6±3.5°, and variability was ≤1.2°. Accuracy and precision for diameter-derived parameters were slightly decreased in projections with 30° rotation; BA precision dropped to 6.2°.
Conclusions: MLD quantification is improved for true MLD <0.7 mm, resulting in highly accurate and precise diameter measurements over the entire range of phantom diameters. Automatic reference obstruction analysis provides highly accurate, precise and reproducible RVD and DS measurements.
Introduction
The fundamental issue in the quantitative coronary angiography (QCA) analysis of bifurcation lesions is the calculation of the reference vessel diameter (RVD)1,2. It has been convincingly demonstrated that due to the step-down phenomenon, this should be calculated separately for the proximal main vessel (PMV), the distal main vessel (DMV) and the side branch (SB)3-5. Even so, there are two possible approaches to define the RVD values, either based on a user-defined reference position located outside the obstruction or by using an automatic regression function. The validity of the former approach for 2-D bifurcation QCA has been tested and verified during the validation process for the Cardiovascular Angiography Analysis System (CAAS; Pie Medical Imaging, Maastricht, The Netherlands)6. However, in true coronary cases interpolation via an automatic regression function can be of value in excessively long and/or tapered vessels2.
Angiographic imaging of small objects is historically known to be affected by blurring due to the limitations of the X-ray systems and noise7-11. Notwithstanding the introduction of flat panel detectors and increased software sophistication, these phenomena are still present, as evidenced by the overestimation of lumen diameters <0.70 mm in the validation of CAAS 5.86 and other similar reports12,13.
CAAS 5.9 2-D bifurcation QCA software implements both an optimised automatic reference analysis and a new small lumen detection algorithm; thus it would be expected to offer increased accuracy and precision over the entire range of lumen diameters anticipated in clinical practice. In this report we present the results of the in vitro validation of this software package based on a series of precision manufactured bifurcation phantoms.
Materials and methods
Phantoms
Six plexiglass phantoms, each of them mimicking a vessel with three successive bifurcations, were designed in 3-D and manufactured with a tolerance <10 μm14 (Figure 1). Every individual bifurcation had a lesion, wherein at least one vessel segment had a percent diameter stenosis (DS) of ≥60%, the minimum lumen diameter (MLD) being located within 3-6 mm from the point of bifurcation; the range of diameters (0.53-4.00 mm), lesion length, bifurcation angles and Medina class15 used in the design of these 18 bifurcations reflected the anatomic variation and the fractal nature of bifurcations3-5 in the human coronary tree.
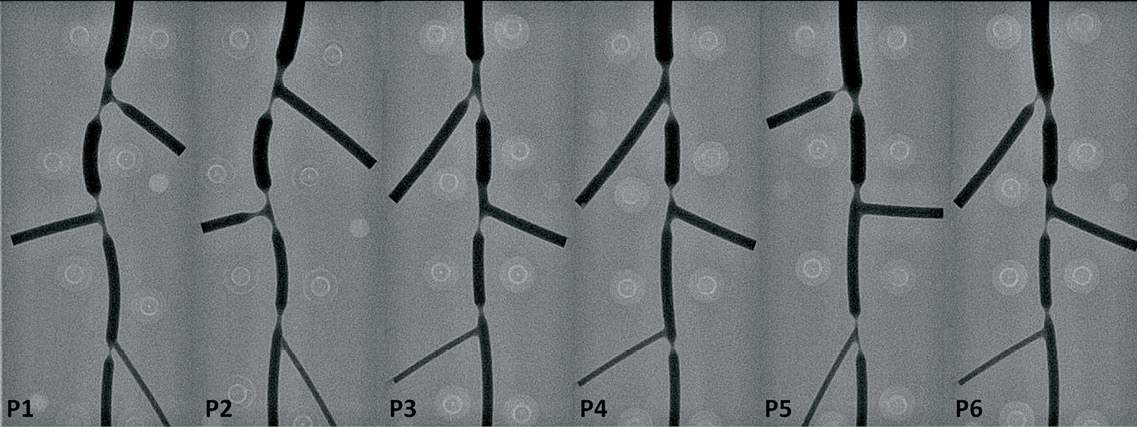
Figure 1. Precision manufactured bifurcation phantoms. Angiographic images were acquired after filling the phantoms with contrast and were then used in the software validation; P1: phantom 1
Acquisition and calibration
The digital angiograms were acquired on a biplane angiographic system (Axiom Artis™; Siemens, Forchheim, Germany). All phantoms were filled with 100% Iodixanol 320 (Visipaque™; GE Healthcare, Cork, Ireland) and imaged at 30 frames per second, in a 20 cm field of view, with the centre of the phantom placed precisely at the isocentre. For validation purposes, images acquired in anteroposterior (AP) direction by either C-arm were analysed. Images acquired at 30° rotation, once in right and once in left anterior oblique (RAO-LAO) projection, were also analysed, in order to investigate the impact of gantry angulation on the accuracy and precision of the measurements.
Calibration was performed on a 10 mm grid board and the recording geometry of the x-ray system obtained from the Digital Imaging and Communications in Medicine (DICOM) (National Electrical Manufacturers’ Association, DICOM, Rosslyn, VA, USA) header and the phantom thickness were taken into account to determine the true pixel size in the phantom plane, separately for each C-arm.
Radiographic system settings, phantom position, table height and source to image intensifier distance were kept constant throughout each phantom and centimetre grid acquisition and were identical for all phantoms.
Quantitative angiographic analysis
Standard operator procedure for angiographic analysis consisted of the following steps:
1) The middle frame out of the total frame count of a given acquisition was consistently analysed to avoid frame selection bias; 2) The pixel size was manually entered; 3) The bifurcation segmentation was initialised by placing one proximal and two distal delimiter points at the largest possible distance from the bifurcation to be analysed, however not touching the adjacent bifurcation lesions or the phantom borders; 4) Contours were detected using the new lumen detection algorithm and MLD was determined with an already described methodology16; 5) On the same contours, both single point bifurcation local reference obstruction (BLRO) analysis6 and automatic reference obstruction (BARO) analysis were applied for the RVD calculation (Figure 2); 6) Given the values of MLD and RVD, the DS was automatically calculated; 7) Proximal and distal bifurcation angles were calculated according to the described methodology16; angle calculations are independent of the bifurcation segment model used.
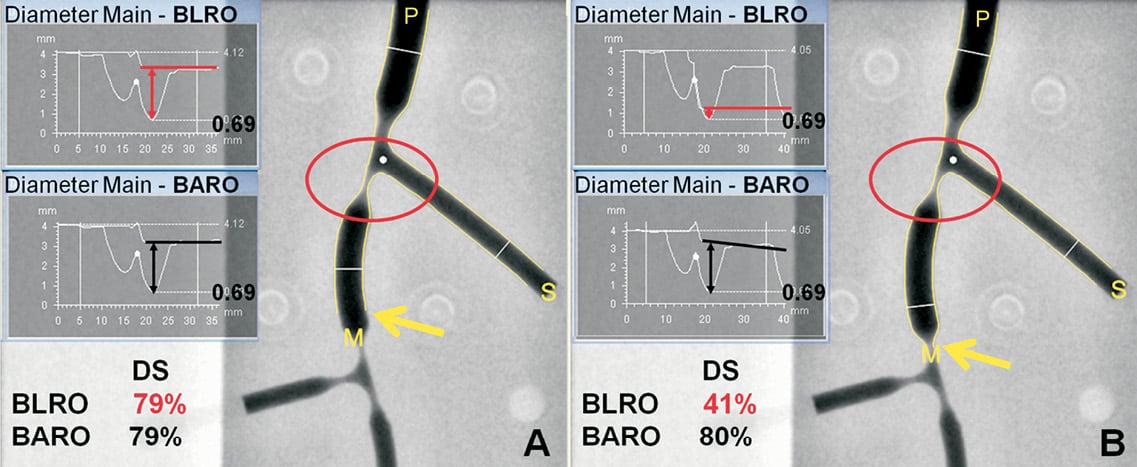
Figure 2. Differences between automatic (BARO) and local reference obstruction (BLRO) analysis of bifurcation lesions. The first bifurcation of the second phantom was analysed twice with each method focusing on the DMV lesion (MLD=0.69 mm); the position of the distal delimiter point (indicated by the yellow arrow) shifted between analyses. A. Delimiter point is placed within the DMV. RVD is apparently equal between methods, resulting in identical DS measurements. B. Delimiter point is placed distal to the DMV, within the adjacent bifurcation lesion. Taking a severely stenosed lumen as reference for the preceding DMV segment, BLRO results in the recalibration of the reference curve (horizontal red line) and therefore in gross DS underestimation. On the contrary, in BARO, the reference curve (black line) is based on the healthy diameter values within DMV; thereby DS is almost identical to the previous analysis. DMV: distal main vessel; DS: percent diameter stenosis; MLD: minimal lumen diameter; RVD: reference vessel diameter: P: proximal main vessel; M: DMV; S: side branch
The new lumen detection algorithm is based on the method described by Ramcharitar16. In addition to that, it dynamically integrates video-densitometric information from the image into the segmentation algorithms thereby reducing the overestimation of the small diameters. The BARO algorithm has originally been described by Ramcharitar et al16. In order to improve the stability of the RVD function, this algorithm was slightly modified in the new version. In the original BARO algorithm16, RVD outside the bifurcation region was only based on the obstruction-free parts of PMV, DMV or SB, respectively; in the CAAS 5.9, the automatic RVD function also takes into account characteristics of the bifurcation region itself. However, the BLRO algorithm was left unchanged as described in the validation paper for CAAS 5.8. Briefly, reference positions were automatically placed at a distance 5% of the vessel segment length inside the delimiter points; diameters within 1.5 mm proximal and distal of each reference position were averaged to derive the corresponding RVD. It follows, that, as illustrated in Figure 2, the validity of the RVD/DS measurements derived in BLRO is dependent on the definition of the reference points. On the contrary, BARO is not affected from variable positioning of the delimiter points, by fitting a reference diameter curve based on the “healthy” diameters within a given bifurcation branch.
Validation methodology
QCA was performed off-line by two experienced analysts (CG, YO), independent from each other. During the study, manual contour correction was not allowed. However, in a few cases the contour detection was adjusted by using the restriction option, therein excluding gross image artefacts without manually redefining the detected contours17.
MLD, RVD and DS were reported for segments 2, 3 and 5 of either the 11- or 6-segment model (Figure 3), reflecting the vessel segments, where in clinical practice the stent would be placed in the PMV, DMV and SB, respectively. Segment values were pooled together and analysed. The proximal and distal BA values were also pooled together and compared to the phantom BA values.
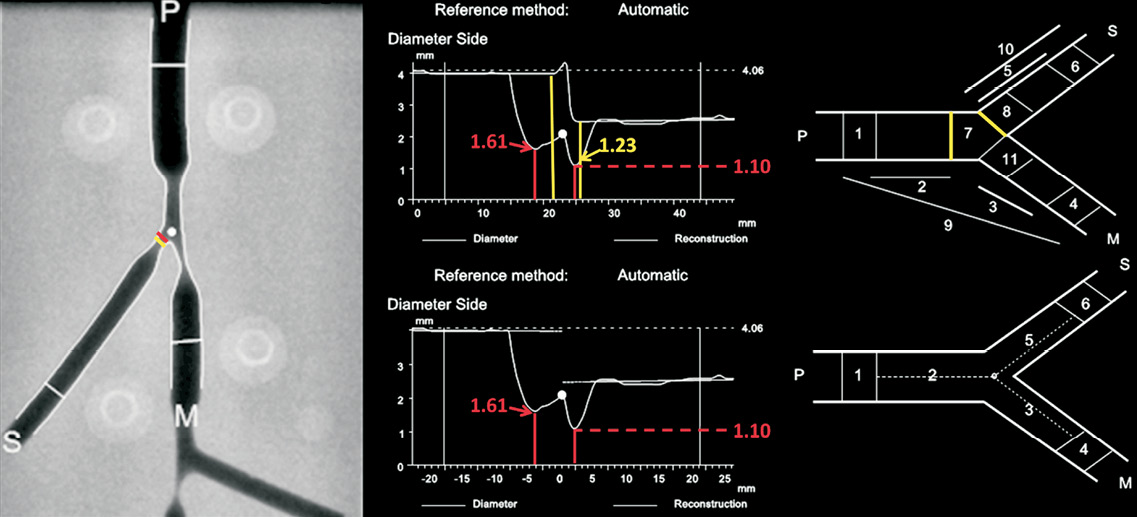
Figure 3. Bifurcation segment models; difference in minimal lumen diameter (MLD) traced in the side branch (SB). Left: Analysed frame of a phantom bifurcation; MLD position in the 11-segment model is highlighted in yellow; in red for the 6-segment model. Right: diameter graphs and model schematics for the 11-segment (upper panel) and 6-segment models (lower panel). In the former, segments 2 (PMV) and 5 (SB) are separated by segment 7 corresponding to the polygon of confluence; proximal and distal borders thereof are highlighted in yellow on both graph and schematic. Whereas MLD value is common between models for the PMV, difference in bifurcation model definitions results in different MLD values for segment 5. PMV: proximal main vessel
Separate analysis of MLD, RVD and DS was performed for phantom vessel segments with relatively larger (>0.70 mm) true MLD values. Moreover, results were separately analysed for BARO and BLRO algorithms and compared.
Statistics
Statistical analysis was performed using SPSS 16.0 for Windows (SPSS Inc, Chicago, IL, USA). Continuous variables are presented as mean ±1 standard deviation and compared with the independent or paired samples t-test, as appropriate. Categorical variables are presented as counts and/or percentages. Measurements for any parameter or model derived from the two sets of images acquired in AP view were expected to be correlated (measurements of the same quantity). They were indeed pre-emptively checked for correlation using the Pearson coefficient, compared with a paired t-test and then averaged, being henceforth treated as single values. The same procedure was followed for the two sets of images acquired in rotated projections.
The first analyst carried out two full rounds of measurements, with a time interval of two weeks, in order to determine intra-observer variability. The first round of measurements was compared both with the measurements of the second analyst to determine inter-observer variability and with the corresponding phantom values for the purpose of validating the software against the ground truth; Bland-Altman analysis was performed for all comparisons18. Regarding intra- and inter-observer comparisons, the mean difference (bias) and its standard deviation were calculated; the repeatability coefficient (equal to 1.96 * standard deviation of the bias) was determined as the measure of variability. Assessment of agreement between the two bifurcation models was also performed using the Bland-Altman analysis.
A paired t-test was used to compare the QCA measurements by either model with the corresponding phantom values. The individual signed differences were averaged; the mean of these signed differences is a measure of accuracy; the standard deviation is a measure of precision. Measures of accuracy were compared between models and/or methods of obstruction analysis with the paired t-test; measures of precision/variability were compared with the F-test12. As the true values were known, we chose to plot these instead of the average values on the X-axis of the Bland-Altman plot against the signed differences and computed the corresponding 95% limits of agreement18. When appropriate, signed differences were plotted on the Y-axis of the plots as the percentage of the corresponding true values19.
All statistical tests were two-sided and a p-value <0.05 was considered statistically significant.
Results
Analysis (validation) in AP views
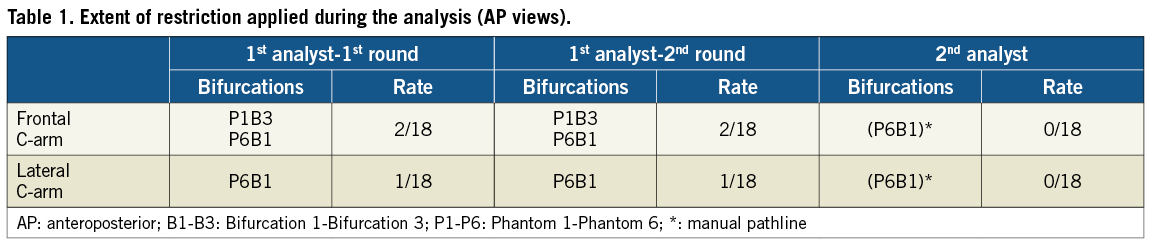
The extent to which the restriction option was applied during the contour detection is reported in Table 1. The first analyst was consistent in his choice between the two rounds of measurements; the second analyst did in fact not apply the restriction mode but rather indicated the pathlines from the PMV into the DMV and SB, respectively by successive left mouse clicks.
Accuracy and precision for MLD, RVD and DS values are presented in Table 2 and Table 3. MLD values for all 54 phantom vessel segments evaluated had an accuracy and precision of 0.013±0.082 mm and 0.003±0.100 mm for the 11- and 6-segment model respectively, this not being significantly different from phantom values (p-value 0.23 and 0.81). MLD was still overestimated in vessel segments with smaller true MLD (<0.7 mm), however to a modest degree (Figure 4). Because of the difference in calibre between the smaller and larger vessel segments, accuracy and precision were also expressed in percentage values in order to facilitate a comparison of respective indices. Thus, percentage accuracy and precision for the 11- and 6-segment models was 10.8±4.2% and 10.6±4.2% in smaller segments and 1.1±5.5% and 0.5±5.6% in larger segments, respectively (compare graphs in Figure 4).
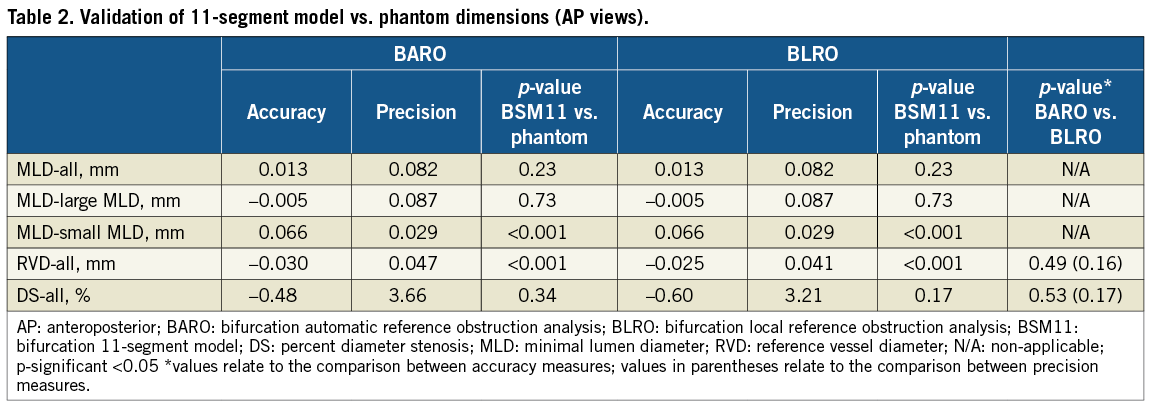
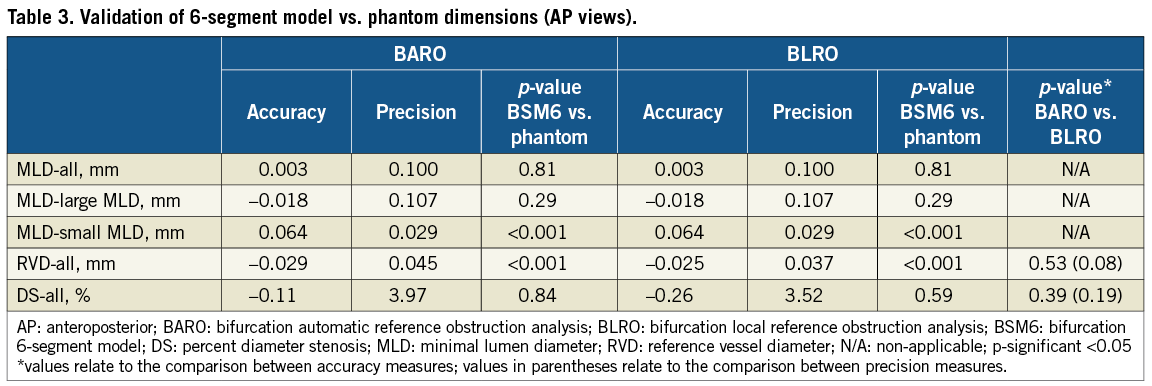
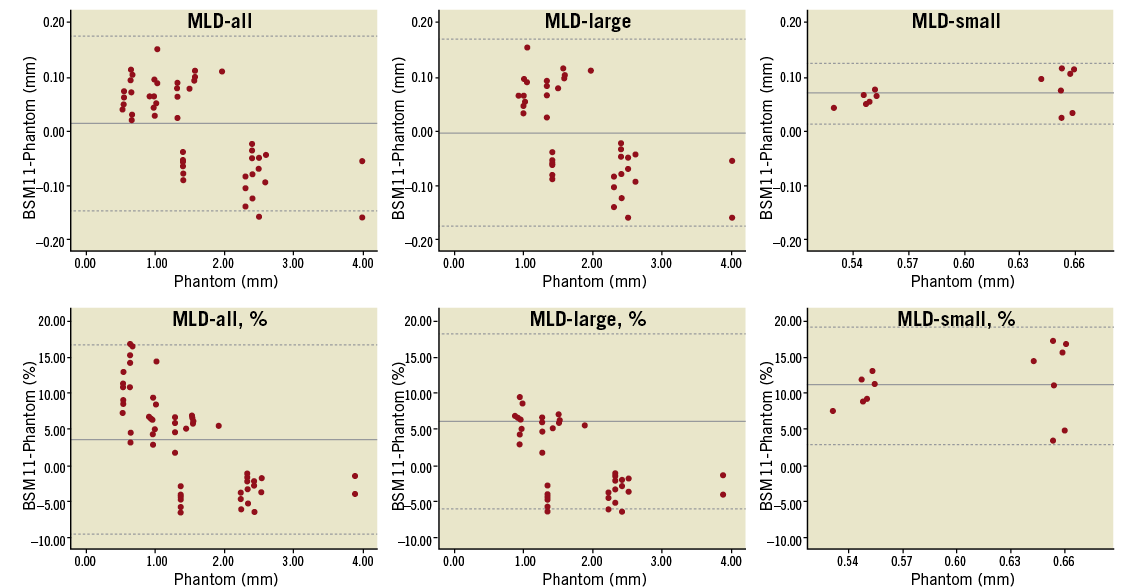
Figure 4. Bland-Altman plots comparing the 11-segment model results to the phantom values for minimal lumen diameter (MLD); analysis in anteroposterior views. Absolute (upper panel) and relative (lower panel) differences are plotted on the Y-axis for the entire dataset (left column), for true MLD values >0.7 mm (middle column) and for true MLD values <0.7 mm (right column). Solid lines represent the mean difference; dotted lines represent the 95% limits of agreement (mean difference ±1.96 SD)
Values for RVD and DS did not significantly differ between BARO and BLRO analysis, the latter being slightly but not significantly more precise compared to BARO (Table 2 and Table 3). Finally, DS values did not differ significantly compared to phantom values either for the 11-segment (-0.48±3.66%, p=0.34 for BARO and –0.60±3.21%, p=0.17 for BLRO) or for the 6-segment model (–0.11±3.97%, p=0.84 for BARO and –0.26±3.52%, p=0.59 for BLRO).
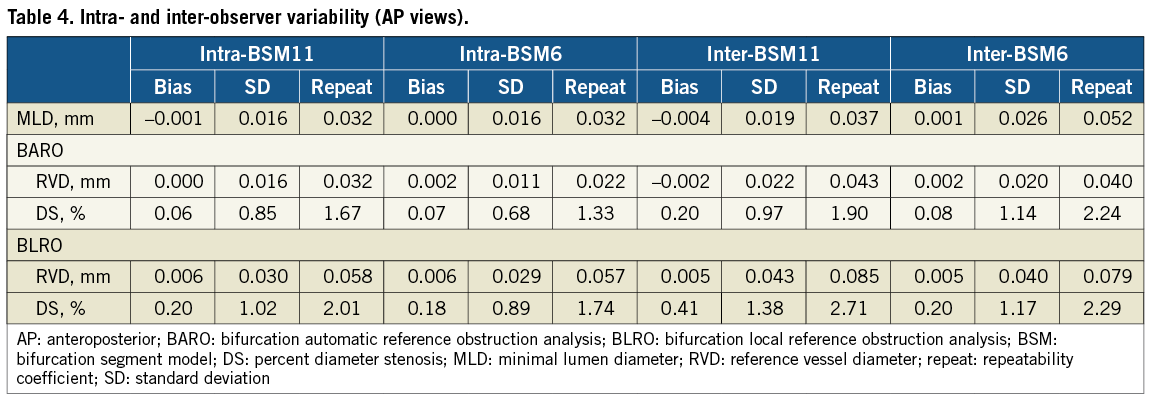
INTRA- AND INTER-OBSERVER VARIABILITY Bias, standard deviation and repeatability coefficient for either model are reported in Table 4. Values for RVD derived with BARO were consistently more reproducible compared to BLRO (p<0.001 for all comparisons). DS values were also more reproducible with BARO compared to BLRO; p-value for comparisons in intra-observer analysis was 0.09 and 0.03 for the 11- and 6-segment models, respectively, whereas in inter-observer analysis it was 0.01 and 0.43, respectively.
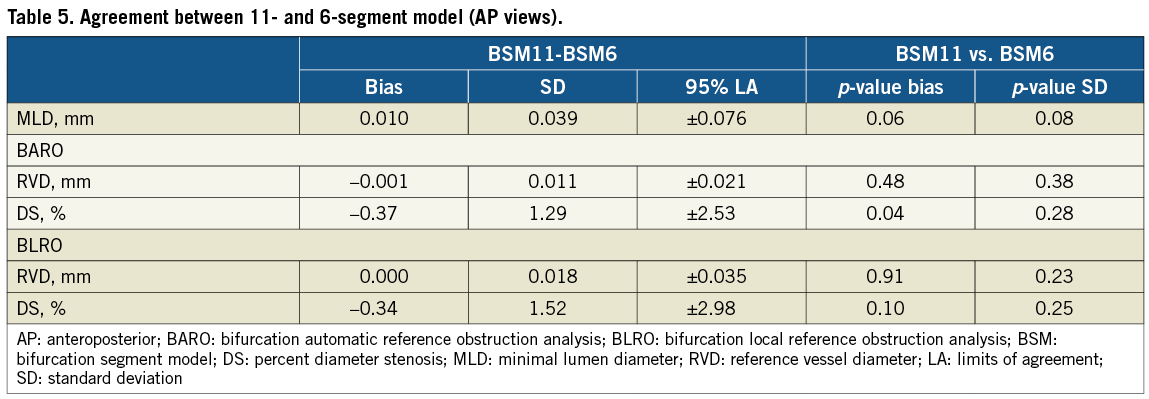
INTER-MODEL AGREEMENT Direct assessment of agreement between the two models is presented in Table 5. Limits of agreement for MLD were ±0.076 mm, whereas for RVD and DS they were ±0.021 mm and ±2.53% in BARO, and ±0.035 mm and ±2.98% in BLRO analysis, respectively. Accuracy and precision measures did not differ significantly between models except for BARO derived DS values, where bias differed by 0.37% (p=0.04).
Analysis in rotated views
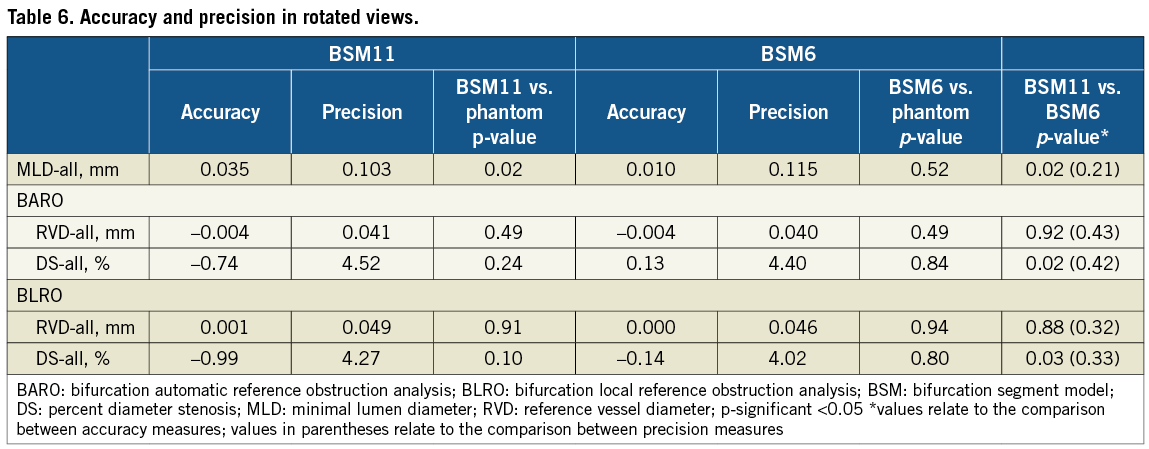
Accuracy and precision of measurements in rotated views are reported in Table 6. Only MLD values differed significantly from the phantom values (p=0.02). Accuracy was increased for MLD and DS measurements with the 6-segment model, however precision was comparable between models. Inter-observer variability for MLD was ≤0.088 mm, for RVD was ≤0.043 mm (BARO) and ≤0.088 mm (BLRO), and for DS was ≤3.39% (BARO) and ≤4.22% (BLRO) for either model (not shown). Restriction was applied by the first analyst once (1/18) per rotated projection; for the same bifurcations pathlines were manually drawn by the second observer.
Bifurcation angle
In AP views, BA was significantly underestimated, with an accuracy and precision of –2.6±3.5°, (p<0.001). Intra- and inter-observer bias was zero, whereas variability was 1.0° and 1.2°, respectively. In rotated views, accuracy and precision became –3.1±6.2°, whereas inter-observer variability was 1.9°; precision and reproducibility were significantly decreased compared to the AP measurements (p<0.001 for both).
Discussion
The main findings of this study are: 1) The new lumen detection algorithm has improved the quantification of the MLD measurements resulting in a highly accurate and precise performance across the entire range of diameter values anticipated in clinical practice; 2) The new bifurcation automatic reference obstruction analysis algorithm has comparable accuracy and precision with local reference obstruction analysis, however is more reproducible for RVD and DS measurements; 3) There is high agreement between the bifurcation segment models for all parameters, the 11-segment model being slightly less accurate but more precise compared to the 6-segment model regarding MLD values.
Small MLD values
One can question whether analysis of diameters in the range 0.5-0.7 mm is clinically meaningful, since these are prone to induce ischaemic changes and intra-luminal thrombosis20. However, the accuracy and precision of the measurements impact on the calculation of the post-procedure diameter gain and the late lumen loss, still seen as surrogate angiographic markers for the evaluation of intracoronary devices21. Several approaches have been reported to improve the accuracy of small diameters for single vessel analysis. Generally, these approaches can be divided into two categories: either correcting the system’s point spread function10,11, or incorporating an adaptive correction function for the weighting of the first and second derivatives of the brightness profile9,22.
In this report we presented the results of the in vitro validation of a new algorithm, wherein video-densitometric information is dynamically integrated in the lumen detection in order to reduce the overestimation of small diameters resulting from stand-alone edge detection. Thereby, this new approach benefits from the relative strengths of either technique (video-densitometry is better for small lumens whereas edge detection is better for larger lumens), by dynamically combining them as earlier suggested by Haase et al8. The algorithm takes into account that the image data produced by the angiographic system may influence the transfer function of the imaging chain while they are processed; for example, Siemens Axiom Artis™ (Siemens AG, Munich, Germany) angiographic systems might improve the image visibility by using edge enhancement and dynamic density optimisation algorithms23. The performance of the new algorithm for the range of phantom MLD below 0.7 mm has improved as evidenced by the decreased percentage deviation from phantom values compared to the earlier software version (10% vs. 35%, respectively, Figure 3)6 and by the smaller difference in accuracy and precision between the overall values and the subgroup of vessel segments with larger MLD. Both statements hold for both 11- and 6-segment models suggesting an overall homogeneous performance of the software, without improvements in small lumen detection counteracting the software performance in the larger diameter range.
BARO vs. BLRO
Local reference analysis is based on the premise that straight vessel segments between adjacent bifurcations are not expected to taper, if assumed healthy6. Since the phantom vessel segments in our study had a constant calibre between bifurcations, BLRO derived RVD values at the site of the obstruction would not be expected to differ from the RVD at the respective reference positions, hence the excellent accuracy and precision for BLRO. Furthermore, in order to stabilise these BLRO derived RVD values, diameters within 1.5 mm proximal and distal to the reference positions are averaged6. However, notwithstanding this averaging process, an automatic regression function taking into account the whole length of the analysed straight vessel segment outside the obstruction boundaries would be expected to be more reproducible. Indeed, whereas BLRO derived RVD values were marginally but not significantly more accurate and precise compared to BARO, the latter method resulted in significantly higher (almost two-fold) reproducibility. This lower reproducibility in BLRO must have resulted from variability in placing the reference points coupled with contour irregularities; had the contours been totally free of noise, selection bias would not have made any difference.
Naturally these effects are pronounced in real coronary cases, where one could expect increased variability for BLRO derived RVD values. Operators may choose different landmarks (bifurcations) dependent on individual perception of what constitutes a true bifurcation (e.g., SB larger than 1.5 mm). Thus analysed segments may become exceedingly long and tapered, which is the case where automatic reference analysis is preferred2. Local reference analysis can still be beneficial in ectatic or diffusely diseased vessels, where a regression function could be severely mistaken, based on either too large or too small diameter values, respectively. Ultimately the point is that, independent of the bifurcation obstruction analysis methods (BARO or BLRO), the true reference of all vessel segments (PMV, DMV, SB) in any bifurcation lesion can be calculated simultaneously with a high accuracy and precision <0.05 mm; accurate sizing of balloons and intracoronary devices including dedicated bifurcation stents facilitates optimal deployment and final kissing ballooning resulting in optimal stent strut apposition24-26.
Improved lumen detection coupled with refined reference obstruction analysis resulted in highly accurate, precise and reproducible DS measurements. In the context of bifurcation PCI, a precision of 3.2-3.7% (BLRO and BARO, respectively, in 11-segment model) for DS measurements at the SB ostium either pre-procedure, after ballooning or after stenting could result in closer correlation with fractional flow reserve values, and thus be included in the decision-making process27-29.
The 11- vs. the 6-segment model
Whereas in the 11-segment model there is a provision for segment 7 reflecting the central bifurcation region, also called the polygon of confluence (POC), in the 6-segment model there is no intervening segment; segments 2 (PMV), 3 (DMV) and 5 (SB) are separated by the point of bifurcation6,16. Thus in the 11-segment model there is a small chance that an obstruction located within the POC may go undetected, if we only take segments 2, 3 and 5 into consideration (Figure 2). However, in this way segments 2, 3 and 5 do not become “contaminated” by contours/diameters derived by interpolation opposite the SB ostium. This difference in bifurcation segment model makes MLD detection more accurate (p=0.06) for the 6-segment model, but more precise for the 11-segment model (p=0.08) (Table 5). Conclusions already made for the relative merits of BARO and BLRO analysis apply to both models. The 6-segment model BARO derived values are slightly more precise and reproducible, probably because on average they are based on longer segments. However differences are too small to make a definite statement. Lastly, one could argue that in the analysis of true coronary cases, the validity and reproducibility of the 11-segment model could be hampered by periprocedural changes in POC size. Indeed, in the original software design, POC definition was based on the luminal contours16, which were obviously different after PCI. A relevant modification has already been integrated in CAAS 5.8, and therefore POC borders are now calculated on the reconstructed obstruction-free reference contours, thus making its size procedure independent. Naturally, the ultimate test for the two models would be the evaluation of their relative merits in the context of a large clinical registry of bifurcation PCI.
Bifurcation angle calculation algorithm did not change per se compared to the CAAS 5.8, thus accuracy and precision were not expected to vary significantly between versions. Indeed, accuracy and precision for the CAAS 5.9 2-D bifurcation QCA were –2.6° and 3.5° whereas they were –2.2° and 3.3°, respectively, for CAAS 5.8. However, calculations had a higher intra- and inter-observer reproducibility in the new version (1.0° and 1.2°, respectively, compared to 1.5° and 1.6° in the CAAS 5.8). Minor differences in BA values must have resulted from differences in contour drawing due to the new small lumen detection algorithm. In any case, 2-D QCA derived angle values are an approximation of a 3-D structure. The widest opening of a given bifurcation and the best view of the SB ostium usually coexist in one single good 2-D image, the AP view in the phantoms’ design. Declining accuracy and precision for BA calculations in the rotated views reflect this phenomenon.
Analysis in rotated views was not part of the validation study, however to a certain degree confirmed its findings. Accuracy and precision for MLD values was improved compared to the earlier version resulting in improved DS results. The 6-segment model was more accurate and precise compared to the 11-segment model. One would expect that a 3-D reconstruction combining these rotated views may have provided even better results compared to either the RAO or the LAO projection, eliminating the effect of overlap30.
Finally, it should be stressed that in vitro validation does not take into account the movement of the coronary arteries and the inherent decrease in image quality from beam scattering and periprocedural thrombus and dissection flaps. However, it is a useful means to objectify software performance and gain insight into the strengths and weaknesses of the software evaluated.
Conclusions
The new lumen detection algorithm integrated into the latest version of the CAAS 2-D bifurcation QCA software improved MLD quantification for true MLD <0.7 mm resulting in highly accurate and precise diameter measurements over the entire range of diameter values anticipated in clinical practice. Furthermore, the optimised algorithm for automatic reference obstruction analysis provides highly accurate, precise and reproducible RVD and DS measurements, which may facilitate device sizing and periprocedural strategy in bifurcation PCI.
Acknowledgements
G. Girasis has received support by the Hellenic Cardiological Society (Athens, Greece), and the Hellenic Heart Foundation (Athens, Greece).
Conflict of interest statement
J.P. Aben and B. Weijers are employees of Pie Medical Imaging. However, none of them were involved in the analysis and interpretation of data, but merely in the description of methodology. The other authors have no conflict of interest to declare.