Abstract
Single-vessel quantitative coronary angiography (QCA) software is inaccurate when used in bifurcation lesions due to the specific anatomical characteristics of bifurcations, including the natural step-down in diameters after every bifurcation. Dedicated bifurcation QCA software has been developed to overcome the limitations of single-vessel QCA in bifurcations. A phantom validation study has shown the superior accuracy of these bifurcation QCA algorithms compared to the single-vessel QCA software. These QCA software algorithms are currently highly recommended to assess bifurcation lesions.
Introduction
Visual estimation of stenosis on coronary angiography has been regarded as unreliable due to a marked intraobserver and interobserver variability1,2. Therefore, quantitative coronary angiography (QCA) software was developed to provide an objective, accurate and reproducible quantification of coronary lesions3,4. Parameters derived from QCA have subsequently been used as surrogate endpoints in randomised clinical trials evaluating the efficacy of new stent technologies and the effect of new pharmaceutical agents on coronary artery disease progression/regression5-7. As described in detail elsewhere in this Bifurcation Supplement8, the human coronary vasculature tree is subject to fractal geometry. As a result, there is a natural step-down in vessel diameter after every bifurcation. In this review we will outline why this natural step-down phenomenon results in inaccurate QCA measurements when conventional single-vessel QCA software is used and why dedicated bifurcation QCA software algorithms are essential to provide accurate measurements.
Challenges in QCA of bifurcation lesions: why conventional single-vessel algorithms are inaccurate in bifurcations
When conventional single-vessel software is used in bifurcation lesions, two analyses should be performed: one from the proximal main branch to the distal main branch (Figure 1A), and the other from the proximal main branch to the side branch (Figure 1B) (or alternatively by starting from the side branch ostium, Figure 1C). In 2009, it was already acknowledged that the use of conventional single-vessel software was inaccurate to assess bifurcation lesions for several reasons which we will address here9.
Why is the use of single-vessel software so problematic? First and foremost, because it completely ignores the natural anatomy of the bifurcation. In the bifurcation core or the so-called polygon of confluence (POC), single-vessel algorithms detect non-existing vessel contours crossing the bifurcation, something which frequently requires manual corrections, which by definition are arbitrary and introduce bias (Online Figure 1). Even more problematic is that it sometimes even creates what we call “pseudo-stenoses”, in which the minimal lumen diameter (MLD) is incorrectly located at the site of the side branch ostium in the middle of the POC, instead of locating the MLD at the true MLD site (Figure 2).
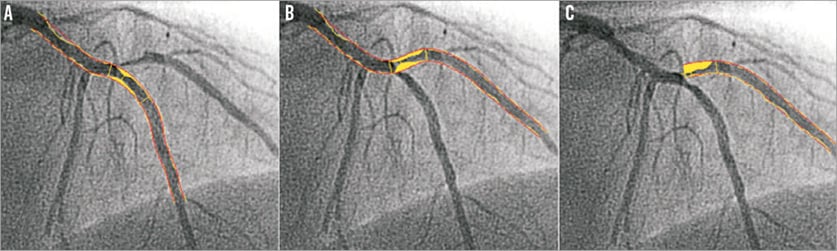
Figure 1. The use of single-vessel quantitative coronary angiography (QCA) software in a bifurcation. When using single-vessel QCA software, one analysis is performed of the main branch (A), and one of the side branch, starting in the proximal main branch (B) or side branch ostium (C).
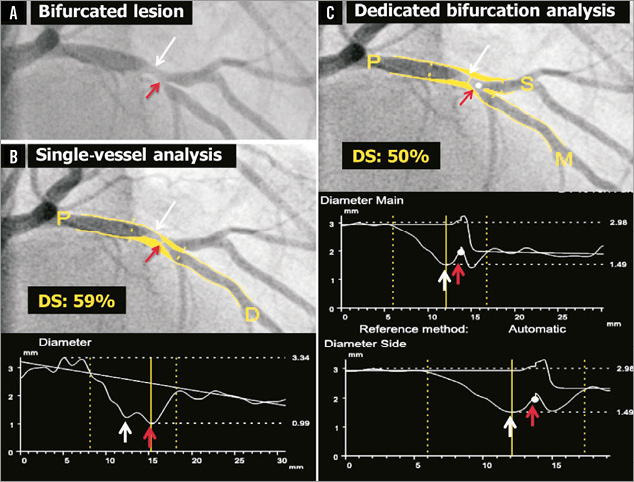
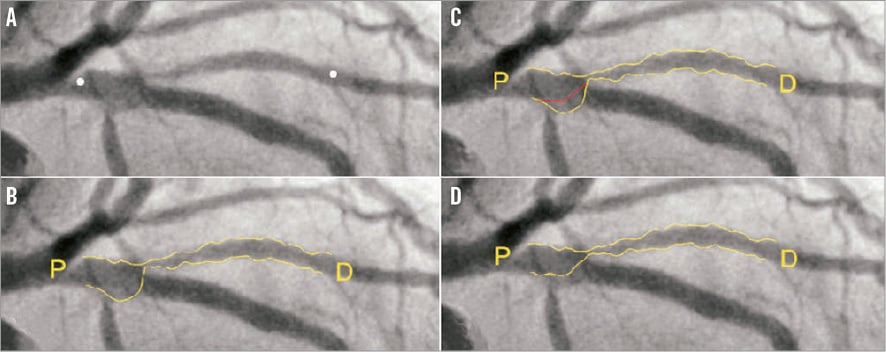
Figure 2. Quantitative coronary angiography of a bifurcation lesion using single-vessel or bifurcation software. Panel A shows a bifurcation lesion. Panel B shows quantitative coronary angiography (QCA) analysis of this bifurcation lesion using single-vessel software creating a “pseudo-stenosis” (red arrow). Panel C shows QCA analysis of the same bifurcation lesion using the bifurcation software. In all panels, the white arrow indicates the true location of the MLD of the proximal main branch, the red arrow the pseudo-stenosis found with single-vessel QCA at the actual location of the point of bifurcation (white dot in C).
Another challenge in QCA of bifurcations is to assess an accurate reference diameter (RefD) to calculate the percent diameter stenosis (%DS). If the single-vessel algorithm is applied to a bifurcation lesion, this will lead to an inaccurate RefD due to the natural differences in diameters proximal and distal to the bifurcation, which is most pronounced at the side branch ostium10. The so-called interpolated RefD will be estimated as too large in the ostia of the distal branches because of the larger proximal diameters (compare interpolated RefD lines in Figure 2B and Figure 2C). Vice versa, the reference diameter of the distal part of the proximal main branch will be underestimated, due to the influence of the smaller distal branch on the interpolated RefD (again, compare interpolated RefD lines in Figures 2B and Figure 2C). Alternatively, a single reference point could be chosen for each segment (i.e., one proximal for the proximal main branch segment, one distal in the side branch for the side branch segment, and one distal in the main branch for the distal main branch segment). However, choosing such reference points is arbitrary and therefore not reproducible. Furthermore, it is conceivable that a RefD based on a single point is less accurate than when the RefD is based on the complete segment.
Another problem with the use of a single-vessel algorithm in bifurcation lesions is the need for manual segment selection. Because the conventional software does not recognise where the proximal branch stops and the distal main branch or side branch begins, this needs to be indicated by the analyst, which introduces another bias and it will therefore be very challenging to indicate exactly the same segments pre-procedure, post-procedure and at follow-up. This is particularly true because the stenoses are located in close proximity to the ostium of the distal branch in most cases.
Dedicated bifurcation QCA software packages
To overcome the above-mentioned shortcomings of single-vessel software, dedicated bifurcation QCA algorithms were developed. Two different QCA software packages are currently available and will be described in detail below.
CAAS (PIE MEDICAL IMAGING)
The Cardiovascular Angiography Analysis System (CAAS; Pie Medical Imaging BV, Maastricht, The Netherlands) bifurcation QCA software has been validated against a precision-manufactured bifurcation phantom model10-13. In the CAAS bifurcation QCA software, the analysis is initialised by three user-defined points: one indicating the proximal boundary of the main branch and two indicating the distal boundaries of the two daughter branches (Figure 3A). Next, the algorithm automatically detects the contours using the “minimal cost algorithm”, a mathematical modelling process based on the differences in the local greyscale and video densitometry (Figure 3B)12,14. If this modelling system erroneously detects a contour outside the vessel, the contour can be corrected either by drawing the contour manually or by using the “restriction function”, excluding an area from the automatic contour detection. The two-dimensional dedicated bifurcation algorithm assumes the bifurcation as a single object with a left, middle and right contour, without making any further assumptions. The “point of bifurcation” (POB) is then defined as the mid-point of the largest possible circle touching all three (i.e., left, middle and right) contours, and is the point where all three centrelines (i.e., the lines through the middle of the vessel) from the proximal main branch, distal main branch and side branch meet (Figure 3C). The intersections of the circle with the centrelines indicate the boundaries of the POC (Figure 3D, Figure 3E). The diameter values are obtained differently inside the POC from those in straight segments outside the POC. Outside the POC, diameters are determined by the shortest distance between the vessel’s outer borders, as in the conventional straight-vessel QCA algorithm. Within the POC, however, another mathematical algorithm, the so-called “minimum freedom” approach, is used. This approach uses the shortest distances from a centreline point to the vessel contours. The distance between these two points on the vessel contours is defined as the diameter of the centreline point and hence the true diameter at the bifurcation (Figure 3F, Moving image 1). The RefD outside the POC is determined from the “healthy” (non-stenotic) part of the branch. Within the POC, the RefD is based on a curvature-based interpolation technique, assuming smooth blood flow from the proximal main branch to the distal branches, the curvature being constant at the POC (Online Figure 2).
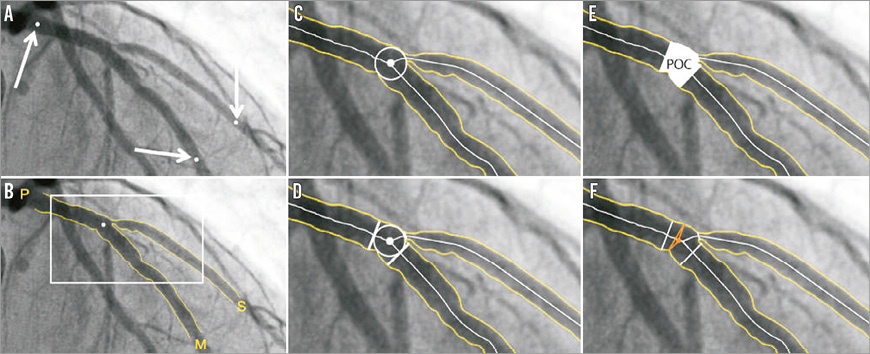
Figure 3. CAAS bifurcation software (Pie Medical). In the CAAS bifurcation QCA software, the segment of analysis is indicated by one proximal and two distal delimiter points (white arrows, A). After automatic detection of the contours (B), the “point of bifurcation” (POB) is defined as the mid-point of the largest possible circle touching all three contours (C). The intersections of the circle with the centrelines (D) indicate the boundaries of the POC (E). The diameter values within the POC are determined by the “minimum freedom” approach (F).
QANGIO XA (MEDIS MEDICAL IMAGING SYSTEMS)
Some of the first basic steps are essentially the same for the QAngio® XA bifurcation software (Medis medical imaging systems bv, Leiden, The Netherlands) as for the CAAS bifurcation software described above15,16. First, the analyst defines the segment of analysis by indicating one proximal start point and an endpoint in each of the distal branches. Then, two wavepath centrelines from proximal to distal are detected. These can be semi-automatically (by providing an additional support point) or manually corrected if necessary (Online Figure 3B). Subsequently, the vessel contour is automatically detected using the minimal cost algorithm (Online Figure 3C). If the vessel contour erroneously detects a contour outside the vessel, the contour can be either semi-automatically corrected (by indicating a support point manually on the vessel edge) or manually corrected by re-drawing the contour by hand. Although the steps above are more or less similar between CAAS and QAngio XA, there is a difference between the two software packages with regard to the anatomic points which are used to define the bifurcation and its measurements. Unlike CAAS using the POB as the cornerstone for its subsequent analyses, QAngio XA uses the carina point on the middle contour as well. This carina point can be manually edited by dragging this point to the correct position, if found to be more appropriate by the analyst. Hereafter, the middle contour detection procedure is executed again, based on the available image information and new carina point, which serves as a support point. Besides that, the position of the “proximal delimiter” of the bifurcation core is automatically determined. This proximal delimiter and the carinal point are important landmarks for the software algorithm to define the four “building blocks” of the bifurcation analysis model (proximal main branch, bifurcation core, distal main branch and side branch). QAngio XA has two different bifurcation models. As recommended by the company, the T-shape model should be used in the vast majority (probably ~>90%) of bifurcation lesions and is selected as default setting in the current version of the QAngio XA software. Alternatively, the Y-shape model can be used. Use of the Y-shape model is recommended by the company only in specific anatomical subsets (e.g., in cases with equally sized distal branches and/or a narrow distal bifurcation angle), or when evaluating specific treatment approaches (skirt stenting for example).
In the T-shape model, the bifurcation core is defined as the area in-between the proximal delimiter, the first diameter of the distal main branch and by a virtual contour between the proximal and distal main branch segments (Figure 4A). The virtual contour separates the main branch from the side branch, creating two sections: 1) the main branch section consisting of the proximal main branch, bifurcation core and distal main branch (Figure 4B, Figure 4C); and 2) the side branch section starting at the virtual contour, continuing into the side branch (Figure 4B, Figure 4D). The diameter function is calculated using Medis straight vessel algorithms for the entire main branch section, whereas an adjusted Medis ostial algorithm is used for the side branch section, reconstructing a proximal flare to correspond to the “mouth” of the ostium17,18. The bifurcation core is excluded when calculating the RefD function, which is calculated for the proximal main branch segment, distal main branch segment, and side branch section separately. Within the bifurcation core, the interpolated reference diameters are determined linearly by means of a straight RefD function (corresponding to the virtual contour of the bifurcation core) (Figure 4A, Figure 4C).
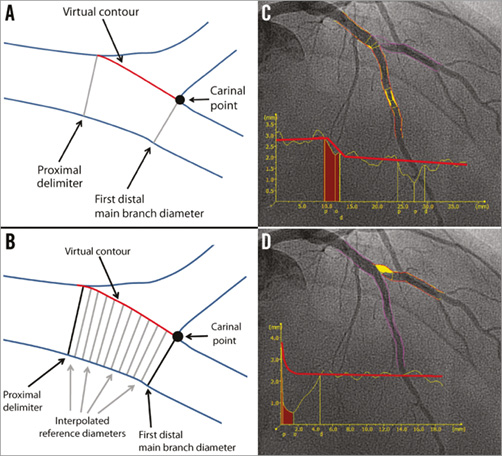
Figure 4. T-shape model of the QAngio XA bifurcation QCA software. A) The anatomic landmarks used to define the four “building blocks” of the bifurcation analysis model: the proximal delimiter, the first diameter of the distal main branch, the virtual contour between the proximal and distal main branch segments, and the carinal point. B) The interpolated reference diameter (virtual contour) of the bifurcation core, which is determined linearly by means of a straight reference diameter function. C) The QCA (including the diameter function) of the combined main branch, with a separate diameter function for each building block. D) QCA of the side branch, including the diameter function using the adjusted Medis ostial algorithm.
In the Y-shape model, the bifurcation core is defined as the area between the proximal delimiter and the carinal point (Figure 5A). Three different segments are analysed in the Y-shape model: 1) the proximal section from the proximal boundary to the carina point; 2) the “distal 1” section from the first distal 1 diameter to the distal 1 boundary; and 3) the “distal 2” section from the first distal 2 diameter to the distal 2 boundary. The interpolated RefD functions of the three segments (proximal, distal 1 and distal 2) outside the bifurcation core are derived by an iterative regression technique17. The RefD function of the bifurcation core itself is based on two interpolated reference contours (spline-based)18. The graph of the RefD function of the proximal main branch displays the combined function of the proximal main branch and the bifurcation core, up to the carinal point. This combined function is straight for the proximal segment and curved in the bifurcation core (Figure 5B). The RefD functions of the distal sections are straight and displayed as one function (Figure 5C, Figure 5D).
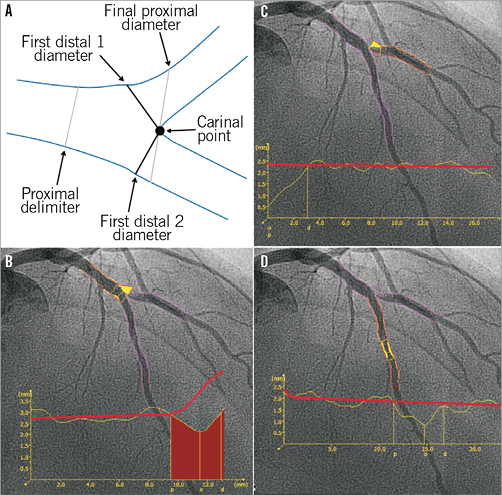
Figure 5. Y-shape model of the QAngio XA software. A) The anatomic landmarks used to define the four building blocks of the bifurcation analysis. B) The QCA of the proximal section, consisting of the proximal segment (up to the proximal delimiter) and the bifurcation core. C) & D) The QCA and reference vessel diameter functions of the distal 1 and distal 2 branches. Note that the reference diameter functions of the distal sections are straight and displayed as one function.
Comparison of single-vessel software with dedicated bifurcation QCA software algorithms in a bifurcation phantom
To assess the inaccuracy of the single-vessel software in bifurcation lesions objectively, and to validate both QAngio XA and CAAS bifurcation software algorithms, a phantom validation study was performed by our group. For this analysis, six precision phantoms with a total of 18 bifurcations made from Plexiglas with a tolerance <10 μm were used13. The 18 bifurcations were analysed three times: 1) with the conventional single-vessel algorithm of CAAS (version 5.10); 2) with the bifurcation algorithm of CAAS (version 5.10); and 3) with the bifurcation algorithm of QAngio XA (version 7.3) (Online Figure 4)10. The single-vessel analysis was performed from the proximal main branch to the distal main branch and from the proximal main branch to the side branch10.
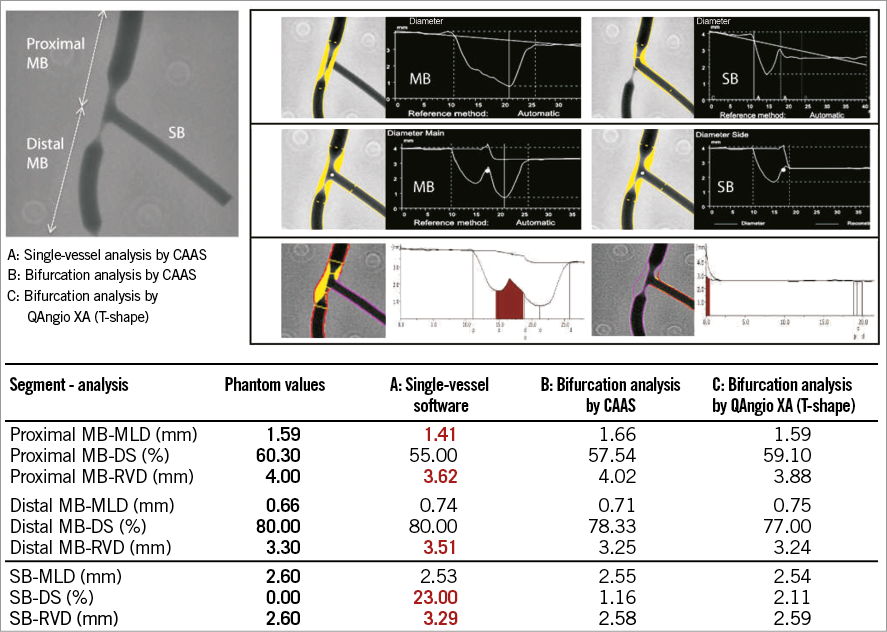
We found that conventional single-vessel analysis underestimated the RefD and %DS in the proximal main branch, whilst these parameters were overestimated in the distal main branch and side branch (case example in Online Figure 4). Overall, combining all three segments of the 18 bifurcations (54 segments), the accuracy and precision with single-vessel software was very poor with regard to the RefD (-0.108±0.352 mm) and %DS (5.69±11.28%)10. The bifurcation algorithms on the other hand proved to be highly accurate and precise, with comparable accuracy and precision between the CAAS and QAngio XA (with systematic use of the T-shape model) bifurcation software models with regard to MLD (0.012±0.103 vs. 0.012±0.093 mm, p=0.104), RefD (0.050±0.043 vs. –0.045±0.064 mm, p=0.106), and %DS (0.94±4.07 vs. 0.74±3.81%, p=0.121) (Figure 6).
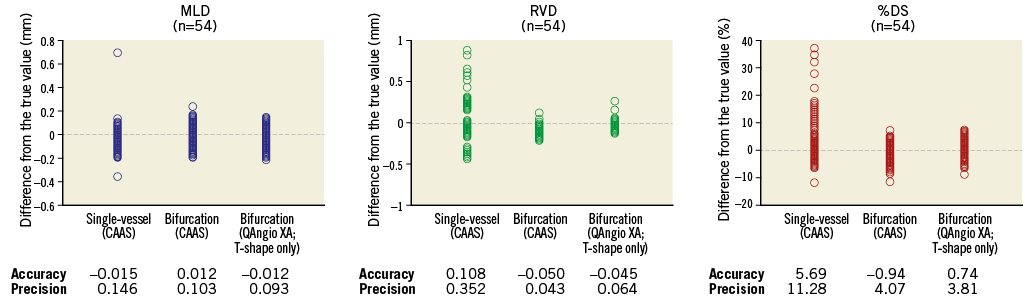
Figure 6. Accuracy and precision of single-vessel QCA software and bifurcation QCA software in all phantom bifurcation segments (n=54). Differences between the measured values (MLD, RVD and %DS) and the true phantom values for all 54 segments (18 bifurcations) for the single-vessel analysis (CAAS), bifurcation analysis using CAAS, and bifurcation analysis using QAngio XA (T-shape only). The accuracy was defined as the mean difference from the true value, and precision was defined as the standard deviation of the mean difference.
Why is this important?
The most important conclusion from the study above is that the conventional single-vessel QCA method is inaccurate in bifurcation lesions and that both CAAS and QAngio XA (when systematically using the T-shape model) bifurcation algorithms are highly accurate and precise in bifurcation lesions. But why is this so important? Overestimation of the %DS of the distal main and side branch by single-vessel analysis may potentially have clinical implications. We are already aware that ostial side branch stenosis severity is overestimated with visual estimation19. However, the side branch stenosis will also be overestimated when single-vessel QCA analysis is used pre-procedure, which may lead to the overtreatment of insignificant stenosis (e.g., treatment of side branch without significant stenosis).
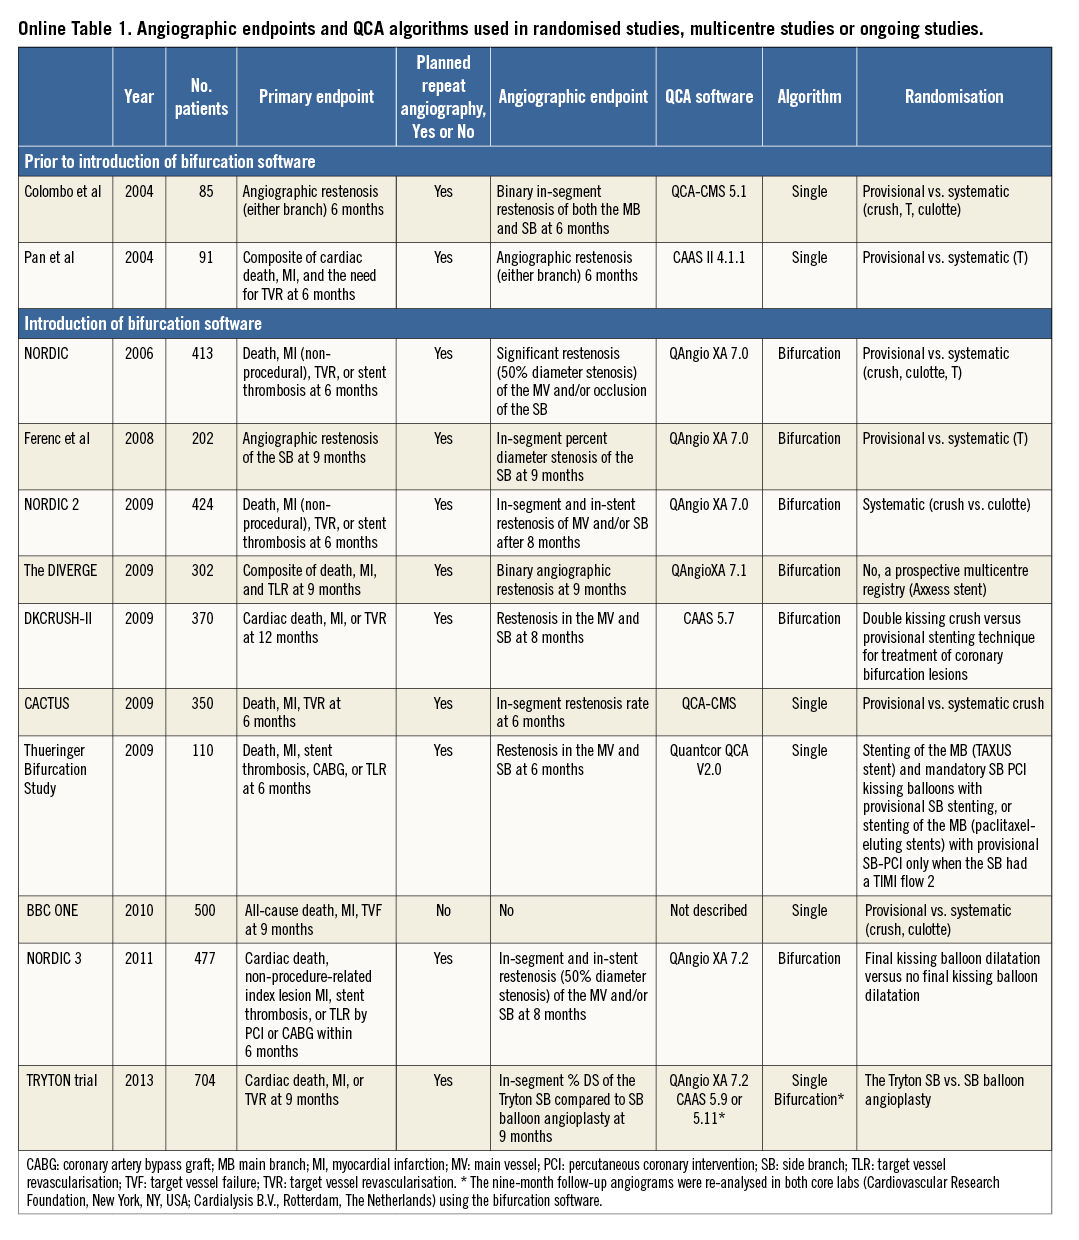
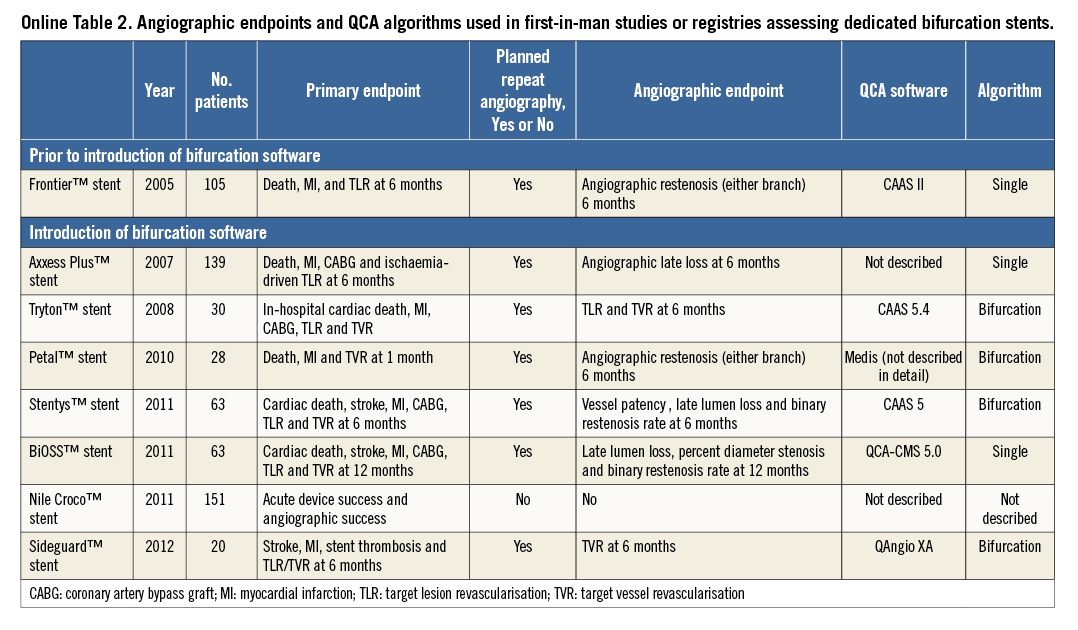
Besides clinical implications, use of single-vessel QCA may also have implications in clinical trials. The major randomised trials comparing single stenting with systematic double stenting have used the single-vessel analysis (Online Table 1)20-22. Inclusion of lesions based on the single-vessel analysis may result in biased selection of target lesions, with an overestimation of “true” bifurcation rates (i.e., Medina 0,1,1; 1,0,1; or 1,1,1)9. Furthermore, single-vessel software use in bifurcation trials (Online Table 1) or first-in-man/registry studies on dedicated bifurcation stents (Online Table 2) with planned repeat angiography will lead to less accurate results of the side branch. A recent example was the Tryton IDE trial showing different QCA outcomes with dedicated bifurcation QCA from those with single-vessel QCA23,24. Furthermore, as defined by the Academic Research Consortium25, justification of target lesion revascularisation (TLR) (i.e., “ischaemia-driven” vs. “non-ischaemia-driven” TLR) is based on %DS assessed by QCA. The use of single-vessel software in such trials may therefore lead to an increased rate of ischaemia-driven target TLR of the side branch.
European Bifurcation Club recommendations in reporting QCA
The European Bifurcation Club (EBC) recommends reporting the QCA results according to the three segments of the bifurcation (i.e., proximal main, distal main, and side branch)9,26. Binary restenosis is best reported as QCA-based Medina scores at every time point (i.e., pre-procedure, post-procedure and follow-up). One of the advantages of such per-segment reporting is that the healing pattern of the bifurcation treatment can be better understood (i.e., more complex restenosis patterns including main and side branch vs. relatively simple restenosis patterns including main branch only). Another important issue is that the MLD can be relocated from one segment to another. When using single-vessel software, the post-procedural MLD might, for example, be located in the (non-stenotic) distal main branch, whilst at follow-up the MLD might be (re-)located in the (stenotic) proximal main branches. Especially when there is a large difference in reference diameters between the proximal and distal main branch, the late lumen loss (LLL) value calculated from these two MLD values might be artificially low. When the LLL is calculated for the three segments separately, the LLL value is probably more accurate in representing the restenotic effect in a particular segment.
Conclusions
Conventional single-vessel QCA software is inaccurate in bifurcation lesions because it completely ignores the natural anatomy of the bifurcation, including the natural “step-down” in diameters after each bifurcation. Dedicated bifurcation software algorithms have been developed: currently, two different software packages are commercially available (CAAS and QAngio XA). The two software packages use slightly different approaches, but both have proven to be highly accurate when validated against precision-manufactured bifurcation phantoms.
Conflict of interest statement
J. Tuinenburg is employed by Medis medical imaging systems bv. J. Reiber is the CEO of Medis medical imaging systems bv. J-P. Aben is employed by Pie Medical Imaging BV. P. Serruys is chairman of the Tryton IDE trial. S. Tu had an employment contract with Medis until June 2014. The other authors have no conflicts of interest to declare.
Online Figure 1. Single-vessel QCA creating a virtual contour crossing the side branch ostium. After indicating the proximal and distal boundaries of the region of interest (white dots) in a left anterior descending-first diagonal bifurcation lesion (A), the vessel contour was detected automatically by the bifurcation software (B). Note that, in the so-called polygon of confluence (POC), the software detected the ostium of a septal side branch as vessel contour. In this case, this was corrected by re-drawing the contour manually, which seems to be arbitrary (C). D) The final vessel contour of the QCA.
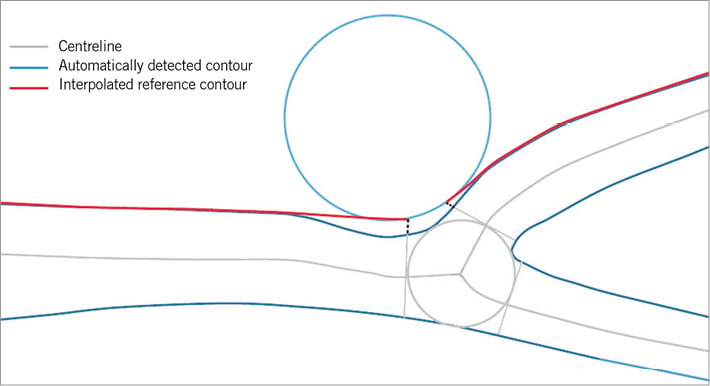
Online Figure 2. Curvature-based interpolation technique of CAAS bifurcation software.
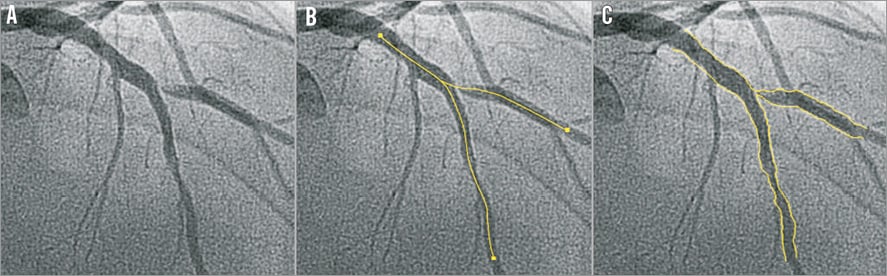
Online Figure 3. Introduction steps of QAngio XA bifurcation software. A) A left anterior descending artery-diagonal branch bifurcation lesion. First, the analyst defines the segment of analysis by indicating one proximal start point and an endpoint in each of the distal branches, after which two wavepath centrelines from proximal to distal are detected (note that the proximal parts overlap) (B). Subsequently, the vessel contour is automatically detected using the minimal cost algorithm (C).
Online Figure 4. Example of a representative QCA analysis on the bifurcation phantom model. Example of a representative QCA analysis on one of the phantom bifurcations using single-vessel software (A) and dedicated bifurcation software (B & C). Note that, in this particular case, the single-vessel software underestimates the reference vessel diameter in the proximal main branch, while it overestimates the reference vessel diameter in the distal main branch and side branch. Furthermore, the MLD in the proximal main branch is inaccurate.
Online data supplement
Moving image 1. “Minimum freedom” approach to determine the diameter function in the polygon of confluence.