
Abstract
Understanding interference effects toward the detection of target analytes is important. In an earlier work we reported for the first time the use of the barrier width (BW) technique using a single concentration of the target analyte (Cd2+) to characterize the interference effects of various heavy metal ions with lesser number of experiments as compared to the conventional stripping current based peak reduction (PR) technique, and developed a scale of interference. There is a need to benchmark the BW technique with the PR technique for its claim of usage and to develop a scale of interference with a higher resolution. In this work, utilizing the BW technique we report the analysis based on Cd2+ concentrations spanning two orders of magnitude and interfering ions (Al3+ (less interfering), Fe2+ (moderately interfering) and Cr6+ (heavily interfering)) also spanning two orders of magnitude. The sensitivity parameters were benchmarked thereby validating BW technique. Adsorption isotherms were constructed for each case and −ΔGads values were evaluated. A correlation obtained from the sensitivity parameters from the BW and PR techniques and −ΔGads yielded an interference scale with a resolution higher than that of the scale obtained by the PR technique or the BW technique.
Export citation and abstract BibTeX RIS
Heavy metal contamination has deleterious effects on human health and the environment. The conventional detection techniques available for the detection of heavy metals, such as ICPMS,1 AAS,2 HPLC3 etc. are expensive, non-portable, and require complex experimental procedure.4,5 Therefore there is a need for portable and inexpensive techniques suitable for field use. The performance parameters of such devices include the limit of detection (LOD) and the selectivity. Conventionally, the selectivity or the interference effect has been studied by examining the reduction of signal6,7 or the selectivity coefficient method.8,9 Both have limitations - the method of the reduction of the peak signal requires a large number of experiments, and the selectivity coefficient method cannot explain interference pattern for the ions which has different charges than the analyte of interest.10,11
In our previous work,12 we reported a new technique based on the ratio of the barrier widths in presence and absence of the analyte; a model for charge transport was established based on their interference toward the target analyte (cadmium), which explained the interference phenomenon based on the barrier width (BW) for charge transfer (the BW of the target analyte increases when interfering ions are present); and a scale was developed based on the differentiation of non-interfering, less interfering, moderately interfering and heavily interfering heavy metal ions with lesser number of experiments. The process of heavy metal ion sensing by stripping voltammetry with square wave pulse (square wave voltammetry (SWV)) is a sequential process of transport of ions from the bulk electrolyte to the electrode surface for the adsorption of ions at a negative potential and desorption (stripping) when the potential is moved toward the positive direction. In the peak reduction (PR) technique, the parameter which constitutes the sensor response is the measured peak desorption current. On the other hand, in the BW technique which is based on Simmon's model13,14 and the tunnelling phenomenon, the parameter which constitutes the sensor response is the barrier width which is extracted from cyclic voltammetry and electrochemical impedance spectroscopy measurements.12 The sensor responses, which are the variations of the sensed parameters, are a function of the type and concentration of the interfering ions. There is a need to benchmark the BW technique with the PR technique to strengthen the claim to usage. In addition, there is a scope of further strengthening the understanding of the interference effect by studying and incorporating the phenomena of adsorption/desorption to obtain a scale of interference with further improved resolution. These are the objectives of the present work.
In the present work, first the BW technique was benchmarked with the PR technique using SWV. In our previous work,12 the BW technique was studied for a specific concentration of cadmium in presence of two concentrations of interfering species. In this work, detection of concentrations of the analyte of interest (cadmium) spanning two orders of magnitude, in presence of different concentrations of different interfering ions was studied. For each case, the barrier width for the analyte of interest was calculated. The variations of peak currents and barrier widths with respect to the concentrations of cadmium were analyzed. The sensitivities obtained from these calibration plots were calculated and plotted against the concentrations of the interfering species from which the slopes were calculated and compared. Such an analysis has not been reported till date. Again, in our previous work, the adsorption isotherm for cadmium sensing was plotted in absence of any interfering ion. In the present work, these were plotted in the presence of interfering ions. For each case of the interfering ion concentration, adsorption isotherms were obtained for the analyte of interest. From the adsorption isotherms, −ΔGads values were extracted and were plotted against the concentrations of interfering ions and slopes were calculated. Varying concentrations of three test ions - Al3+ (less interfering), Fe2+ (moderately interfering) and Cr6+ (heavily interfering) were chosen. With the sensitivity values – from SWV peak currents and barrier width plots, and −ΔGads values, a correlation was obtained from which a scale for interference was developed and compared to that obtained from the PR technique. Such an analysis has not been reported till date.
Experimental
The materials and methods are similar to those used in our previous work. For the sake of completeness, these are briefly mentioned here.
Materials and methods
Aniline, sodium arsenate, chromium oxide salts were purchased from Loba Chemicals (Mumbai, India); cadmium chloride, lead acetate, copper nitrate, strontium nitrate were purchased from Rankem (India); potassium chloride, sodium acetate, potassium ferricyanide, potassium ferrocyanide, magnesium chloride, zinc nitrate, aluminum chloride were purchased from Fischer Scientific (USA); triethylamine and sulfuric acid (H2SO4. 6H2O) were obtained from Qualigens (USA). N-hydroxysuccinimide (NHS), 1-ethyl-3-(3-dimethylaminopropyl) carbodiimide hydrochloride (EDC) and phenyl glycine, were obtained from Sigma Aldrich (USA); di-sodium hydrogen phosphate, diethylamine, acetic acid glacial and hydrochloric acid from Merck (Germany). All the chemicals were of analytical grade.
Double distilled water (conductivity ≤ 0.2μS/cm) was used for preparing the solutions. All the electrochemical tests were performed using an electrochemical workstation, Auto-lab PGSTAT 302N, Eco chemie, The Netherlands) connected to a three electrode cell. The counter electrode was a platinum rod and saturated Ag/AgCl was used as the reference electrode. The working electrode comprised a stainless steel (SS, 304) plate 1.5 cm × 1 cm of thickness 1 mm onto which the copolymer was deposited. For deposition of the copolymer, the electrode was dipped into the electrolyte to a depth of 0.5 cm so that the effective surface area for metal ion sensing was 1.5 cm2 (i.e., both surfaces of 0.5 cm × 1.5 cm). A glass cell was used which was fitted by a suitable arrangement of electrodes so that the reference electrode was closer to the working electrode than the counter electrode.
Experimental method
Similar to our previous work, copolymer of aniline and N-phenylglycine was synthesized by chronopotentiometry onto the stainless steel (SS 304) electrode. The electrode surface was functionalized with iminodiacetate groups comprising N-atom with carboxylate dimmers. The procedures are described in the previous work. For this work, three interfering ions from three different categories were chosen and experiments were performed. Al3+ was chosen from the less interfering class, Fe2+ from the moderately interfering class and Cr6+ from the heavily interfering class. In this work, non-interfering ions are not considered for any further studies.
Experimental design
The schematic of the complete experimental design is shown in Figure 1.
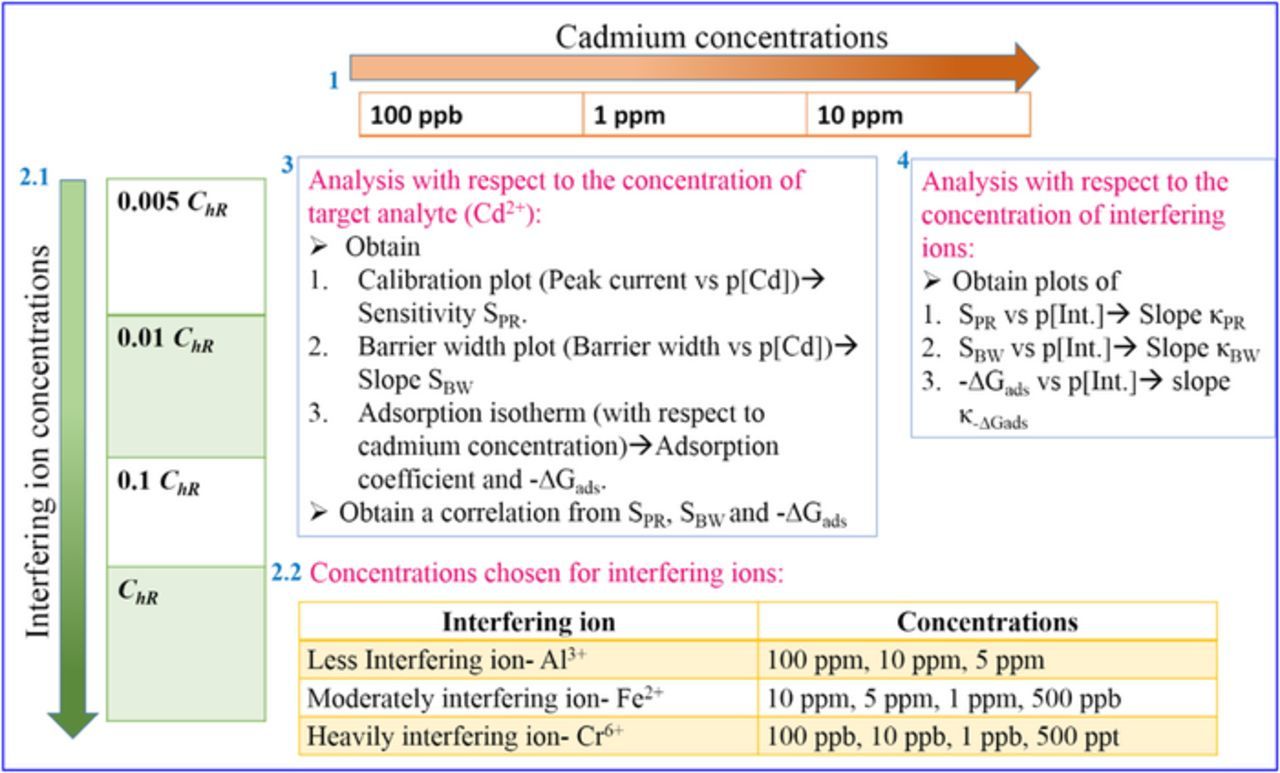
Figure 1. Schematic of the complete experimental procedure.
Figure 1 has different segments. Segment 1 shows the three different cadmium concentrations – 100 ppb, 1 ppm and 10 ppm, chosen for this work. Segment 2.1 indicates the concentrations of different interfering ions. The interfering behavior of these ions is pictorially described in Figure 9 of our previous work12 where the terms 'h' and 'ChR' are explained. The highest concentration of the interfering ion was termed as ChR. Now, at certain concentrations of the interfering ion, no interference was observed, thus with no reduction in 'h'. In all the cases studied, this specific concentration of the interfering ions was ∼0.001ChR. Therefore in order to quantify the interference behavior, two extreme concentrations i.e., ChR and 0.005 ChR were chosen for the different interfering ions and these two values are different for the different types of interfering species. The specific concentrations of these ions are mentioned in segment 2.2. Segment 3 shows the analysis based on the concentration of target analyte, i.e., Cd2+. Two approaches were adopted – analysis based on the concentration of the target analyte and based on the concentrations of interfering ions, for this work. In that approach, SWV experiments were conducted for varying concentrations of cadmium in presence of each concentrations of interfering ion as mentioned in segment 2. The PR technique and the BW technique were conducted for each case in order to establish the interference patterns of the various test ions toward cadmium. The calibration plots of the peak currents measured from SWV plots and the extracted barrier width values, plotted against the negative logarithmic concentration of cadmium ion, were compared to benchmark the BW technique. These calibration plots from PR technique and BW technique yielded slopes termed as SPR, SBW respectively. The adsorption isotherms for cadmium in presence of each of the concentrations of interfering ions were established. From the plots, values of adsorption coefficient, were extracted from which values of the Gibb's free energy of adsorption, −ΔGads were evaluated. A correlation was achieved from SPR, SBW and −ΔGads. Segment 4 indicates the analysis based on the interfering ion concentrations. In this method, the SPR, SBW and −ΔGads values were plotted against the negative logarithmic concentration of interfering ions and the slopes κPR, κBW and κ-ΔGads respectively were evaluated. κPR, κBW and κ-ΔGads, can be defined as the change in SPR, SBW and −ΔGads with respect to change in unit concentration of interfering ion, respectively. In all the cases, each solutions contained two ions- Cd2+ and one interfering ion. The electrolyte for each case was 0.1 M phosphate buffer solution at pH 3.3 containing Cd2+ and interfering ion. For all the electrochemical experiments Ag/AgCl electrode was chosen as the reference electrode and platinum wire electrode was chosen as the counter electrode. The functionalized copolymer electrode served as the working electrode.
Square wave voltammetry
At first the functionalized electrode surface was immersed in the electrolyte for 30 min for preconcentration. A negative potential of −1.2 V was applied onto the working electrode for 200 s in order to reduce the ions at the electrode surface. Then the potential was shifted toward the positive direction and cadmium ions got stripped out from the surface at stripping potential within −0.8V to −0.78 V. From SWV plots peak currents were evaluated and calibration plots were obtained and compared for each case.
Cyclic voltammetry
Cyclic voltammetry (CV) was performed in order to calculate the barrier height. CV was performed with 40 ppm cadmium ion with higher concentrations of each interfering ions in 0.1 M phosphate buffer solution. These experiments were performed with all the three interfering ions using the IDA modified copolymer (working) electrode at a potential window −1 V to 1 V and with a scan rate of 100 mV/sec. From CV, the oxidation and reduction peak potentials were evaluated and the lowest occupied molecular orbital (LUMO) and hence the barrier heights were calculated for each of the interfering ion cases.12
Electrochemical impedance spectroscopy
Electrochemical impedance spectroscopy (EIS) was performed in order to calculate the charge transport resistance in order to evaluate the values of the barrier widths. All the EIS experiments were performed at the frequency range from 100000 to 1 Hz and at fixed potential of −0.4 V. From these experiments, Nyquist plots were obtained and equivalent circuits were developed. From these circuits, the charge transport resistances were evaluated and compared for each of the interfering ions.
Results and Discussion
Construction of calibration plots and analysis of the sensitivity values
Figure 2 shows the SWV peak currents plotted as a function of the negative logarithm of the cadmium concentration (p[Cd]) in the range of 100 ppb to 10 ppm for different concentrations of interferants, Al3+ (2a), Fe2+ (2b) and Cr6+ (2c), as mentioned in Figure 1. The SWV peak currents, for all the interferant types and concentrations used, decreased linearly with respect to p[Cd]. There are several reports which showed the linear behavior of the sensor signal (potential,15 fluorescence emission,16 optical density,17 current,18 square wave peak current,12 reflectance,19 percentage of inhibition)20 with respect to the logarithmic concentration of the analyte of interest.
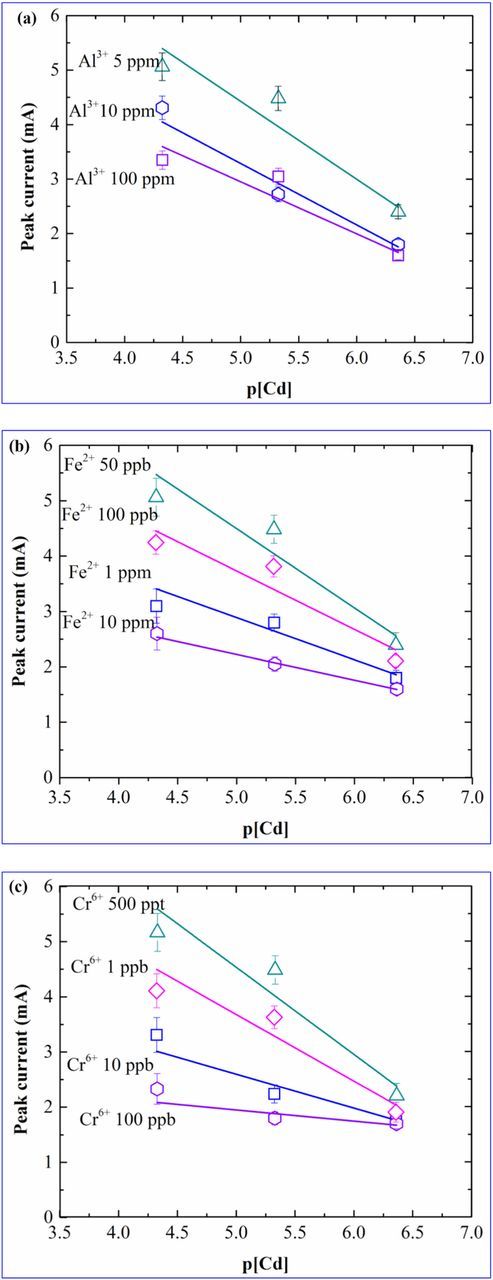
Figure 2. Calibration plots obtained for sensitivity values vs p[Cd] in presence of (a) Al3+, (b) Fe2+, (c) Cr6+.
Next, the slopes of the plots of the peak currents, i.e., SPR, were calculated for all the cases and are presented as a function of the negative logarithm of the interfering ion concentrations, p[Interfering ion] in Figure 3. It is observed that the SPR varies linearly with p[Interfering ion] for all cases studied. There are literature reports where the sensitivity change in presence of interfering ions or cross sensitivity have been shown to decrease with increased concentrations of the interfering species.15,21–24 Regarding heavy metals, while there are few reports using chronopotentiometry which have studied the cross sensitivity, there is no report available till date which shows sensitivity change in presence of interfering species utilizing SWV.
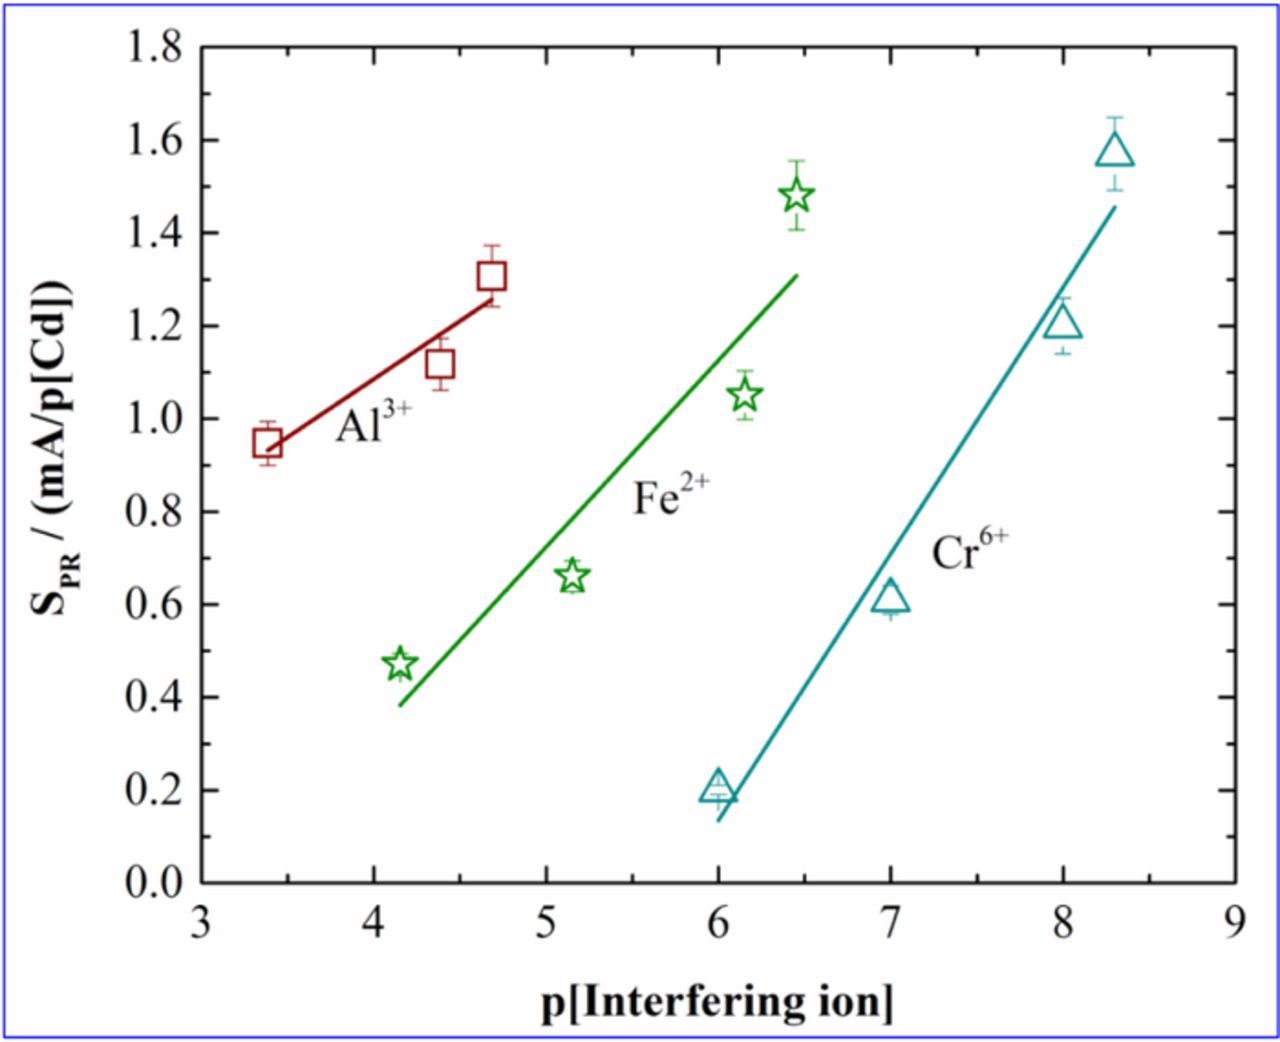
Figure 3. Calibration plots obtained for sensitivity values (SPR) of Cadmium vs p[Interfering ion].
Sensitivity was lowest in presence of 100 ppb of chromium and increased with the chromium concentration. Similarly for decrease in sensitivity was observed for increase in Fe2+ concentrations and Al3+ concentrations.
From the figure, it is seen that the slope for Al3+ is the lowest and for Cr6+ is the highest among all the three ions. Since Al3+ is a 'less interfering' ion, therefore, highest sensitivity was observed for cadmium in presence of Al3+ when compared to the other interfering ions. This indicates that the presence of Al3+ has a relatively lower influence in the IDA-cadmium ion reaction as compared to the other ions. Since Cr6+ is a "heavily interfering" ion, therefore, it has a strong impact on the sensitivity of the sensing surface toward cadmium. The κPR values obtained from the Figure 3 for Al3+, Fe2+ and Cr6+ were 0.25, 0.40, 0.57 respectively. The observed κPR value was lowest in case of Al3+ while it showed the highest in case of Cr6+. In our previous work,12 calibration plot for cadmium was constructed in absence of interfering ions. The current work explains the cross sensitivity behavior of the sensor.
In order to quantify the interference behavior, a ratio RPR has been developed, which can be defined as the ratio of highest value of SPR to that of the lowest of SPR in presence of an interfering ion. Table I summarizes the ratios. From Table I it is seen that the RPR is the lowest for Al3+ and highest for Cr6+. Therefore, this interference scale, based on the conventional PR technique, can be considered to be a defined scale to generate the extent of interference. As mentioned, the main drawback with this scale is it requires a larger number of experiments. Now, as mentioned, in our previous work,12 the hypothesis based on the BW technique was used which requires lesser number of experiments to identify the extent of interference. Next, the barrier width for each case is calculated and it is compared with the results of the PR technique.
Table I. Interference scale (RPR values) based on the PR technique.
| Interfering ion | RPR | |
|---|---|---|
| Less interfering ion | Al3+ | 1.38 |
| Moderately interfering ion | Fe2+ | 3.04 |
| Heavily interfering ion | Cr6+ | 7.81 |
Establishment of barrier width plots and its sensitivity analysis
In our earlier work, a scale, based on the ratios of the barrier widths was obtained which showed significant similarities with the SWV results and thereby can be used to explain the interference effect. In that case, cadmium of 100 ppb concentration was chosen with interfering ions of two concentrations – 100 ppb and 'ChR', and the barrier width values for the two conditions were obtained. A scale of interference was developed based on the ratio 'r' calculated for the two cases, which was defined as the barrier width of cadmium in presence of an interfering ion to that in absence of an interfering ion. In this work, the barrier widths for each of the cases depicted in Figure 1, were calculated and the same principle is used to analyze the pattern of interference of these test ions at different concentrations of cadmium as was done in PR technique described in Construction of calibration plots and analysis of the sensitivity values section, and the results were compared with the results from the PR technique. Calibration plots of barrier widths with respect to p[Cd] at different concentrations of interfering ions were obtained and are shown in Figure 4 for Al3+ (4a), Fe2+ (4b), Cr6+ (4c). For all the cases studied here, linear behavior of the barrier widths with the negative logarithm of the Cd concentration are observed.
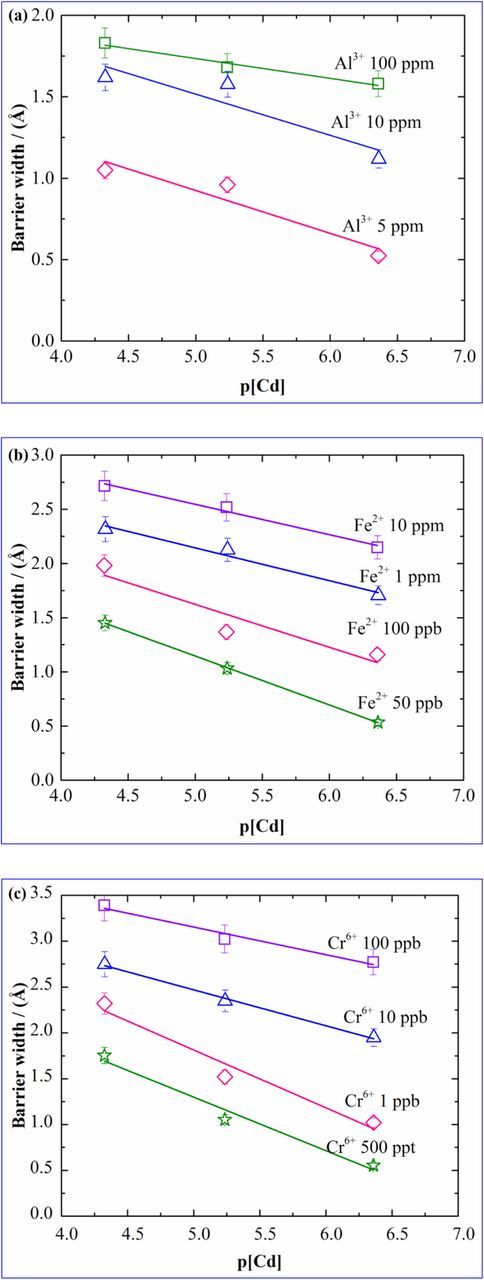
Figure 4. Plots of barrier width of cadmium vs p[Cd] in presence of (a) Al3+, (b) Fe2+, (c) Cr6+.
The barrier width values increase with the concentrations of the interfering ions. It was observed that the plots of the barrier width show trends similar to that of peak current response plots obtained in Figure 2. As mentioned, in order to benchmark the hypothesis regarding the BW technique for interference measurement, we compared the interference patterns for the test ions toward Cd2+ with the SWV PR technique and thus it was validated.
Figure 5 shows the values SBW as a function of p[Interfering ion]. The plots showed a linear behavior for all the three interfering ions. Values of SBW increase as the interfering ion concentration decreases. It can be estimated that since Al3+ is less interfering and therefore has less impact on the hindrance of cadmium sensing. That is why the slope SBW is the lowest for Al3+ and the slope increases for Fe2+ and is the highest for Cr6+. It indicates that the slope is highest for the ions which have strong impact on cadmium sensing. The κBW values are 0.113, 0.123 and 0.142 for Al3+, Fe2+ and Cr6+ respectively. The observed κBW value was the lowest in case of Al3+ and the highest in case of Cr6+. The patterns of the κBW values were similar to that for κPR.
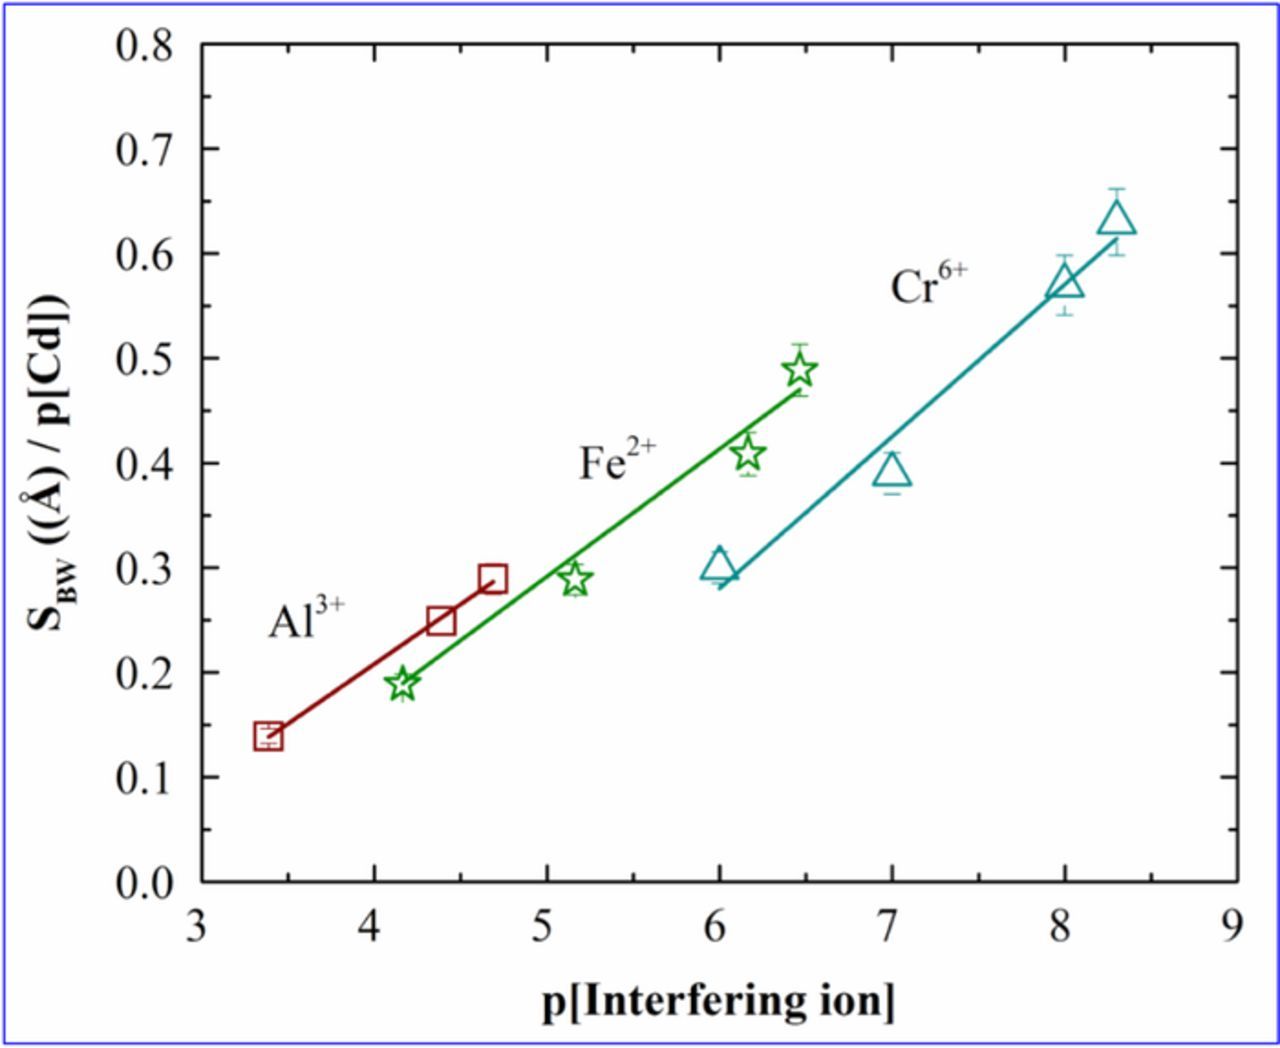
Figure 5. Plots of the slopes (SBW) of barrier width of cadmium vs p[Al3+], p[Fe2+], p[Cr6+].
From the above analysis, based on the SBW and κBW values, it is evident that the hypothesis based on BW technique stands well for quantifying interference. Both the barrier width and peak current reduction process do not distinctly illustrate the extent of interaction of the IDA-cadmium reaction. Therefore an approach can be made by consolidating the adsorption phenomena along with the BW technique, to understand the fundamental mechanism at the electrode/electrolyte interface. To highlight this phenomenon it is necessary to develop adsorption isotherm which can explain the interaction process through Gibb's free energy. Moreover illustration of the competitive adsorption phenomenon can necessarily transpose the effect of cross sensitivity and the BW technique.
Adsorption isotherm
The objective of this section is to elucidate the competition between the adsorption of the interfering ions and the adsorption of the cadmium ions onto the active sites of the electrode surface. During the preconcentration step, the ions are transported to the surface and at −1.2 V get deposited onto the surface. Adsorption isotherms provide the pattern of the surface coverage of the desired analyte and the adsorption coefficients signify the partitioning of the ions between the two phases which in turn describe the competition between the cadmium ions and the interfering ions. There are several reports available which describe the competitive adsorption in bicomponent or multicomponent systems which include cadmium in typical adsorption processes,25–35 and the competitive adsorption of cadmium in presence of other ions with IDA as the ligand.36–39 In almost all these cases, the Langmuir adsorption isotherm is established and hence is used here. Figure 6 shows the adsorption isotherms of Cd2+ in presence of interferants (a-Al3+, b-Fe2+, c-Cr6+) of different concentrations. In our previous work12 the adsorption isotherm for cadmium was developed in absence of interfering ion where the −ΔGads value of 49.53 KJ/mol was obtained. The present work involves establishment of adsorption isotherms in presence of interfering ions. From the adsorption isotherms, the adsorption coefficient α and −ΔGads values for each case have been calculated. The procedure to obtain α and −ΔGads have been described in our previous work. Figure 6 shows the adsorption isotherm for cadmium in presence of interfering ions (a-Al3+, b-Fe2+, c-Cr6+).
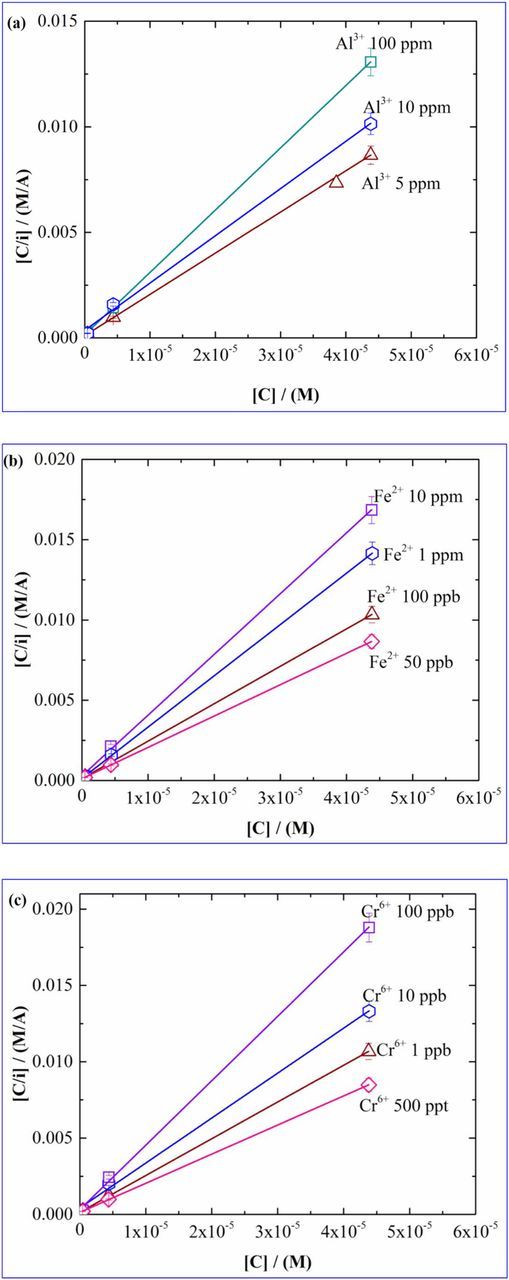
Figure 6. Adsorption isotherm for cadmium in presence of (a) Al3+, (b) Fe2+, (c) Cr6+.
It has been observed that as the interference level decreases, −ΔGads which indicates the nature of adsorption process decreases. It has been reported that if the −ΔGads values are more than 40 KJ/mol, it signifies that there is sharing or transfer of charge from the electrode surface to the cadmium ion signifying establishment of chemical adsorption.40,41 It can be noted that in all the cases, the −ΔGads values are more than 40 KJ/mol. This signifies that even in presence of an interfering ion, there is significant chemical adsorption of cadmium ion onto the electrode surface. The −ΔGads values obtained from the adsorption isotherms are plotted against p[Interfering ion] and are showed in Figure 7. From Figure 7 it is observed that the −ΔGads values decrease as there is increase in concentration of the interfering ions. This illustrates that the presence of interference hinder the chemical adsorption process of cadmium onto the IDA covered copolymer surface.
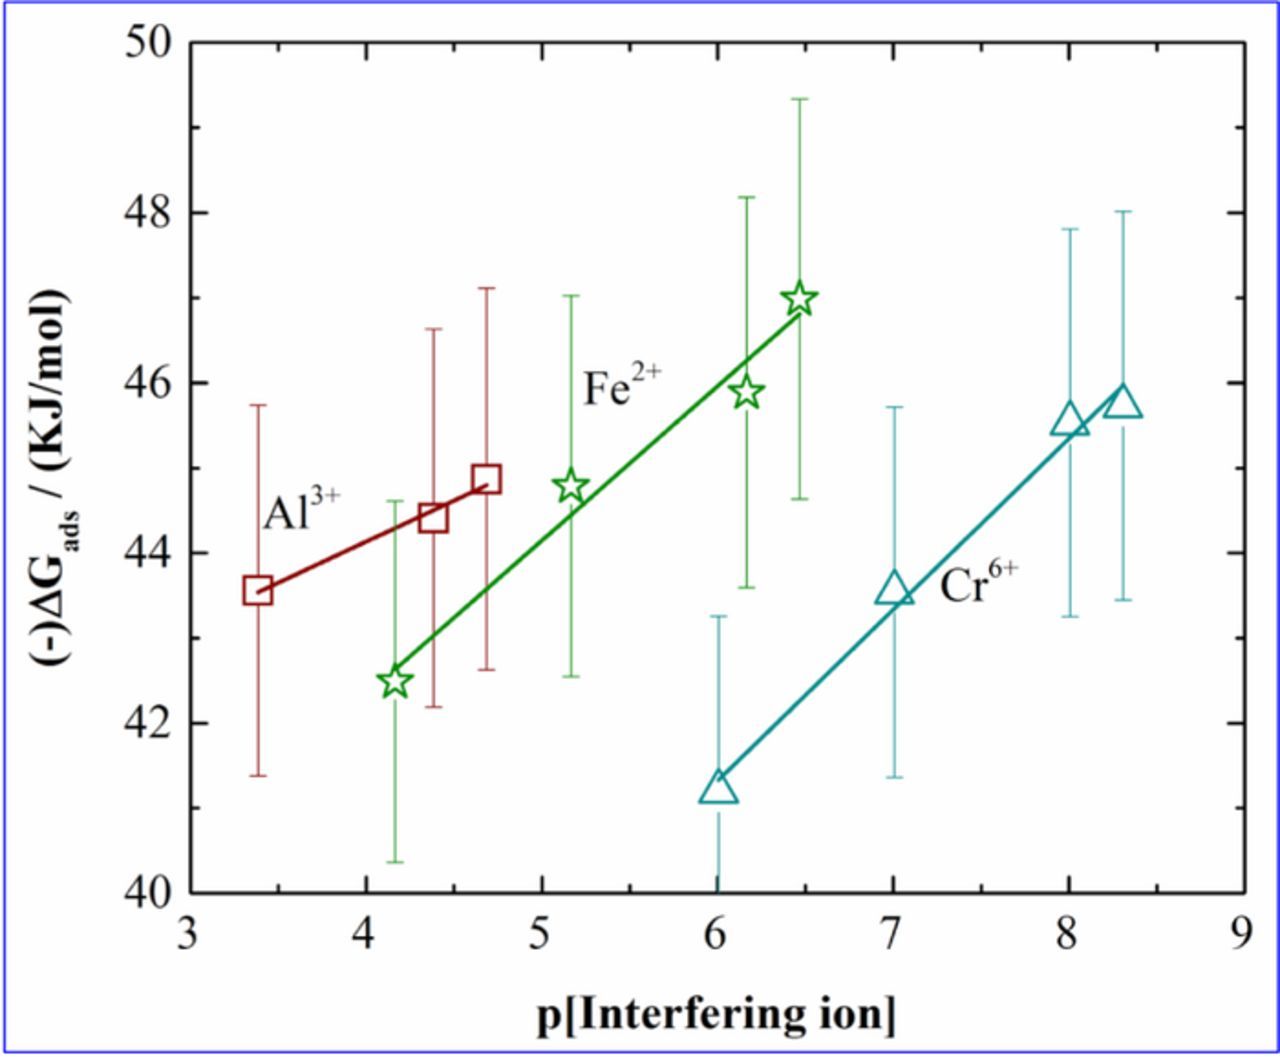
Figure 7. Plots of −ΔGads for cadmium vs p[Interfering ion].
Due to the strong competition from Cr6+ the slope is highest for this ion which decreases as the impact of the competition decreases. Therefore, the slope of Al3+ is the lowest among all the three ions. The slopes (κ-ΔGads) were evaluated from the plots. The values of κ-ΔGads are 0.967, 1.805, 2.012 in presence of Al3+, Fe2+ and Cr6+ respectively. Higher the slope (κ-ΔGads) in presence of a certain interfering ion, higher is the extent of hindrance in interaction process of IDA-cadmium reaction by that interfering ion. As mentioned earlier, during cadmium sensing process, first the analytes are allowed to adsorb onto the surface and then they are stripped out raising a current peak in the current voltage profile. Therefore, in presence of interfering ions, the adsorption process will be hindered. This will strongly affect the interaction of cadmium and sensing surface. The κ-ΔGads values obtained indicates that the competition of Al3+ to that of cadmium ion is less and the competition is maximum in presence of Cr6+.
Correlation based on the PR technique, BW technique and adsorption phenomena
From the above analysis it can be understood that the increase in the concentration of the interferant toward cadmium sensing resulted in decrease in sensitivity, decrease in −ΔGads and increase in barrier width. In our previous work, we developed a scale of interference based on the ChR and 100 ppb of interfering ion concentration with 100 ppb of cadmium ion. Although the scale developed in our work is enough to explain the interference behavior in well-defined manner, still, in order to understand underlying mechanism, competition for adsorption should be accounted as it describes nature of adsorption and the affinity of the electrode surface toward cadmium ion.
From Construction of calibration plots and analysis of the sensitivity values and Establishment of barrier width plots and its sensitivity analysis sections, it is obvious that the behavior of the calibration plots from the PR technique is opposite to that obtained by the BW technique for a specific condition. In order to correlate the adsorption phenomena, −ΔGads values were correlated with the SPR and SBW values for respective conditions. Rigorous calculations have been performed and the following correlation coefficient ɛ (Å1/2mA− 2p[Cd]2 [KJ/mol]− 2 ) has been developed, where
![Equation ([3])](https://content.cld.iop.org/journals/1945-7111/165/13/B644/revision1/d0001.gif)
This correlation constant ɛ signifies that the barrier width increases with increase in interference thereby decrease in sensitivity as well as feasibility of the process. It has been observed that ɛ varies from 0.00015 to 0.0002 for Al3+; from 0.00015 to 0.001 for Fe2+; from 0.00015 to 0.00755 for Cr6+. Figure 8 shows the schematic of the resolution scale of interference behavior.
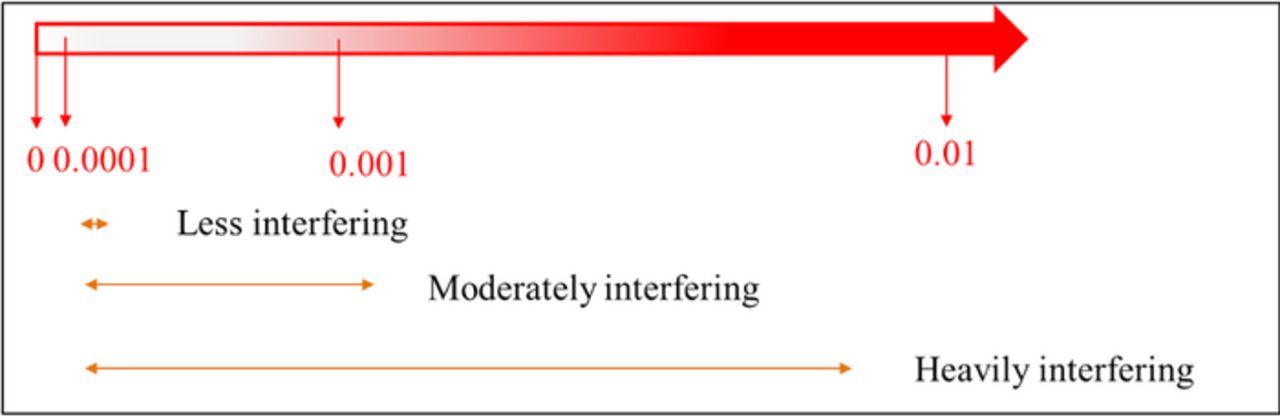
Figure 8. The scale of interference based on SPR from the PR technique, SBW from the BW technique and −ΔGads from the adsorption phenomena.
In order to obtain the resolution, the highest (εH) and the lowest (εL) values of ɛ have been extracted and the ratio R is calculated from Equation 4
![Equation ([4])](https://content.cld.iop.org/journals/1945-7111/165/13/B644/revision1/d0002.gif)
ɛH signifies the highest value obtained by this procedure for the case of an interfering ion and ɛL signifies the lowest value. The values of R for the interfering ions are shown in Table II, and it is seen that the value for Cr6+ is ∼37 times and that for Fe2+ is ∼5 times that of Al3+. The values of εH, εL and R are listed in Table II.
Table II. Correlations showing interference behavior based on cadmium concentration.
| Interfering ion | ɛL (lowest) (Å1/2mA− 2p[Cd]2 [KJ/mol]− 2) | ɛH (highest) (Å1/2mA− 2p[Cd]2 [KJ/mol]− 2) |  |
|---|---|---|---|
| Al3+ | 0.000151 | 0.00021 |  |
| Fe2+ | 0.000155 | 0.001043 |  |
| Cr6+ | 0.000154 | 0.00755 |  |
It can be observed from the correlation obtained from our work that if only the PR technique is considered the RPR for Al3+, Fe2+ and Cr6+ was 1.38, 3.04, 7.81 respectively as mentioned in Table I. The R value for Al3+ is similar as that of RPR. It shows 6.74 for Fe2+, twice that of RPR and 49.07 for Cr6+, more than six times that of RPR. It is observed that the new scale shows very high resolution as compared to the scale developed based on BW ratio as mentioned in an earlier work.12 Therefore, the scale built based on ɛ, is having higher resolution as compared to that build based individually on the PR technique and BW technique. This higher resolution scale will be helpful in device implementation. Although it is needed to perform a series of experiments in order to achieve a higher resolution scale for interference studies, still this will help to improve a device performance. The correlation coefficient ɛ is established based on the parameters varying with respect to different cadmium concentration. The resolution scale is based on the experimental condition and system depended parameters. Similar achievements can be obtained for different system based on sensing mechanism. The values might not match but should show similar pattern with consistent behavior.
Conclusions
The objectives of this work were to benchmark the BW technique with the PR technique, and to analyze the interference effect based on the PR technique, BW technique and adsorption process. Toward this, the interference effects of various ions were studied based on the concentration of the target analyte Cd2+, spanning two orders of magnitude and based on the concentration of the interfering ions - Al3+ (less interfering ions), Fe2+ (moderately interfering ion) and Cr6+ (heavily interfering ion), spanning two orders of magnitude. SWV experiments were performed to detect Cd2+ at varying concentrations in presence of different concentrations of the interfering ions. For each of the cases, calibration plots were established and sensitivity values (SPR) were calculated and the plots of SPR vs p[Interfering ion] were obtained to yield slopes termed as κPR. In order to standardize the BW technique, barrier width values were calculated for each case and the calibration plots of barrier widths vs p[Cd] gave slopes (SBW) which in turn were plotted against p[Interfering ion] to yield slopes termed as κBW. The calibration plots from PR technique as well as BW technique showed similar trends. Both the κPR and κBW values showed the lowest for Al3+ and the highest for Cr6+, thus benchmarking the BW technique. To gain more fundamental aspect underlying the interference effect, Langmuir adsorption isotherms were constructed for each of the cases and −ΔGads values were calculated. We have successfully developed a correlation constant (ɛ) describing the impact of interference which incorporates PR technique, BW technique and adsorption phenomenon. This scale showed a very higher resolution compared to the scale obtained individually from the PR technique or the BW technique.
Acknowledgments
Funding from the Ministry of Electronics and Information Technology, grant number 2(4)/2014-PEGD (IPIIW), Government of India, is acknowledged.
ORCID
Siddhartha Panda 0000-0001-9131-4264