Abstract
Detailed new results are reported on the preparation and giant magnetoresistance (GMR) of electrodeposited Co-Fe/Cu multilayer films by using four different baths (sulfamate, sulfate, ammonium chloride and sodium citrate type solutions). Two-pulse plating was applied for Co-Fe(5nm)/Cu(5nm) multilayer preparation by using galvanostatic pulses for the deposition of the magnetic layer. The Cu layer deposition potential was electrochemically optimized for each bath formulation by analyzing the current transients during the deposition of the non-magnetic layers. The optimal Cu deposition potential was found to be dependent both on the bath formulation and the Fe2+/Co2+ ion concentration ratio. The results of X-ray diffraction (XRD) measurements were in agreement with the composition of the samples. At low Fe content (about 10 at.% Fe) in the magnetic layer, an fcc structure was formed (in some cases, even multilayer satellites were observed). In samples with high Fe content (about 33 at.% Fe) in the magnetic layer, both fcc and bcc phases were present. A GMR behavior was observed for all multilayers, with a maximum GMR of about 4% in some cases. For multilayers from the sulfamate, sulfate and chloride baths, the GMR exhibited a multilayer-type behavior whereas the GMR of samples from the citrate bath was rather similar to the behavior of granular magnetic alloys containing also superparamagnetic regions.
Export citation and abstract BibTeX RIS

This is an open access article distributed under the terms of the Creative Commons Attribution Non-Commercial No Derivatives 4.0 License (CC BY-NC-ND, http://creativecommons.org/licenses/by-nc-nd/4.0/), which permits non-commercial reuse, distribution, and reproduction in any medium, provided the original work is not changed in any way and is properly cited. For permission for commercial reuse, please email: oa@electrochem.org.
Sputtered Co-Fe/Cu multilayers have been intensively investigated since they were shown to exhibit a fairly large giant magnetoresistance (GMR) effect, especially for Co-rich magnetic layers.1–7 Since Co-Fe/Cu multilayers can be produced also by electrodeposition, there have been a lot of efforts in studying the GMR of electrodeposited Co-Fe/Cu multilayers.8–17 However, relatively little amount of information is available about the optimization of the electrochemical parameters and the properties of the multilayers prepared under optimized conditions.
The optimization mainly refers to finding the specific Cu layer deposition potential at which neither the dissolution of the magnetic layer during the Cu deposition pulse, nor the codeposition of the magnetic elements in the non-magnetic layer (Cu) can occur.18,19 This also ensures that the actual layer thicknesses will be equal to the nominal ones calculated on the basis of Faraday's law. Therefore, in order to study the GMR magnitude as a function of the thickness of either the magnetic or the non-magnetic layers, and to establish if there is an oscillatory behavior of the GMR as a function of the non-magnetic layer thickness in electrodeposited multilayers, a phenomenon well observed in physically deposited multilayers, the electrochemically optimized Cu layer deposition potential should be applied. It could be shown, e.g., that electrodeposited Co/Cu multilayers produced with an optimized Cu deposition potential do not exhibit an oscillatory GMR behavior.20
As to the electrodeposited Co-Fe/Cu multilayers, we have carried out recently11 an electrochemical optimization of the Cu deposition potential by using a sulfamate type bath and investigated the structure and GMR of these multilayers for various Fe-contents in the magnetic layer. The Fe-content of the magnetic layer was varied by using deposition baths with different Fe2+ ion concentrations. In this previous work on electrodeposited Co-Fe/Cu multilayers, the optimum Cu deposition potential was found to be dependent on the ionic ratio of the magnetic components in the bath, becoming more negative for higher Fe2+ ion concentrations. By using X-ray diffraction (XRD), several of the Co-Fe/Cu multilayers were found to exhibit satellite reflections revealing a fairly good coherent stacking of the bilayers. At appropriate layer thicknesses, a clear GMR effect up to about 5% could be observed which was also dependent on the Fe-content in the magnetic layers.
In view of our interest for producing Co-Fe/Cu multilayered nanowires by electrodeposition, it was decided to carry out first a detailed investigation on electrodeposited Co-Fe/Cu multilayer films produced from several bath formulations in order to assess how the bath composition influences the GMR behavior for multilayers prepared with the electrochemically optimized Cu deposition potential. In this sense, the present work is a continuation of our previous study11 in which a sulfamate type bath (pH = 3.25) was used and here we extend these studies also to new bath formulations by using sulfamate and/or sulfate salts as the source of Co2+ and Cu2+ ions as well as sodium citrate and/or ammonium chloride as further components.
In our previous work,11 we used FeSO4 as the source of Fe2+ ions; the problems associated with the presence of Fe2+ ions in the electrodeposition bath were discussed there at some length and the occurrence of precipitates was avoided by adding the FeSO4 component to the bath only immediately before the start of the electrodeposition experiments. In the present study, a different approach has been taken in that Mohr's salt (Fe(NH4)2(SO4)2) was used instead of FeSO4. The advantage of Mohr's salt lies in the fact that according to our experience, for the Fe2+ ion concentration range used here, it is more resistant to oxidation and has good stability. For each bath formulation and Fe2+ ion concentration, first the electrochemical optimization of the Cu deposition potential18,19 was performed. This optimization included detailed cyclic voltammetry measurements to reveal the electrochemical characteristics of the specific electrolyte under study and chronoamperometric measurements during the Cu layer deposition in order to find the ideal Cu deposition potential.
Energy dispersive X-ray spectroscopy (EDS) was used to analyze the overall chemical composition of the deposits. XRD studies were carried out to reveal the phases formed and the structural quality of the samples, especially the presence of multilayer satellites which can appear as an indication for a coherent growth of the bilayers on each other. The room-temperature magnetoresistance curves (resistivity vs. magnetic field) were measured to characterize the GMR behavior of the multilayers.
Experimental
Electrolytes for Co-Fe/Cu multilayer deposition
For multilayer deposition, two-pulse plating from a single-bath was applied, i.e., the salts of all metals to be deposited were present in a single electrolyte. For each bath formulation investigated, the same preparation procedure was applied.
To get rid of the effect of precipitates appearing in the solution with time due to the formation of ferric ions and their hydrolysis, a single iron-free stock solution was used for each major bath types. The Mohr's salt was only added immediately before the electrodeposition experiments. The resulting electrolyte will be denoted by the relative Fe2+ ion concentration cion,Fe in the bath which was defined by the ionic ratio Fe2+/[Fe2+ + Co2+]. Two different Fe2+ ion concentrations were used (5 and 20 mol%, as defined above). The composition of the two stock solutions for the four bath formulations are summarized in Table I. Cyclic voltammetric measurements performed for the test of the baths were carried out with Pt sheet working electrodes in the same cell that was used for the multilayer preparation.
Table I. Composition and pH of the four different baths used in the present study. The concentrations 0.04 and 0.175 mol/L for the Mohr's salt correspond to cion,Fe = 5 and 20 mol%, respectively, for the Fe2+/[Co2+ + Fe2+] ionic ratio.
| Bath type | pH | Components | c (mol/L) |
|---|---|---|---|
| sulfamate | 3.6 | CoSO4 | 0.7 |
| (NH4)2Fe(SO4)2·6H2O | 0.04 or 0.175 | ||
| (NH4)2SO4 | 0.14 | ||
| CuSO4 | 0.01 | ||
| H3BO3 | 0.25 | ||
| H6N2O3S | 0.25 | ||
| sulfate | 2.8 | CoSO4 | 0.7 |
| (NH4)2Fe(SO4)2·6H2O | 0.04 or 0.175 | ||
| (NH4)2SO4 | 0.14 | ||
| CuSO4 | 0.01 | ||
| H3BO3 | 0.25 | ||
| chloride | 3.2 | CoSO4 | 0.7 |
| (NH4)2Fe(SO4)2·6H2O | 0.04 or 0.175 | ||
| NH4Cl | 0.14 | ||
| CuSO4 | 0.01 | ||
| H3BO3 | 0.25 | ||
| citrate | 5.6 | CoSO4 | 0.7 |
| (NH4)2Fe(SO4)2·6H2O | 0.04 or 0.175 | ||
| CuSO4 | 0.01 | ||
| H3BO3 | 0.25 | ||
| C5H5Na3O7·2H2O | 0.2 |
Co-Fe/Cu multilayer preparation and characterization
The Co-Fe/Cu multilayers were deposited on a [100]-oriented, 0.26 mm thick silicon wafer covered with a 5 nm thick Cr and a 20 nm thick Cu layer, both made by evaporation. The purpose of the chromium layer was to assure adhesion whereas the Cu layer ensured a good electrical conductivity of the cathode surface. The deposition was performed in a tubular cell of 8 mm × 20 mm cross section with an upward-facing cathode at the bottom of the cell.21,22 The galvanostatic-potentiostatic (G/P) pulse combination19,21 was used to deposit the multilayered samples. For the deposition of the magnetic layer, galvanostatic (G) mode was used with two different current densities (−20.7 mA/cm2 and −34.5 mA/cm2). For the Cu-layer, potentiostatic (P) mode was used. The potential was measured and will be referred to hereinafter with respect to a saturated calomel electrode (SCE). By varying the deposition time in the G mode, the magnetic layer thickness could be set to a predetermined value. For controlling the thickness of the Cu layer, the charge flowing through the system was measured during the P pulse. Then, one can calculate the charge necessary to get the preset nominal layer thickness from Faraday's law by assuming 100% current efficiency.
The current efficiency of Cu deposition at the optimized potential can be taken as 100% since hydrogen evolution is negligible here. Furthermore, recent detailed XRD studies23,24 demonstrated that for electrodeposited Co/Cu multilayers prepared with optimized Cu deposition potential, both the magnetic and the non-magnetic layers have actual layer thicknesses within about 10% of the preset nominal values obtained from Faraday's law with 100% current efficiency. Since we have to deal here with the Co-Fe-Cu system electrodeposited from various bath formulations, we have carried out a direct measurement of the current efficiencies for the magnetic layers. For this purpose, from each bath formulation at both Fe2+ ion concentrations and at both current densities used for magnetic layer deposition in the multilayers, we prepared d.c. plated deposits and by weighing the substrates before deposition and after deposition together with the deposits, we determined the current efficiency by using an average molar mass for the Co-Fe deposit. This analysis yielded current efficiencies in most cases within about 5% of the ideal current efficiency (100%), the few larger deviations coming certainly from random errors. Therefore, in all our multilayers we can expect that the actual layer thicknesses correspond well to the nominal preset values for both kinds of constituent layers.
Several sample series were produced with the common goal of investigating the effect of both the Fe/Co ratio in the magnetic layer and the bath formulation on the magnetotransport properties of the samples. The nominal layer thicknesses were fixed at dFeCo = 5 nm and dCu = 5 nm with a total multilayer thickness of 1000 nm. We have used here fixed thicknesses for both the magnetic and non-magnetic layers since the major goal was a comparative study of the effect of various bath formulations on structure and GMR. The actual values of the layer thicknesses were chosen since in our previous study of electrodeposited Co-Fe/Cu multilayers,11 the GMR maximum was found to be around dCu = 5 nm and in multilayered nanowires usually even higher layer thicknesses have been used for the magnetic layers than in multilayer films. Furthermore, we have demonstrated recently25 that a very regular layered structure can form in electrodeposited Ni-Co(5nm)/Cu(5nm) multilayered nanowires fabricated with an electrochemically optimized Cu deposition potential.
The overall multilayer composition was determined in a TESCAN MIRA3 scanning electron microscope (SEM) equipped with an EDAX Element EDS analyzer. The typical maximum error for compositional analysis of metallic elements in alloys is about 2 at.%.
The structure of the Co-Fe/Cu multilayers was studied by XRD, using a Philips X'pert powder diffractometer with CuKα radiation (wavelength: λ = 0.15418 nm), Bragg-Brentano geometry and a secondary graphite monochromator. The applied voltage and current were 40 kV and 30 mA, respectively. The step size in the measurement of the diffraction angle (2θ) was 0.02°. The lattice constants of the different phases were determined from the peak positions (peak 111 for the fcc phase and peak 110 for the bcc phase) using the Bragg equation. For the samples with high Fe content where both fcc and bcc phases were present, the 111 and 110 peaks of the two phases strongly overlapped. Therefore, the peak positions of the individual phases were obtained by fitting two Lorentzian functions on the overlapping XRD profiles. For some samples with an fcc structure, faint shoulders appeared on both sides of the main 111 Bragg reflection which seemed to correspond to multilayer satellites. However, due to the relatively large multilayer periodicity (Λnom = 10 nm), the satellite peaks strongly overlapped with the main peak that itself was also broadened due to various reasons. Therefore, in these cases the main and satellite peaks were separated by fitting three Lorentzian functions on the profile consisting of the main fcc 111 peak and the two satellite reflections. The multilayer periodicity (Λ) was obtained from the Bragg angles of the two satellite peaks (2θs1 and 2θs2) around the reflection 111 of the fcc phase using the following equation: Λ = λ/[sinθs1 – sinθs2].
Measurement of electrical transport properties
The magnetotransport parameters were determined at room temperature by using four-point-in-line probes. To obtain the magnetoresistance (MR), the resistance was measured as a function of the external magnetic field (H) up to 9 kOe. The MR ratio was defined with the formula MR(H) = [R(H) - R0 ]/R0 where R0 is the resistance maximum of the sample in a magnetic field close to zero and R(H) is the resistance in an external magnetic field H. The magnetoresistance data were determined in the field-in-plane/current-in-plane geometry in both the longitudinal (LMR, magnetic field parallel to the current) and the transverse (TMR, field perpendicular to the current) configurations. If one takes the difference between the longitudinal and the transverse component, the anisotropic magnetoresistance can be obtained: AMR = LMR – TMR.
The measured MR(H) curves were decomposed according to a procedure described previously26 in order to establish the ferromagnetic (GMRFM) and superparamagnetic (GMRSPM) contributions to the GMR. In this process, a Langevin function is fitted to the high-field section of the MR(H) curves (beyond the saturation of the FM regions, typically above about 2–3 kOe) which yielded the parameters of the GMRSPM contribution and, then, this term was subtracted from the experimental data which procedure provided us the FM contribution to the magnetoresistance. In most cases, a linear term should also be considered in the fitting procedure which accounted for the nearly linearly decreasing resistivity of a ferromagnet with increasing magnetic field at finite temperatures.27,28
Electrochemical Studies for Co-Fe/Cu Multilayer Deposition
Electrochemical characterization of the electrolyte solutions
For multilayer deposition with reliable layer thicknesses, the electrochemically optimized Cu deposition potential EECCu has to be established18 where neither the dissolution of the magnetic layer nor the codeposition of either of the magnetic metals can take place during the Cu deposition pulse.
In order to obtain preliminary information for the optimization of the Cu deposition potential, the polarization curves of the stock solutions without Fe2+ ions and with two different Fe2+ ion concentrations were measured for each bath formulation investigated (see Fig. 1).
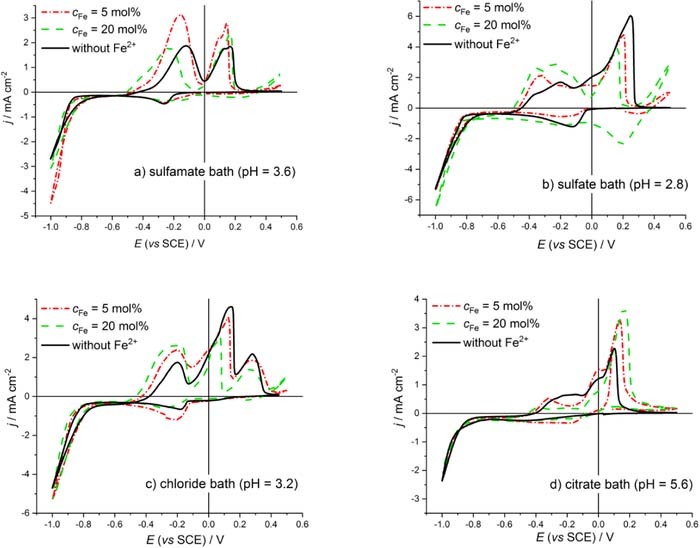
Figure 1. Cyclic voltammetry curves recorded with 10 mV·s−1 sweep rate for all baths investigated without Fe2+ ions and with two different Fe2+ ion concentrations.
An inspection of the cyclic voltammetry curves of the two Fe-containing solutions shown in Fig. 1 suggests that EECCushould lie somewhere in the potential range of the extended plateau since the optimal potential, at which neither a dissolution of the previously deposited magnetic material, nor a codeposition of the magnetic atoms with Cu will occur, can be expected only in this range. However, this is still a wide potential window; therefore, the final optimization can only be carried out on the basis of the current transient studies.18,21 It is also apparent from the curves in Fig. 1 that the onset of the dissolution of the magnetic layer is shifted toward negative potentials for all bath types studied as the Fe2+ concentration in the solution increases, and, in parallel, the initial anodic current gets larger. This is related to the facts that the onset potential of the alloy dissolution shifts to the negative direction with the increase of the solution Fe content and the density of defects on the Cu layer growing on the Fe-containing Co layer increases.
Optimization of the Cu deposition potential: current transient study
To determine the exact value of EECCu, the current transients have to be measured over the plateau region of the CV curve.18 The potential value at which the current transient curve decays the fastest without the appearance of a current more negative than the current value specific for the Cu deposition with constant rate (diffusion-limited current) corresponds to the optimum EECCu value. Similarly as in our previous study,11 the potential ranges determined from the polarization curves for mapping out the current transients were chosen for all baths as follows: −0.760 V to −0.520 V for the solution with cion,Fe = 5% and −0.700 V to −0.600 V for cion,Fe = 20 %. The current transients measured for all baths studied here with either low or high Fe2+ ion concentration were very similar to those reported in our previous work.11 The present EECCu values determined from the current transients are collected in Table II for all investigated baths.
Table II. Dependence of EECCu on bath formulation and Fe2+ ion concentration.
| bath | pH | EECCu (V) (cion,Fe = 5 mol%) | EECCu (V) (cion,Fe = 20 mol%) | source |
|---|---|---|---|---|
| sulfamate | 3.25 | −0.585 | −0.652 | 11 |
| sulfamate | 3.6 | −0.585 | −0.652 | this work |
| sulfate | 2.8 | −0.585 | −0.652 | this work |
| chloride | 3.2 | −0.640 | −0.680 | this work |
| citrate | 5.6 | −0.740 | −0.780 | this work |
According to the above results (Table II), it is found for the Co-Fe-Cu system that the value of EECCu depends on the bath formulation. Additionally, for a given bath formulation, it also depends on the relative concentration of Fe2+ ions in the solution. This comes from the circumstance that Fe (or a Fe-Co alloy) starts to dissolve from the cathode surface at a more negative potential than Co. Because of this difference, if both Fe and Co metals are simultaneously present on the surface with different ratios, the potential value at which the given alloy is neither deposited nor dissolved back into the electrolyte will also depend on the ratio of Fe and Co in the alloy. A further technical problem arises because only the total current flowing through the surface can be measured. Even if the total current is zero, it is possible that Fe is dissolved selectively and, in parallel, Co is deposited at the same rate. However, both the dissolution and the deposition are slow enough for the magnetic layer to be covered with Cu without significant change in the magnetic layer thickness.
The observed variation of EECCu with cion,Fe, i.e., that EECCu is more negative for higher cion,Fe, is in agreement with the results of our previous study on the Co-Fe/Cu system11 and this observation is valid for all four bath formulations.
Compositional Analysis of the Co-Fe/Cu Multilayers by EDS
A summary of the sample preparation parameters and the EDS analysis results is given in Table III. Based on the EDS analysis results for the Co-Fe/Cu multilayers, the relative concentrations Fe/(Co+Fe) and (Co+Fe)/(Cu+Co+Fe) are displayed in Fig. 2. We can see that the Fe content in the magnetic layer with respect to the total magnetic element concentration (open triangles) is around 10 at.% (i.e., the magnetic layer composition is about Co90Fe10) at both current densities applied when the Fe2+ ion concentration is low (5 mol%) and it is around 33 at.% (i.e., about Co67Fe33) when the Fe2+ ion concentration is high (20 mol%). The magnetic layer composition data show a fairly good agreement with our previous results11 according to which for the sulfamate bath with pH = 3.25, the Fe content in the magnetic layer was found to be 10 and 35 at.% for 5 and 20 mol% Fe2+ ion concentrations, respectively.
Table III. Deposition parameters (bath type, pH, relative Fe ion concentration cion,Fe and magnetic layer deposition current density jmagn) used for the preparation of Co-Fe(5nm)/Cu(5nm) multilayer samples and the results of overall compositional analysis obtained by EDS.
| Bath type | Sample | cion,Fe (mol%) | jmagn (mA/cm2) | Cu (at.%) | Co (at.%) | Fe (at.%) |
|---|---|---|---|---|---|---|
| Sulfamate (pH = 3.6) | 1 | 5 | −20.7 | 56.5 | 38.7 | 4.8 |
| 2 | 5 | −34.5 | 45.1 | 48.7 | 6.2 | |
| 3 | 20 | −20.7 | 55.3 | 29.7 | 15.1 | |
| 4 | 20 | −34.5 | 49.9 | 32.7 | 17.5 | |
| Sulfate (pH = 2.8) | 5 | 5 | −20.7 | 61.4 | 33.8 | 4.8 |
| 6 | 5 | −34.5 | 39.2 | 53.8 | 7.1 | |
| 7 | 20 | −20.7 | 49.9 | 33.2 | 17.0 | |
| 8 | 20 | −34.5 | 53.1 | 30.2 | 16.8 | |
| Chloride (pH = 3.2) | 9 | 5 | −20.7 | 43.8 | 50.2 | 6.0 |
| 10 | 5 | −34.5 | 48.1 | 46.8 | 5.1 | |
| 11 | 20 | −20.7 | 39.5 | 41.7 | 18.8 | |
| 12 | 20 | −34.5 | 47.5 | 36.7 | 15.8 | |
| Citrate (pH = 5.6) | 13 | 5 | −20.7 | 42.3 | 51.8 | 6.0 |
| 14 | 5 | −34.5 | 47.8 | 46.8 | 5.4 | |
| 15 | 20 | −20.7 | 44.4 | 39.2 | 16.4 | |
| 16 | 20 | −34.5 | 42.9 | 39.0 | 18.1 |
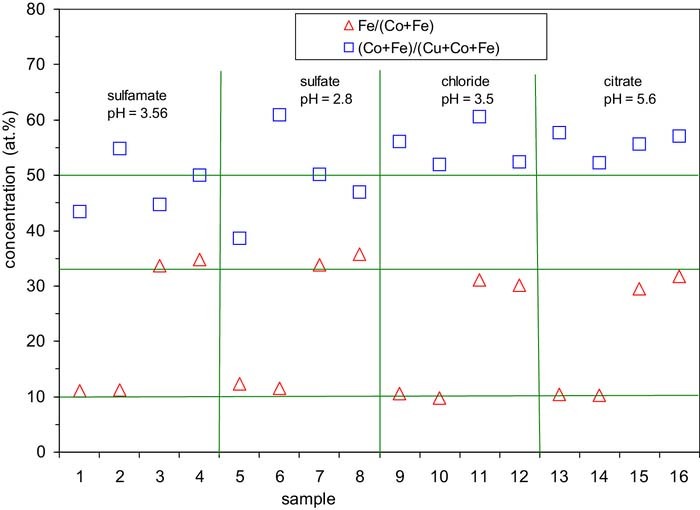
Figure 2. Concentration analysis results on the electrodeposited Co-Fe/Cu multilayers. The horizontal grid lines at 10 and 33 at.% indicate the approximate average concentration of Fe in the magnetic layer for multilayers deposited from baths with cion,Fe = 5 and 20 mol%, respectively. The horizontal grid line at 50 at.% indicates the expected overall concentration of the magnetic components, (Co+Fe)/(Cu+Co+Fe), in the multilayer on the basis of the equal nominal thickness (5 nm) of both kinds of layer. The vertical grid lines separate the samples produced from the various baths used. For sample identification and preparation conditions, see Table III.
In the above discussion, we have neglected the unavoidable presence of a small amount of Cu in the magnetic layers. In our previous work,11 it was estimated that the magnetic layers may contain about 1.5 at.% Cu. We can carry out the same type of estimate also here on the basis of the ratio of the Cu limiting current density and the magnetic layer deposition current density. According to Fig. 1, we can take about jlim,Cu = 0.5 mA/cm2 for all baths investigated here. For the applied current densities of the magnetic layer deposition pulse, we obtain about 2.5 at.% for samples with jmagn = –20.7 mA/cm2 and 1.5 at.% Cu for jmagn = –34.5 mA/cm2.
The insensitivity of the ratio of the magnetic elements to the deposition current density at a fixed layer thickness is well known from the Ni-Co/Cu system. As it can be seen in Fig. 3 of Ref. 22, the Co/(Ni+Co) ratio varies with the bath composition but the deposition current density has no impact on the ratio of the magnetic elements. The present Fe-Co/Cu samples show essentially the same trend. The explanation is that the rate of the depletion of the preferentially deposited element and the change in the deposition time as the current density is varied just cancel the impact of each other for the entire layer (while the metal ratio may vary within the layer along the growth direction).
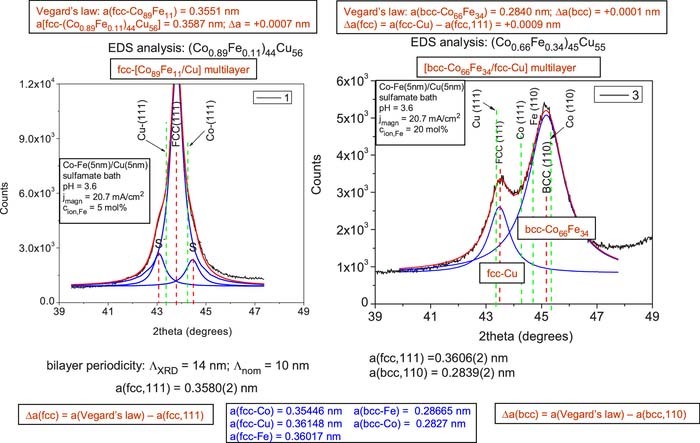
Figure 3. XRD patterns for Co-Fe(5nm)/Cu(5nm) multilayers prepared from a sulfamate bath (pH = 3.6) with jmagn = 20.7 mA/cm2 from baths with cion,Fe = 5 mol% (sample 1, left panel) and with cion,Fe = 20 mol% (sample 3, right panel). The vertical red dashed lines indicate the peak position of the fcc(111) and bcc(110) main multilayer Bragg reflections as well as the decomposed satellite reflections labeled by S- and S+ for sample 1 (left panel). The green dashed lines indicate the position of the (111) lines of fcc-Cu and fcc-Co (both panels) as well as the position of the (110) lines of bcc-Fe and bcc-Co (right panel only).
Another issue in Fig. 2 is the ratio of the magnetic and non-magnetic elements in the Co-Fe(5 nm)/Cu(5 nm) multilayers which is displayed by the open squares. The magnetic element (Co+Fe) concentration data are scattered around about 50 at.% and this corresponds to the fact that the nominal thicknesses of the magnetic and non-magnetic layers are equal (both being 5 nm). The observed large scatter (larger than the specified maximum typical error of metallic element determination by EDS) for some samples is in agreement with our previous experience in some cases that the Co to Cu ratio in metallic alloys cannot always be reliably established with a sufficient accuracy for yet unknown reasons.
Structural Studies of the Co-Fe/Cu Multilayers by XRD
In order to investigate the crystalline phases and the microstructure formed from the various baths, XRD studies have been carried out for the electrodeposited Co-Fe(5nm)/Cu(5nm) multilayers. We will discuss the XRD results grouped according to samples deposited from a given bath. For sample identification and compositional data, we refer to Table III and Fig. 2. Above each displayed XRD pattern, we will specify also the deposit composition since it greatly helps the analysis and interpretation of the XRD results. It should be noticed in advance that the applied magnetic layer deposition current density did not influence noticeably either the deposit composition or the XRD pattern which implies that very similar microstructures were formed for both current densities from a given bath. A common feature of the XRD results was that for each bath formulation, a single fcc phase was only detected for the samples with the lower Fe2+ ion concentration (cion,Fe = 5 mol%) resulting in an approximate composition of Co90Fe10 in the magnetic layer. On the other hand, for samples prepared from baths with the higher Fe2+ ion concentration (cion,Fe = 20 mol%) resulting in an approximate composition of Co67Fe33 in the magnetic layer, both an fcc and a bcc phase could be identified in the measured XRD patterns.
Therefore, for each bath formulation, we present the XRD results by showing together a pair of samples at a given magnetic layer deposition current density prepared from baths with both the lower and the higher Fe2+ ion concentrations. It is noted that the structures of the different phases were determined from the full diffraction patterns taken in the diffraction angle range between 30° and 90° and not only from the parts plotted in the figures of this paper.
Although we will always specify the samples as multilayers (as they were intended to be fabricated), the final judgment about whether actually either a real layered structure or just a nanoscale mixture of a magnetic and a non-magnetic phase was formed can often be made only after evaluating the magnetoresistance results in the next section.
Co-Fe/Cu multilayers from the sulfamate bath
The XRD patterns for the two multilayer samples deposited from the sulfate bath at the lower current density value (jmagn = –20.7 mA/cm2) are shown in Fig. 3 (left panel: sample 1, cion,Fe = 5 mol%; right panel: sample 3, cion,Fe = 20 mol%). According to the left panel, satellite reflections were observed for sample 1. A qualitatively very similar XRD pattern was obtained also on sample 2 deposited with jmagn = –34.5 mA/cm2. The appearance of multilayer satellite reflections requires that the amplitudes of the reflected X-rays are added sufficiently coherently29 which can only occur for a fairly periodic repetition of the bilayer stacks. Therefore, the results indicate that samples 1 and 2 exhibit a well-defined multilayered structure consisting of an alternating sequence of Co89Fe11 magnetic layers and pure Cu layers.
For sample 1 (left pattern in Fig. 3), the bilayer period deduced from the positions of the satellite reflections was ΛXRD = 14 nm (for sample 2, also ΛXRD = 14 nm was obtained). By considering that the nominal multilayer periodicity was Λnom = 10 nm, this means that the ΛXRD values exceed the nominal value by 40%. This result conforms qualitatively to our previous experience in that the repeat periods deduced from XRD for electrodeposited Co/Cu and Co-Fe/Cu multilayers11,23,24,30,31 was typically 10 to 30% higher than the nominal values.
According to Michaelsen,29 for a coherent multilayer with layer thicknesses corresponding to our ones, a single main XRD peak should appear the position of which is intermediate between the positions corresponding to the constituent bulk materials. We can see in Fig. 3 that this is well fulfilled for the Co-Fe/Cu multilayer sample 1 (and also for sample 2, not shown). It is implied, furthermore, by this result that the Co89Fe11 magnetic layer adopts an fcc structure as observed previously for Co-Fe with low Fe-content11 as well as for Co in Co/Cu multilayers.11,23,24,30,31 By considering the small energy difference between the hcp and fcc lattices, the formation of a metastable fcc-Co89Fe11 phase is possible since the equilibrium phase diagram of the Co-Fe system indicates the borderline between the fcc and bcc phases around this composition.32
From the peak position of the observed fcc(111) peak, we have calculated the fcc lattice parameters which are collected in Table IV. For the two multilayers with satellite reflections, we obtained a = 0.3580 nm (sample 1) and a = 0.3578 nm (sample 2). The standard lattice parameter for pure fcc-Cu is a = 0.36148 nm33 and for pure fcc-Co is a = 0.35446.33,34 Thus, we can see that the lattice parameters for both samples are between the pure Co and Cu values as it should be for a multilayer with layer thicknesses like in our case.29 We can make a more correct estimate for the expected multilayer lattice parameter by taking into account the composition analysis results and using Vegard's law with an fcc-Fe lattice parameter of a = 0.36017 nm.34 These estimates are given in the uppermost box above the XRD pattern for sample 1 in Fig. 3: first, we estimated the expected lattice parameter for the Co89Fe11 magnetic layer and, then, for a (Co-Fe)44Cu56 alloy corresponding to the analyzed overall multilayer composition. Comparing the multilayer lattice parameter estimated with the help of Vegard's law with the measured one, the agreement is very good for sample 1: Δa = +0.0007 nm (and even better for sample 2: Δa = +0.0002 nm). This feature and the clear satellites demonstrate that both samples 1 and 2 can be considered as exhibiting a fairly regular superlattice structure.
Table IV. Lattice parameters of the formed phases in the investigated electrodeposited Co-Fe(5nm)/Cu(5nm) multilayer samples. The accuracy of the lattice parameters determined from the fcc-111 and bcc-110 reflection positions is ±0.0002 nm.
| Single-phase deposits | Two-phase deposits | |||
|---|---|---|---|---|
| Bath type | Sample | fcc-[Co∼90Fe∼10/Cu] | fcc-Cu | bcc-Co∼67Fe∼33 |
| lattice parameter, a(fcc-111) [nm] | lattice parameter, a(fcc-111) [nm] | lattice parameter, a(bcc-110) [nm] | ||
| Sulfamate (pH = 3.6) | 1 | 0.3580 | ||
| 2 | 0.3578 | |||
| 3 | 0.3606 | 0.2839 | ||
| 4 | 0.3601 | 0.2838 | ||
| Sulfate (pH = 2.8) | 5 | 0.3583 | ||
| 6 | 0.3564 | |||
| 7 | 0.3583 | 0.2829 | ||
| 8 | 0.3584 | 0.2834 | ||
| Chloride (pH = 3.2) | 9 | not measured | ||
| 10 | 0.3580 | |||
| 11 | 0.3600 | 0.2844 | ||
| 12 | 0.3598 | 0.2842 | ||
| Citrate (pH = 5.6) | 13 | 0.3570 | ||
| 14 | 0.3571 | |||
| 15 | 0.3583 | 0.2836 | ||
| 16 | 0.3584 | 0.2843 | ||
The XRD pattern of sample 3 which was deposited from the sulfate bath with a higher Fe2+ ion concentration of 20 mol% is shown in the right panel of Fig. 3 (very similar results was obtained also for sample 4 deposited with the higher current density of jmagn −34.5 mA/cm2). We can observe that for a Co:Fe atomic ratio of about 2:1 in the magnetic layer, in addition to an fcc(111) peak between the fcc-Cu(111) and fcc-Co(111) positions, also a large bcc(110) peak appears, corresponding to the Co-Fe magnetic layer. Again using Vegard's law, we have estimated the lattice parameter of this bcc magnetic layer by using a bcc-Fe lattice parameter of a = 0.28665 nm33 and a bcc-Co lattice parameter of a = 0.2827 nm.35 The uppermost box above the XRD pattern in the right panel indicates a fairly good agreement of the estimated lattice parameter of the bcc Co-Fe alloy with the experimental value of the bcc-phase lattice parameter (deviation: Δa(bcc) = +0.0001 nm for sample 3; for sample 4: Δa(bcc) = +0.0003 nm. It is noted finally that the lattice parameter of the fcc-Cu phase is larger than the value of the bulk fcc-Cu phase (Δa(fcc) = +0.0009 nm, see uppermost box in the right panel of Fig. 3) and this indicates a significant stretching of the fcc-Cu regions in the two-phase deposit which may arise due to the matching of the lattice planes at the interfaces between the fcc and bcc crystallites. Interestingly, the difference Δa(bcc) = +0.0001 nm between the lattice parameters between the Vegard's law value and the experimental value of the bcc phase is much smaller which should mean that the stresses in the bcc regions are much smaller. This may be possible if the bcc phase has a lattice plane for matching with the fcc phase that is more conform to the joint lattice plane distances.
It is worth noting that the ratio of the amplitudes of the first XRD peaks of the fcc and bcc phases shown in this study does not reflect necessarily the volume ratio of the two phases since the intensity of the peaks are influenced by the texture, the multiplicity and the different chemical compositions of the two phases. The texture effect can be handled if the sum of the areas under the peaks in the whole diffractograms are used for the comparison. Indeed, for instance for sample 3 the ratio of the sums of the peak intensities for the fcc and bcc phases was 1.04, although the (110) peak for the bcc phase was much stronger than the reflection (111) for the fcc phase in Fig. 3.
Even if the fcc and bcc phases in samples 3 and 4 are present in the form of an alternating sequence of continuous fcc and bcc layers, we cannot expect the occurrence of satellite reflections since the layer thickness non-uniformities and the strong dilatation and/or compression at the interfaces between the two kinds of layer certainly destroy the coherency of the X-rays which would be the prerequisite for satellite reflections.29 Furthermore, according to the considerations of Michaelsen,29 we cannot decide from the present XRD results whether a bcc-[Co-Fe]/fcc-Cu layered structure was formed during deposition or the deposit consists of a random mixture of bcc-(Co-Fe) alloy and fcc-Cu grains.
Co-Fe/Cu multilayers from a sulfate bath
The XRD patterns for the two multilayer samples deposited from the sulfate bath at the lower current density value (jmagn = –20.7 mA/cm2) are shown in Fig. 4 (left panel: sample 5, cion,Fe = 5 mol%; right panel: sample 7, cion,Fe = 20 mol%). According to the left panel, satellite reflections were observed for sample 5. A qualitatively very similar XRD pattern was obtained also on sample 6 deposited with jmagn = –34.5 mA/cm2. Similarly to samples 1 and 2 deposited from the sulfamate bath, these results indicate that samples 5 and 6 exhibit a well-defined multilayered structure consisting of an alternating sequence of Co88Fe12 magnetic layers and pure Cu layers.
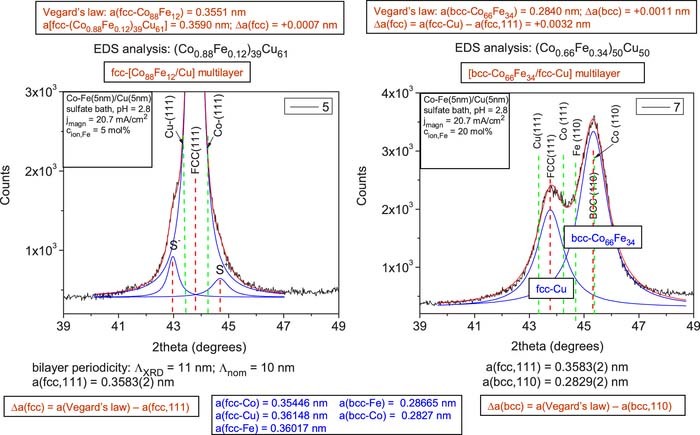
Figure 4. XRD patterns for Co-Fe(5nm)/Cu(5nm) multilayers prepared from a sulfate bath (pH = 2.8) with jmagn = 20.7 mA/cm2 from baths with cion,Fe = 5 mol% (sample 5, left panel) and with cion,Fe = 20 mol% (sample 7, right panel). The vertical red dashed lines indicate the peak position of the fcc(111) and bcc(110) main multilayer Bragg reflections as well as the decomposed satellite reflections labeled by S- and S+ for sample 5 (left panel). The green dashed lines indicate the position of the (111) lines of fcc-Cu and fcc-Co (both panels) as well as the position of the (110) lines of bcc-Fe and bcc-Co (right panel only).
For sample 5 (left pattern in Fig. 4), the bilayer period deduced from the positions of the satellite reflections was ΛXRD = 11 nm (for sample 6, it was ΛXRD = 13 nm). By considering that the nominal multilayer periodicity was Λnom = 10 nm, this means that the ΛXRD values exceed the nominal value by 10 and 30%, respectively, again in good agreement with our previous experience on the relation of the nominal and measured repeat periods of electrodeposited multilayers.11,23,24,30,31
We can see in Fig. 4 for the multilayer sample 5 (and also for sample 6, not shown) that a single main XRD peak appears the position of which is intermediate between the positions corresponding to the constituent fcc bulk materials. This implies again that the Co88Fe12 magnetic layer adopts an fcc structure.
From the peak position of the observed fcc(111) peak, we have calculated the fcc lattice parameters also for samples 5 and 6 produced from the sulfate bath and the results are given in Table IV. Comparing the multilayer lattice parameters estimated again with the help of Vegard's law with the measured ones, the agreement was surprisingly good for sample 5: Δa = +0.0007 nm (and very similar result was obtained for sample 6: Δa = +0.0012 nm). This feature and the clear satellites demonstrate that both samples 5 and 6 can also be considered as exhibiting a fairly regular superlattice structure.
The XRD pattern of sample 7 which was deposited from the sulfate bath with a higher Fe2+ ion concentration of 20 mol% is shown in the right panel of Fig. 4 (very similar results was obtained also for sample 8 deposited with the higher current density of jmagn = −34.5 mA/cm2). Again, similarly to the sulfamate bath samples with higher Fe-content, in addition to an fcc(111) peak between the fcc-Cu(111) and fcc-Co(111) positions, also a large bcc(110) peak appears, corresponding to the Co-Fe magnetic layer. The same analysis on the basis of Vegard's law was carried out also here as for sample 3 from the sulfamate bath and very similar conclusions could be drawn both qualitatively and quantitatively (see the uppermost boxes in the right panel of Fig. 4.
The absence of satellite reflections for samples 7 and 8 from sulfate bath can be explained in a similar fashion as was done for samples 3 and 4 from the sulfamate bath.
Co-Fe/Cu multilayers from the chloride bath
The XRD pattern of sample 10 deposited from the chloride bath with a low Fe2+ ion concentration of 5 mol% is shown in the left panel of Fig. 5. A single fcc (111) Bragg peak can be observed, indicating that the magnetic and non-magnetic regions in the deposit adopt a common fcc lattice, but no satellite reflections can be identified. Estimating again the lattice parameter of the deposit with the known composition by Vegard's law, we get a very good agreement with the experimental lattice parameter given in Table IV. In the absence of any satellite reflections, we cannot decide whether we have to deal here with either a layered structure consisting of alternating layers of fcc-Cu and fcc-Co90Fe10, both with a layer thickness of about 5 nm or nanoscale regions of these two phases are intermixed randomly since both arrangements would yield the same XRD pattern.29
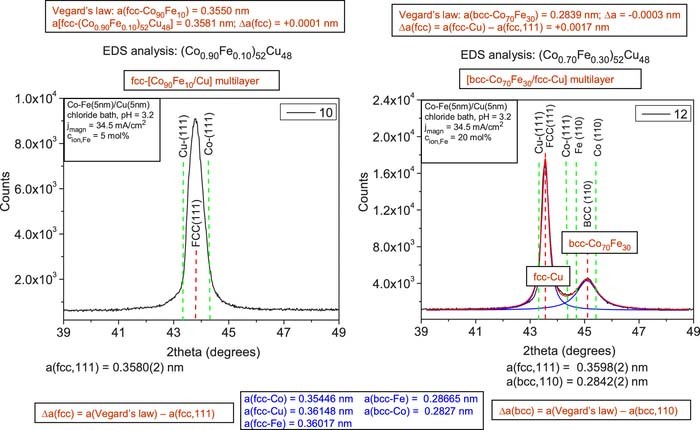
Figure 5. XRD patterns for Co-Fe(5nm)/Cu(5nm) multilayers prepared from a chloride bath (pH = 3.2) at a magnetic layer deposition current density of −34.5 mA/cm2 from baths with a Fe2+ ion concentration of 5 mol% (sample 10, left panel) and with a Fe2+ ion concentration of 20 mol% (sample 12, right panel). The vertical red dashed lines indicate the peak position of the fcc(111) and bcc(110) main multilayer Bragg reflections. The green dashed lines indicate the position of the (111) lines of fcc-Cu and fcc-Co (both panels) as well as the position of the (110) lines of bcc-Fe and bcc-Co (right panel only).
The XRD pattern of sample 12 deposited from the chloride bath with a high Fe2+ ion concentration of 20 mol% is shown in the right panel of Fig. 5 (a very similar pattern with somewhat stronger bcc peak with respect to the fcc peak was obtained also for sample 11 deposited at the lower value of jmagn). Similarly to the sulfate bath, we can observe that for a Co:Fe atomic ratio of about 2:1 in the magnetic layer, in addition to an fcc(111) peak between the fcc-Cu(111) and fcc-Co(111) positions), also a bcc(110) peak appears, corresponding to the Co-Fe magnetic layer. Interestingly, whereas the compositions of samples 7 and 8 (sulfate bath) as well as of samples 11 and 12 (chloride bath) are fairly similar, the ratios of the fcc and bcc peaks are just opposite in the chloride bath samples and the sulfate bath samples. However, when we calculated the sums of the areas under the peaks detected in the whole diffractogram for each of the two phases, similar values were obtained for the fcc and bcc phases, indicating that the stronger fcc(111) peak is a texture effect only.
Again using Vegard's law with the analyzed compositions, we have estimated the lattice parameter of the bcc magnetic layer in samples 11 and 12 from the chloride bath. The uppermost box above the XRD pattern of sample 12 indicates a fairly good agreement of the estimated lattice parameter of the bcc Co-Fe alloy with the experimental value of the bcc phase lattice parameter (a very similar result was obtained also for sample 11).
Co-Fe/Cu multilayers from the citrate bath
The XRD pattern of sample 13 deposited from the citrate bath with a low Fe2+ ion concentration of 5 mol% is shown in the left panel of Fig. 6 (a very similar XRD pattern was obtained also for sample 14 from the same bath). Similarly to the chloride bath with low Fe2+ ion concentration, a single fcc (111) Bragg peak can be observed, indicating that the magnetic and non-magnetic regions in the deposit adopt a common fcc lattice. Estimating the lattice parameter of the deposit with the known composition by Vegard's law, we get a fairly good agreement with the experimental lattice parameter (see Table IV). Similarly to the case of the chloride bath samples, the XRD patterns do not allow to decide whether we have to deal here with a layered structure or two kinds of nanoscale regions are intermixed in the sample.
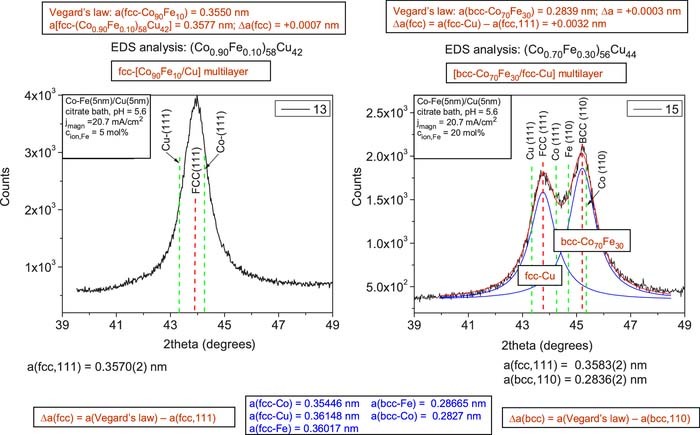
Figure 6. XRD patterns for Co-Fe(5nm)/Cu(5nm) multilayers prepared from a citrate bath (pH = 5.6) at a magnetic layer deposition current density of −20.7 mA/cm2 from baths with a Fe2+ ion concentration of 5 mol% (sample 13, left panel) and with a Fe2+ ion concentration of 20 mol% (sample 52, right panel). The vertical red dashed lines indicate the peak position of the fcc(111) and bcc(110) main multilayer Bragg reflections. The green dashed lines indicate the position of the (111) lines of fcc-Cu and fcc-Co (both panels) as well as the position of the (110) lines of bcc-Fe and bcc-Co (right panel only).
The XRD pattern of sample 15 deposited from the citrate bath with a high Fe2+ ion concentration of 20 mol% are shown in the right panel of Fig. 6 (a very similar pattern with somewhat stronger bcc peak with respect to the fcc peak was obtained also for sample 16 deposited from the same bath at higher magnetic layer deposition current density). Similarly to the sulfate bath, we can observe that for a Co:Fe atomic ratio of about 2:1 in the magnetic layer, in addition to an fcc(111) peak between the fcc-Cu(111) and fcc-Co(111) positions), also a large bcc(110) peak appears, corresponding to the Co-Fe magnetic layer. As opposed to the Fe-rich samples from the sulfate and chloride baths where the fcc peak amplitude was much smaller and larger, respectively, than the bcc peak, here in the case of the citrate bath, the fcc and bcc peaks have comparable magnitudes with a slightly larger bcc peak.
Again using Vegard's law, we have estimated the lattice parameter of this bcc magnetic layer. The uppermost boxes above the XRD patterns indicate a fairly good agreement of the estimated lattice parameter of the bcc Co-Fe alloy with the experimental value of the bcc phase lattice parameter (see Table IV).
GMR in Electrodeposited Co-Fe(5nm)/Cu(5nm) Multilayers
The room-temperature magnetoresistance was measured for all the multilayers produced from the four different bath formulations. In each case, the magnetoresistance was found to be negative in the whole magnetic field range investigated for both the longitudinal (LMR) and transverse (TMR) magnetoresistance configurations what indicates a clear GMR behavior.19 For a given multilayer, the TMR component was slightly more negative than the LMR component due to the anisotropic magnetoresistance (AMR) effect within the relatively thick magnetic layers (this quantity is defined as AMR = LMR – TMR19,27,28).
It was shown in the previous section that the deposition current density of the magnetic layer (jmagn) did not have a noticeable influence on the structure of the Co-Fe/Cu deposit from a given bath and the experience was the same also with the GMR. On the other hand, the relative Fe2+ ion concentration (cion,Fe) of the electrodeposition bath strongly influenced the phases formed during deposition through the different Co:Fe ratio in the magnetic layer. For cion,Fe = 5 mol%, a single fcc phase was observed with XRD and the magnetic layer composition was around Co90Fe10. For cion,Fe = 20 mol%, both an fcc phase (pure Cu) and a bcc phase consisting of an alloy with the composition around Co67Fe33 were detected.
The magnetoresistance measurements revealed that in spite of the different composition and crystal structure of the magnetic layer for cion,Fe = 5 mol% and 20 mol%, the GMR behavior was qualitatively the same for both the Co90Fe10/Cu and Co67Fe33/Cu multilayers. This is demonstrated in the upper panels of Fig. 7 where the MR(H) curves are shown for sample 10 (low Fe content) and sample 12 (high Fe content), both samples deposited from a chloride bath with the same value of jmagn = −34.5 mA/cm2. We can see in Fig. 7 that the field evolution of the magnetoresistance is very similar for both samples, but the magnitude of the GMR is larger for sample 10 (lower Fe-content). The GMR behaviors shown in Fig. 7 were characteristic for all samples investigated.
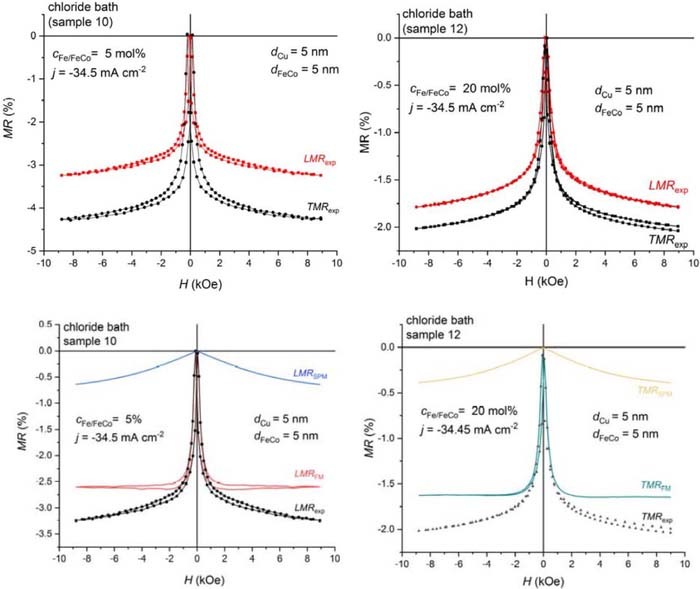
Figure 7. Longitudinal and transverse MR(H) curves for Co-Fe(5nm)/Cu(5nm) multilayers for sample 10 with an fcc-Co90Fe10 magnetic layer (left upper panel) and sample 12 with a magnetic layer of bcc-Co67Fe33 (right upper panel), both samples deposited from a chloride bath with the same value of jmagn = 34.5 mA/cm2. The lower panels display the decomposition of the MR(H) curves into an FM and an SPM contribution (left lower panel: LMR component for sample 10; right lower panel: TMR component for sample 12).
The lower panels in Fig. 7 indicate the decomposition of the measured MR(H) curves into a ferromagnetic (GMRFM) and a superparamagnetic (GMRSPM) contribution as described in the Experimental section. The GMRFM contribution comes from spin-dependent electron scattering events for electron paths via the non-magnetic spacer (Cu layer) between two FM regions each having a fixed orientation of the magnetization in zero magnetic field whereas the GMRSPM term arises from spin-dependent electron scattering events for electron paths between an FM region and an SPM region, the latter exhibiting a rapidly varying orientation of its magnetic moment due to thermal excitations. Figure 7 demonstrates that in both samples the dominating term is GMRFM which is the classical multilayer type GMR effect and this behavior was observed in all the samples deposited from the sulfamate, sulfate and chloride baths whereas samples deposited from the citrate bath exhibited a larger relative fraction of the GMRSPM term.
Evaluating all the magnetoresistance measurements and decomposing the MR(H) curves into an FM and an SPM contribution, the GMRFM results are displayed in Fig. 8 for both the LMR and TMR components. As was already indicated by Fig. 7, the GMRSPM term was fairly small for the two selected samples and Fig. 9 reveals that the same holds true for all the samples. In Fig. 9, the data are shown for the TMR component only, but a very similar diagram was obtained also for the LMR component.
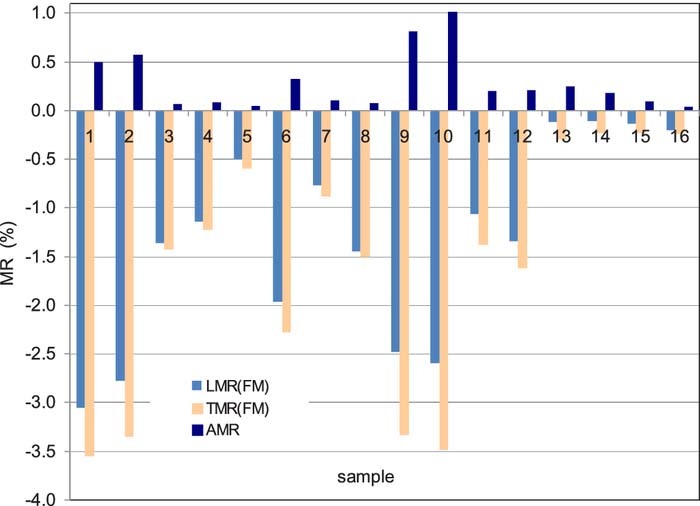
Figure 8. The GMRFM contributions of the longitudinal (LMR) and transverse (TMR) magnetoresistance and the difference AMR = LMR – TMR for Co-Fe(5nm)/Cu(5nm) multilayers electrodeposited from the four different bath formulations with two different values of jmagn and cion,Fe. For sample identification and specific deposition conditions, see Table III.
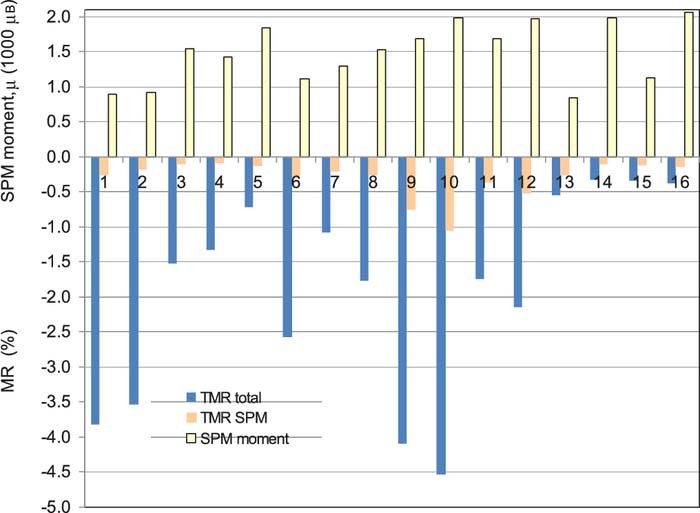
Figure 9. Comparison of the total transverse (TMR) magnetoresistance contribution with the saturation value of the SPM contribution to TMR for Co-Fe(5nm)/Cu(5nm) multilayers electrodeposited from the four different bath formulations with two different values of jmagn and cion,Fe. For sample identification and specific deposition conditions, see Table III. The positive values (yellow bars) represent the average SPM magnetic moment deduced from the measured TMR(H) curves by the Langevin fitting procedure.
The dominance of the GMRFM term over the GMRSPM term suggests that these multilayers (except those deposited from the citrate bath) can be considered as forming a layered structure with alternating magnetic and non-magnetic layers (either as fcc/fcc or bcc/fcc pairs) since the GMRFM term is characteristic for a multilayer-like structure only. Although multilayer satellites were not observed in all the samples which we specify as multilayers on the basis of the GMR results, the absence of such satellite reflections in those multilayers indicates only that the layer stacking is not sufficiently coherent along the growth (such a coherency can anyway be expected for the fcc/fcc pairs only and not for bcc/fcc pairs), but does not exclude the presence of a layered structure. The GMR results provide a strong hint at the latter structure as opposed to a nanoscale mixture of a magnetic and non-magnetic phases even for samples without visible multilayer satellites in the XRD pattern.
The data indicate that the largest GMRFM contribution (i.e., the largest multilayer type GMR effect) was obtained for samples 1 and 2 deposited from the sulfamate bath and samples 9 and 10 from the chloride bath, for both baths with low Fe-content (magnetic layer: fcc-Co90Fe10), although sample 6 (sulfate bath, magnetic layer: fcc- Co90Fe10) also had only a slightly smaller GMR. For the sulfamate, sulfate and chloride baths, the multilayers composed of fcc-Cu layers and bcc-Co70Fe30 magnetic layers exhibited a definitely smaller GMR than their fcc-Co90Fe10/Cu multilayer counterparts. This is in agreement with our previous work on electrodeposited Co-Fe/Cu multilayers11 and with the known results on sputtered Co-Fe/Cu multilayers36 in that the GMR of Co-Fe/Cu multilayer decreases with the increase of the Fe-content.
As to the AMR (see Fig. 8, positive MR values), it arises from the 5 nm thick magnetic layers. The observed magnitude of the AMR is typically below 1% and this is in conformity with what we can expect from AMR data reported for bulk alloys and thin alloy films of approximately such compositions.37 On the other hand, since the composition is rather different in the fcc and bcc magnetic layers (Co90Fe10 and Co67Fe33, respectively), the AMR magnitude would also be expected to be different for the two kinds of multilayers. Instead, we can see a random fluctuation of the AMR magnitude only which may be due to the fairly soft magnetic behavior of these magnetic layers. Namely, the MR(H) peaks around H = 0 are very narrow as a consequence of the low coercivity and one can easily miss the actual maximum or minimum values of the MR(H) curves, leading to a random variation of the AMR values.
Figure 9 also displays the average magnetic moments (μ) of the SPM clusters as deduced from the Langevin-fitting procedure and the values are typically between 1000 and 2000 μB and very similar values were obtained also from fitting the LMR(H) data. In previous works,26,38–42 SPM moment values ranging from about 1000 to 10000 μB were observed for electrodeposited Co/Cu multilayers, with magnetic moment values depending on the specific deposition conditions. In the present case, we are at the lower border of the reported values which is due to the fact that the deposited magnetic layer thickness is fairly large (5 nm) and, at the same time, the Cu deposition potential has been optimized to prevent the partial dissolution of the previously deposited magnetic layer during the Cu deposition pulse and, therefore, the chances for the formation of isolated small magnetic entities (SPM clusters) during the deposition of the magnetic layers are minimized.
For the Co-rich Co-Fe SPM clusters, we can take an average magnetic moment of about 2 μB on the basis of the Slater-Pauling curve.43 This means that an average SPM moment of about 1500 μB as determined above consists of about 750 atoms corresponding to a cube of 9 × 9 × 9 atoms which may have dimensions like 2 nm × 2 nm × 2 nm. It is very hard to rationalize the formation of such small magnetic regions magnetically isolated from (i.e., not coupled to) the bulk of the magnetic layer with FM behavior, but they are unavoidably present in electrodeposited multilayers.26,38–42 Such an SPM contribution to the observed GMR has been reported also for sputtered Co/Cu44 and Fe/In45 as well as MBE-grown Co/Cu46 multilayers. Ishiji and Hashizume44 tried to elaborate a simple model how such isolated SPM clusters can form during growth at specific roughness features of the growing film.
Summary
In the present work, the structure and the magnetoresistance properties were investigated for electrodeposited Co-Fe/Cu multilayers prepared from various bath formulations. Particular care was exercised to optimize the Cu deposition potential for the various electrochemical baths. This is a crucial step for multilayers electrodeposited from a single bath by two-pulse plating since only the electrochemically optimized Cu deposition potential ensures that neither a dissolution of the previously deposited magnetic material nor the codeposition of magnetic atoms along with the Cu atoms occurs during the Cu deposition pulse. This also ensures that the actual layer thicknesses will be equal to the nominal ones calculated on the basis of Faraday's law by properly accounting for the current efficiency eventually deviating from 100%.
After establishing the optimal Cu deposition potentials, G/P pulse-plating method was applied for Co-Fe(5nm)/Cu(5nm) multilayer preparation (Co-Fe layer: galvanostatic (G) control with two different deposition current densities; Cu layer: potentiostatic (P) control at the optimized Cu deposition potential). For each bath, two different Fe2+ ion concentrations (cion,Fe) were used (5 and 20 mol% with respect to the total magnetic ion concentration, Fe2+ + Co2+). It was a particular aim to study the effect of the various complexing agent additives on the optimal Cu deposition potential that was found to be dependent on the bath formulation and the Fe2+/[Fe2+ + Co2+] ionic ratio in the electrolyte.
According to a SEM EDS analysis of the overall chemical composition of the investigated multilayers, for each bath formulation the magnetic layer composition was about Co90Fe10 for cion,Fe = 5 mol% and was about Co67Fe33 for cion,Fe = 20 mol%. The magnetic/non-magnetic element ratio was found to correspond approximately to the equal nominal thicknesses for the two kinds of layer.
The results of XRD measurements on the phase constitution of the samples were in agreement with the measured compositions. At low Fe2+ ion concentration in the bath (cion,Fe = 5 mol%, magnetic layer composition: Co90Fe10), a single fcc phase was formed and, in some cases, even multilayer satellites could be observed. At high Fe2+ ion concentration in the bath (cion,Fe = 20 mol%, magnetic layer composition: Co67Fe33), both fcc (pure Cu) and bcc phases (Co70Fe30) were present. In each case, the measured lattice constants of the individual phases corresponded well to the values expected for nanoscale mixtures of the constituent phases.
The magnetoresistance measurements indicated a GMR behavior for all multilayers with a maximum GMR of about 4% in some cases, and the bath formulation had a strong influence on the magnitude of the GMR. The superparamagnetic contribution to the GMR was relatively small in all samples except the deposits from the citrate bath. For the other bath formulations, the observed GMR was dominated by the ferromagnetic term (GMRFM) which is characteristic of the multilayer type GMR where the spin-dependent scattering leading to the GMR effect arises from electron paths between two FM regions.
On this basis, we can conclude that the deposits from the sulfamate, sulfate and chloride baths all can be considered as having a layered structure. For the deposits from these baths with low Fe content in the magnetic layer, the structure can be described as an fcc-[Co∼90Fe∼10/Cu] multilayer (in the case of the sulfamate and sulfate baths, the presence of multilayer satellites even indicates a fairly coherent stacking of the constituent layers). On the other hand, for deposits from these baths with higher Fe content in the magnetic layer, the structure can be described as a bcc-Co∼67Fe∼33/fcc-Cu multilayer.
For the citrate bath samples, the low magnitude of the GMR effect and the relatively large fraction of the SPM contribution to the GMR suggests that these deposits probably do not form a nicely layered structure, but they rather consist of a random mixture of nanoscale fcc-Cu and fcc-Co∼90Fe∼10 regions (cion,Fe = 5 mol%) or fcc-Cu and bcc-Co∼67Fe∼33 regions (cion,Fe = 20 mol%). Here, the observed GMR corresponds mainly to the granular alloy type GMR where the spin-dependent scattering leading to the GMR effect arises from electron paths in which at least one SPM region is also involved.19,26
Acknowledgments
This research was supported by the Research Group Linkage Programme (Project Ref. 3.4 – 1001292 – HUN - IP) of the Alexander von Humboldt Foundation, Germany with the funding provided by the Federal Ministry of Education and Research, Germany and in part by the Ministry of Human Capacities of Hungary within the ELTE University Excellence program (1783-3/2018/FEKUTSRAT). The work of D.Z. was supported by the grant ÚNKP-19-3-II-ELTE-199 of the New National Excellence Program of the Ministry of Human Capacities of Hungary.
ORCID
D. Zalka 0000-0001-6704-2860
L. Péter 0000-0001-5604-0982
J. Gubicza 0000-0002-8938-7293
G. Molnár 0000-0002-4792-5516
I. Bakonyi 0000-0002-5873-8601