
Abstract
Leady oxide samples with various Fe contents were recovered from simulated spent lead paste with the addition of various dosages of iron oxides as simulated Fe impurities via hydrometallurgical process with sodium citrate-acetic acid solution. More than 75 wt% of the Fe element in simulated spent lead paste remained in the recovered leady oxide. The recovered leady oxide samples were used to prepare positive plates in order to illuminate the effect of Fe impurities on the phase composition of positive material. When the Fe content in recovered leady oxide was > 223 mg kg−1, the generation of 4PbO·PbSO4 (4BS) during curing procedure was inhibited. The specific surface area, α-PbO2 content, and hydrated PbO2 content of positive active mass (PAM) after formation procedure decreased with the increase of Fe content. As a result, larger PbSO4 crystals formed in Fe-containing PAMs after cell discharge, which hindered the transfer of H2SO4 electrolyte and destroyed the interconnected PbO2 skeleton. The negative effect of Fe impurities on cell cycle performance was observed when the PAM was manufactured from the leady oxide containing only 49 mg kg−1 Fe element, with the cell capacity decreased from 2.2 to 1.0 Ah after only 230 charge-discharge cycles.
Export citation and abstract BibTeX RIS
Recently, many hydrometallurgical alternative routes for the recovery of spent lead-acid battery (LAB) paste have been developed due to the high energy consumption and sulfur oxides emission of the traditional pyrometallurgical recycling method.1 Owing to the high content of impurities including iron oxides, barium sulfate, etc. in the spent lead paste,2,3 the leady oxide product recovered by the hydrometallurgical process often contains a lot of impurities,4,5 which would be transferred into the positive plate when the positive material was made from the synthesized leady oxide.
Two major procedures for a positive plate preparation are curing and formation. Due to the significant influence of impurities on the phase composition of positive material in the manufacturing procedure, the performance of the LAB assembled from the impurities-containing positive plate was significantly affected.6 In a typical manufacturing process for the positive plate, the raw material of leady oxide was first mixed with sulfuric acid and pasted on a grid. After curing under specific temperature and humidity, the positive plate was prepared mainly consisting of 3PbO·PbSO4·H2O (3BS) and 4PbO·PbSO4 (4BS).7 Due to the tighter interconnection between larger 4BS crystals than smaller 3BS crystals, the LABs assembled from the 4BS-based plates usually exhibit longer cycle life than those from 3BS-based plates.8 Yuan et al. have demonstrated that the BaSO4 impurity in leady oxide impeded the generation of 4BS in cured positive paste (CPP) during curing of the positive plate. The capacity decay of the tested LAB assembled from the BaSO4-containing positive plate was accelerated when the leady oxide contains only 0.02 wt% BaSO4.9 During formation procedure the CPP was converted by two-stages electrochemical reactions to achieve PbO2 dominated positive active mass (PAM), as shown in Eqs. 1–5.10
![Equation ([1])](https://content.cld.iop.org/journals/1945-7111/166/10/A1715/revision1/d0001.gif)
![Equation ([2])](https://content.cld.iop.org/journals/1945-7111/166/10/A1715/revision1/d0002.gif)
![Equation ([3])](https://content.cld.iop.org/journals/1945-7111/166/10/A1715/revision1/d0003.gif)
![Equation ([4])](https://content.cld.iop.org/journals/1945-7111/166/10/A1715/revision1/d0004.gif)
![Equation ([5])](https://content.cld.iop.org/journals/1945-7111/166/10/A1715/revision1/d0005.gif)
Because of the higher yield of OH− ions from 4BS during stage I (Eq. 2), the α-PbO2 was generated with a higher content in the 4BS-based plate than 3BS-based plate after formation (Eq. 3). The α-PbO2 plays the role of a skeleton that conducts the electron throughout the plate and provides mechanical support to PAM.8 Furthermore, it is believed that the generated PbO2 phase after formation is a complex heterogeneous system composed of crystal PbO2 phase (α-PbO2 and β-PbO2 crystals) surrounded by hydrated PbO2 phase (gel form). The cycle life of lead-acid battery can be improved by increasing the hydrated PbO2 content.11,12 Zhang et al. have shown that the hydrated PbO2 content was increased with the addition of SnSO4 and Sb2O3 into PAM.12 Furthermore, during the charge-discharge cycles, (Sb3O9)3− ions entered into the gel zones, thus enhanced the electron conductivity, and subsequently increased the electrode capacity.13 Rogachev et al. have established that the gel/crystal ratio of PbO2 in PAM was increased with the addition of CaSO4.6 As a result, the PbSO4 crystals generated during the charge-discharge cycles were refined, thus the cycle life of the testing LAB assembled from the CaSO4-containing PAM was improved.
Generally, the Fe and Ba element impurities in the leady oxide recovered via hydrometallurgical process should be particularly concerned due to their higher content (>1000 mg kg−1) in the real spent lead paste. By contrast, the contents of Al, Cu, and Zn in the spent lead paste are usually lower than 150 mg kg−1.14 When the BaSO4 expander material of negative plate was mixed into the spent lead paste, the Ba element impurity was usually contained in the leady oxide recovered by hydrometallurgical process. The negative effects of Ba impurities on the phase composition of positive material and performance of the assembled LABs have been established in previous studies.9,15 In contrast, the Fe element impurity was usually from the iron substances outside the battery, such as the iron terminal for battery connecting and iron equipment for crushing and separating pretreatment of discarded/spent LAB. Due to the acidic environment and presence of the air, the Fe element impurity usually exists in the form of iron oxides (Fe2O3 and Fe3O4) in the spent lead paste. Several studies suggested that the Fe element impurity could influence the recharge process of LAB by promoting hydrogen and oxygen gassing.16,17 As a result, the self-discharge of the Fe-containing battery was promoted, and the battery failure was accelerated. However, little information was known concerning the relationship between the Fe impurity content and phase composition of positive material during battery manufacturing. Generally, the content of Fe in the metallic Pb recovered through the traditional pyrometallurgical route with refining process was < 10 mg kg−1.18 The Fe impurity with such low content has no evident impact on the phase composition of positive material during battery manufacturing. However, regarding to the hydrometallurgical process, it is a challenge to efficiently remove Fe impurities during the recovery process. Hence, it is essential to understand the effect of Fe impurity on the phase composition of positive material, and it is also important to determine the maximum limit of Fe element in the recovered leady oxide for the manufacturing of a new positive plate.
In our previous researches, an environmentally-friendly hydrometallurgical recovery process for the spent lead paste has been developed.19 In this process, the lead citrate precursor (Pb3(C6H5O7)2·3H2O) was synthesized by leaching the spent lead paste in a sodium citrate-acetic acid solution, and the leady oxide was obtained by calcination of the lead citrate at 375°C in the air. However, due to the negative effects of the impurities especially Fe element in the recovered leady oxide, the testing LAB assembled from the positive plate made from the recovered leady oxide showed a drastic capacity decrease in only 30 charge-discharge cycles.20
The aim of present work was to illuminate the transformation of Fe element during the recovery process and the influences of Fe impurity in recovered leady oxide on the phase composition of the positive material during the battery manufacturing procedures (i.e., curing and formation) and charge-discharge cycles. The Fe-containing leady oxide samples were recovered from the simulated spent lead pastes (comprising of PbSO4, PbO2, PbO, and Pb) with the addition of various dosages of iron oxides as simulated Fe element impurities via hydrometallurgical process with sodium citrate-acetic acid recovery method. Subsequently, the leady oxide samples with various Fe contents were used as the precursors of positive material to manufacture the positive plates. The phase composition, morphology, and crystal structure of the positive material during the curing and formation were intensively investigated, and the battery performance was also tested.
Experimental
Material preparation
The chemical compositions (62.2 wt% PbSO4, 21.8 wt% PbO2, 14.2 wt% PbO, and 1.0 wt% metallic Pb) of simulated spent lead paste were designed according to the mineral phases (Figure 1a) and chemical compositions (Table I) of spent lead paste provided by Hubei Jinyang metallurgical Co., Ltd. As shown in Figure 1b, Fe2O3 and Fe3O4 are identified as the major mineral phases of the magnetically concentrated lead paste sample. Hence, the mixture of Fe2O3 and Fe3O4 (molar ratio of Fe2O3 to Fe3O4 was designed as 1:1) was mechanically mixed with the simulated spent lead paste to prepare the Fe-containing simulated spent lead paste sample. Different mass ratios of total Fe element to the simulated spent lead paste were set as 0, 0.002, 0.005, 0.02, 0.05, 0.2, and 0.5 wt%, respectively.
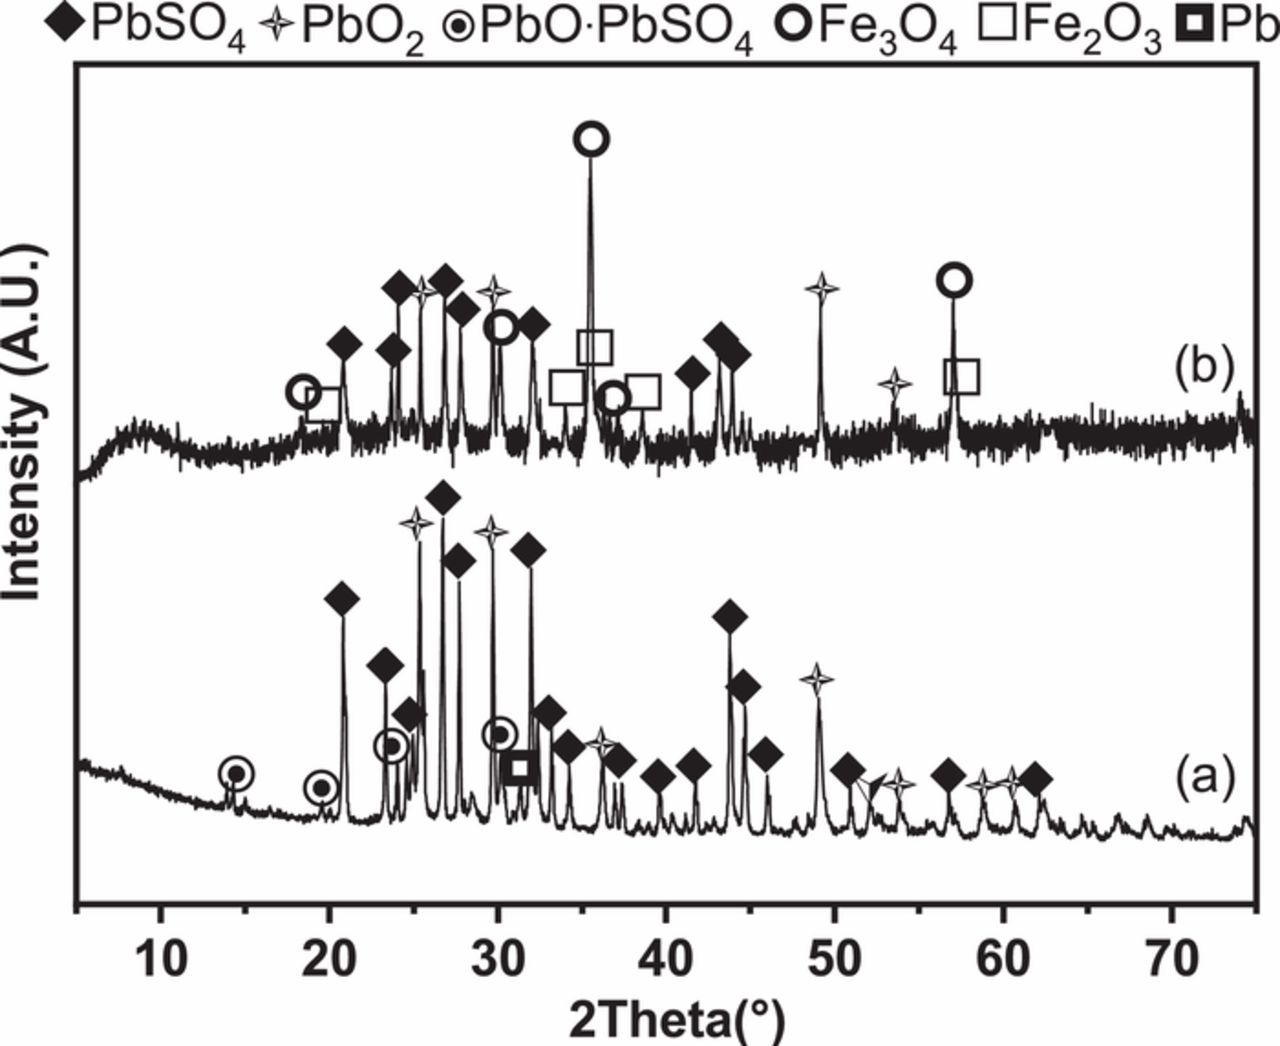
Figure 1. XRD patterns of (a) the spent lead paste, and (b) the magnetically concentrated sample from the spent lead paste.
Table I. Chemical compositions and impurity contents in real spent lead paste.
| Composition | PbSO4 | PbO2 | PbO | Pb metal | Impurities | Total Pb element |
|---|---|---|---|---|---|---|
| Percentage (wt%) | 62.2±0.2 | 21.8±0.4 | 14.2±0.3 | 1.0±0.2 | 0.8±0.3 | 75.5±0.4 |
| Impurities | Fe | Ba | Sb | Al | Cu | Zn |
| Content (mg kg−1) | 1900±112 | 1110±79 | 1300±78 | 110±17 | 100±32 | 70±14 |
According to our previous studies,19 100 g Fe-containing simulated spent lead paste was added to a solution containing 163.2 g sodium citrate (Na3C6H5O7·2H2O, purity ≥ 99% W/W), 35 mL acetic acid (CH3COOH, purity ≥ 99.5% W/W), and 60 mL hydrogen peroxide (H2O2, purity ∼30% W/V) with a solid/liquid mass ratio of 1/8. The slurry was stirred using an overhead stirrer at room temperature (25°C) with a speed of 300 rpm for 6 h. Subsequently, the mixture was kept at 50°C of 24 h for the growth of lead citrate crystals. The lead citrate obtained after filtration and washing was dried at 50°C for 5 h. Finally, the lead citrate was calcined at 375°C in the air to synthesize the Fe-containing leady oxide. The leady oxide samples prepared from the simulated spent lead pastes with the Fe element contents of 0, 0.002, 0.005, 0.02, 0.05, 0.2, and 0.5 wt% were referred to as LO-0, LO-0.002, LO-0.005, LO-0.02, LO-0.05, LO-0.2, and LO-0.5, respectively. The residual ratio of Fe element during the whole hydrometallurgical process was calculated according to Eq. 6.
![Equation ([6])](https://content.cld.iop.org/journals/1945-7111/166/10/A1715/revision1/d0006.gif)
where m1 (g) is the mass of the obtained leady oxide; W1 (wt%) is the mass percentage of Fe element in the obtained leady oxide; m2 (g) is the mass of the simulated spent lead paste; and W2 (wt%) is the mass percentage of Fe element in the simulated spent lead paste.
Cell assembling and testing
The Fe-containing leady oxide was mechanically mixed with 0.1 wt% fiber and 14 wt% deionized water, followed by slowly adding 9.0 wt% H2SO4 solution (1.4 g cm−3) for the paste mixing. The apparent density of paste was higher than 4.0 g cm−3 after mixing. The obtained wet lead paste of 27.5 g was pasted on a Pb-Ca-Sn-Al alloy plate (35 mm × 60 mm × 1.2 mm) to manufacture a 2 Ah positive plate based on the PAM utilization efficiency of 45%.
The curing of the positive plate was carried out in a curing vessel under the following conditions: 80°C and 95% relative humidity for 48 h, followed by 70°C and 10% relative humidity for 24 h. In the formation procedure, the cured positive plate was soaked in a sulfuric acid solution (1.05 g cm−3) for 2 h, followed by the constant current charged for 48 h (triple theoretical capacity). Each positive plate was coupled with two commercial negative plates and followed by adding 40 mL sulfuric acid (1.24 g cm−3) for a 2 V/2 Ah testing cell assembly.
The initial discharge capacities (C/20 and 1C) of the testing cells were measured at the discharge current of 0.1 A and 2 A, respectively. The charge-discharge cycling test was carried out under the following process: during charging the cell was first charged at 0.2 A (C/10) until the cell voltage increased up to 2.45 V and followed by constant voltage charging at 2.45 V for 6 h, then the 100% depth of discharge (100% DOD) of cell was performed at 0.2 A (C/10) with the cut-off potential of 1.75 V. All the cell cycling tests were carried out under constant temperature of 25±1°C. The cell was considered to be a failure state when the discharge capacity decreased to 1 Ah.
Measurement and characterization
The content of Fe element in the leady oxide samples was measured by an inductive coupled plasma optical emission spectrometer (ICP-OES 8300, PerkinElmer, USA) after digesting the samples with 5% V/V HNO3 solution. The X-ray diffraction (XRD) analysis was carried out using X-ray diffraction analyzer (XRD-7000, Shimadzu, Japan) with Cu Kα radiation in the range from 5° to 75°. The X-ray photoelectron spectroscopy (XPS) was employed for the measurement of hydrated PbO2 content in the PAMs with Al-Kα X-ray source operating at 10 mA and 15 kV (AXIS-ULTRA DLD-600W, Shimadzu, Japan). The specific surface and pore size of the PAMs after formation were measured using a BET surface area analyzer (BK112-TB, JWGB Sci & Tech. Co., Ltd., China) based on nitrogen adsorption and desorption method. The morphology of samples was studied using a field emission scanning electron microscope (FESEM, Nova Nano SEM 450, FEI, USA). The high-resolution transmission electron microscope image of hydrated and crystalline PbO2 was obtained with a transmission electron microscope (TEM, Talos F200x, FEI, USA) after the PAM was manually shattered and dispersed by ultrasound in ethanol. The microanalyses of Pb, O, S, and Fe elements in the samples were carried out by energy dispersive X-ray spectroscopy (EDX) and high-resolution hyper probe wavelength-dispersive spectroscopy (WDS) with an electron probe micro-analyzer (EPMA, 8050G, Shimadzu, Japan).
Crystalline phase of the positive material
The contents of crystalline phases in the positive material were expressed by the relative intensities of the characteristic diffraction lines in the XRD patterns, Ia/ΣIn, where Ia represents the characteristic diffraction line for a given phase and ΣIn is the sum of the intensities of the characteristic lines for all crystalline phases in the samples.21,22 The following characteristic reflections were used: d = 0.307 nm for α-PbO, d = 0.295 nm for β-PbO, d = 0.322 nm for 4BS, d = 0.326 nm for 3BS, d = 0.313 nm for α-PbO2, and d = 0.350 nm for β-PbO2.
Results and Discussion
Analysis of the leady oxide samples
As shown in Table II, the residual ratios of Fe element in prepared leady oxide samples were all more than 75 wt% with various Fe additions, indicating that most of the Fe element impurity in the simulated spent lead paste remained in the leady oxide after the leaching and calcination process. In addition, the recovery efficiency of Pb were all more than 98 wt%.
Table II. The residual ratio of Fe and the recovery efficiency of Pb in the recovery process and the contents of Fe and PbO in the synthesized leady oxide products.
| Sample | Residual ratio of Fe (wt%) | Recovery efficiency of Pb (wt%) | Content of Fe (wt%) | Content of PbO (wt%) |
|---|---|---|---|---|
| LO-0 | − | 98.5 | 0.0001 | 94.9 |
| LO-0.002 | 80.1 | 98.4 | 0.0020 | 94.9 |
| LO-0.005 | 78.3 | 98.4 | 0.0049 | 93.5 |
| LO-0.02 | 89.2 | 98.4 | 0.0223 | 96.3 |
| LO-0.05 | 86.2 | 98.4 | 0.0540 | 93.5 |
| LO-0.2 | 86.5 | 98.3 | 0.2167 | 94.9 |
| LO-0.5 | 82.0 | 98.5 | 0.5129 | 93.5 |
This result can be explained by the fraction diagrams of Pb2+ and Fe3+ in Fe3+-Pb2+-cit3–-CH3COO−-SO42– system (cit3– for citrate ion, C6H5O73–) constructed by Medusa software (Figures 2a and 2b). In this sodium citrate-acetic acid solution leaching system, the pH of leaching solution was controlled within a range of 5.0–6.0 to achieve a high recovery efficiency of Pb element.19 Figure 2a shows that the prepared lead citrate precursor was mainly Pb2(cit)3 under such condition. This result is consistent with previous study that the product was Pb3(C6H5O7)2·3H2O when the leaching pH was 5.2.23 Figure 2b shows that the Fe3+ ions were formed into solid phase of Fe2O3 when the pH was 5.0–6.0. Therefore, the Fe2O3 remained in the lead citrate precursor after filtration, and then incorporated into the final leady oxide products after calcination of lead citrate precursor. The results of the contents of PbO in different leady oxide samples indicate that Fe impurity has no obvious effect on the oxidation degree of leady oxide in the lead citrate calcination step (Table II).
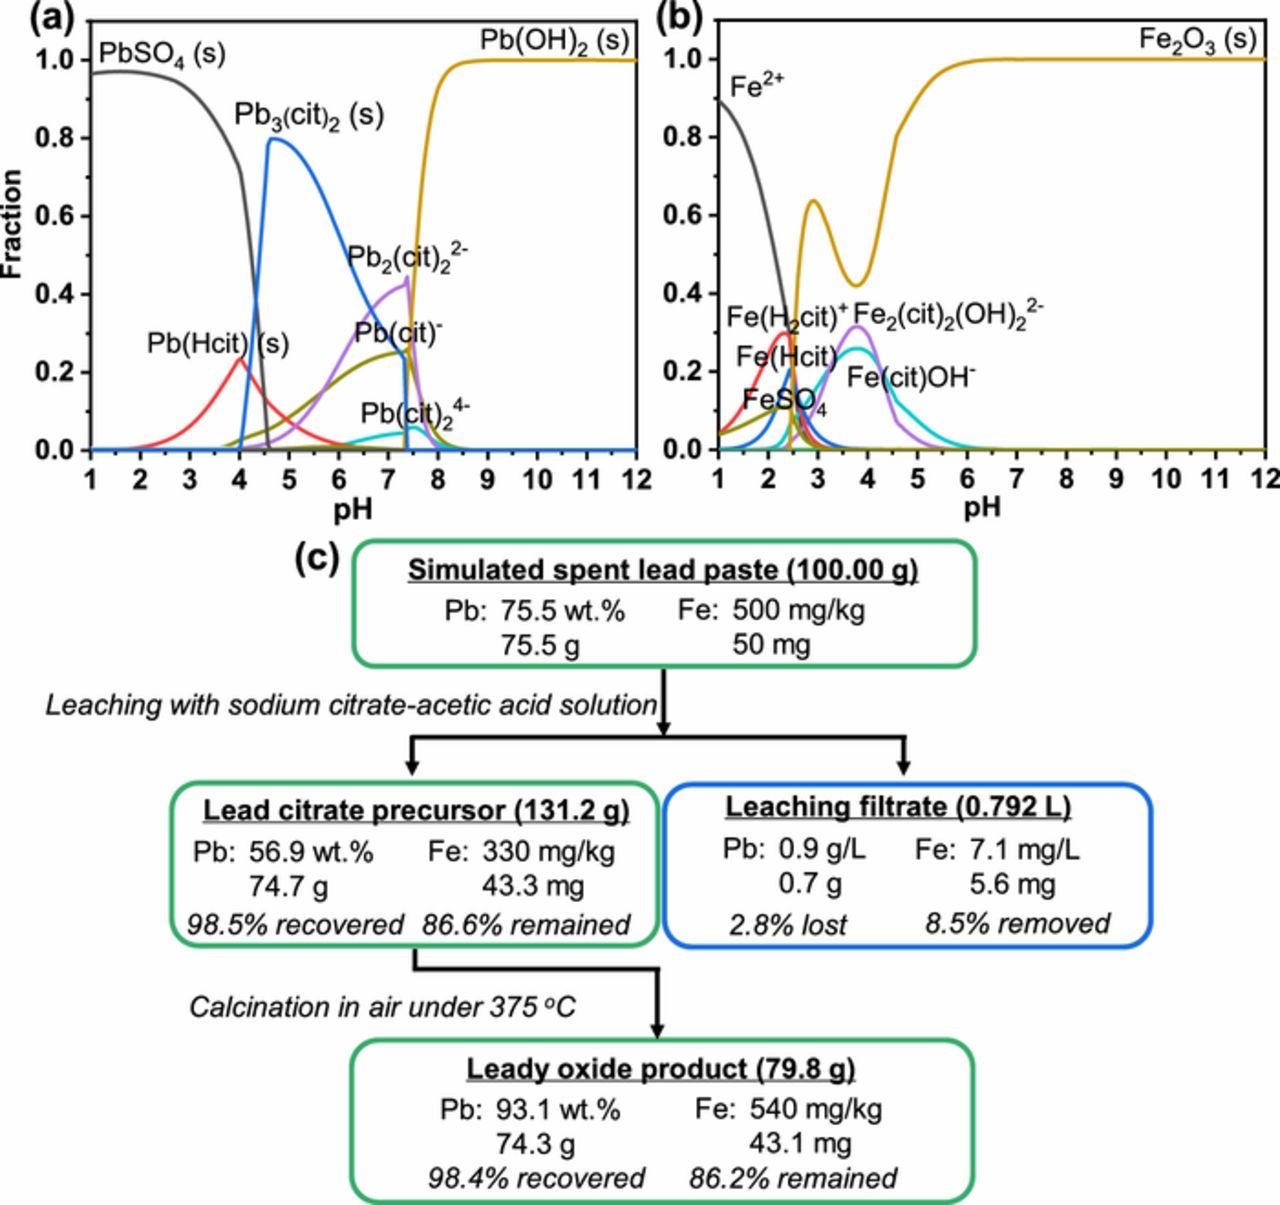
Figure 2. Fraction diagrams of (a) Pb2+ and (b) Fe3+ in Fe3+-Pb2+-cit3–-CH3COO−-SO42– system (0.01 mol L−1 Fe3+ with 0.1 mol L−1 Pb2+, 0.15 mol L−1 cit,3– 0.05 mol L−1 CH3COO−, 0.1 mol L−1 SO42–, temperature of 25°C, and Eh of 0.6 V), (c) mass balance of Pb and Fe elements in the recovery of 100 g simulated spent lead paste with Fe element content of 0.05 wt% via hydrometallurgical process.
The transformations of Pb and Fe elements in the hydrometallurgical recovery of simulated spent lead paste with Fe element content of 0.05 wt% are shown in Figure 2c as an example. As shown in Figure 2c, 98.5% of Pb element in the simulated spent lead paste was recovered after leaching step, and 86.6% of Fe element in the simulated spent lead paste remained in the lead citrate precursor. After the calcination step, most of the Pb and Fe elements in the lead citrate precursor remained in the leady oxide product. The total recovery efficiency of Pb element in the whole recovery process was calculated as 98.4%, and the total residual ratio of Fe was 86.2%. The mass balances of Fe element during the recovery of other Fe-containing simulated spent lead paste samples are also calculated and provided in Table III.
Table III. Mass balance of Fe element in the whole process and the calculated mass loss ratio of Fe in each step.
| Simulated spent lead paste (100 g) | Lead citrate precursor | Leaching filtrate | Leady oxide product | |||||||||
|---|---|---|---|---|---|---|---|---|---|---|---|---|
| Fe element content (wt%) | Initial Fe mass (mg) | Precursor mass (g) | Content (mg kg−1) | Fe mass in precursor (mg) | Volume (L) | Conc. (mg L−1) | Fe mass in solution (mg) | Mass loss percentage of Fe in leaching step (wt%) | Leady oxide mass (g) | Content (mg kg−1) | Fe mass in leady oxide (mg) | Mass loss percentage of Fe in calcination step (wt%) |
| 0.002 | 2 | 129.5 | 12 | 1.6 | 0.795 | 0.6 | 0.5 | −1.6 | 80.1 | 20 | 1.6 | −3.1 |
| 0.005 | 5 | 129.6 | 31 | 4.0 | 0.792 | 1.6 | 1.3 | −5.7 | 79.9 | 49 | 3.9 | 2.6 |
| 0.02 | 20 | 129.5 | 140 | 18.1 | 0.791 | 2.2 | 1.7 | 0.6 | 80.0 | 223 | 17.8 | 1.6 |
| 0.05 | 50 | 131.2 | 330 | 43.3 | 0.792 | 7.1 | 5.6 | 2.2 | 79.8 | 540 | 43.1 | 0.5 |
| 0.2 | 200 | 130.1 | 1330 | 173.0 | 0.789 | 25.9 | 20.4 | 3.3 | 79.8 | 2167 | 172.9 | 0.1 |
| 0.5 | 500 | 132.0 | 3100 | 409.2 | 0.789 | 94.6 | 74.6 | 3.2 | 79.9 | 5129 | 409.8 | −0.1 |
Mass loss percentage of Fe in leaching step = [1 - (Fe mass in precursor+ Fe mass in solution) / Initial Fe mass] × 100%. Mass loss percentage of Fe in calcination step = [1 - (Fe mass in leady oxide / Fe mass in precursor)] × 100%.
Microstructural characteristics of CPPs with different content of iron impurities after curing procedure
In the curing procedure, some PbO in leady oxide could react with H2SO4 to generate the intermediate phase of 3BS. Then the 3BS would react with PbO to generate 4BS under higher temperature when a certain ratio of PbO to 3BS was achieved.24 The major crystalline phases of the CPPs are identified as 3BS, 4BS, and β-PbO, as shown in Figure 3a. The changes in relative intensity of different phases are presented in Figure 3b. When the content of Fe in the leady oxide samples was lower than or equal to 223 mg kg−1 (LO-0, LO-0.002, LO-0.005, and LO-0.02), the relative intensities of all phases in the prepared CPPs remained basically unchanged. However, the relative intensity of 4BS in the XRD patterns of the CPPs decreased significantly as the content of Fe in the leady oxide continued to increase up to 540 mg kg−1 (LO-0.05), while the relative intensity of 3BS increases accordingly. In addition, some of the β-PbO did not convert to lead sulfate and remained in the CPPs, and its relative intensity almost kept constant with different Fe contents. When LO-0.5 (Fe content of 5129 mg kg−1) was used, the relative intensities of 4BS, 3BS, and β-PbO in the XRD pattern of the CPP were 0, 69.6, and 30.4%, respectively, indicating that no 4BS could be identified under such high content of Fe impurities.
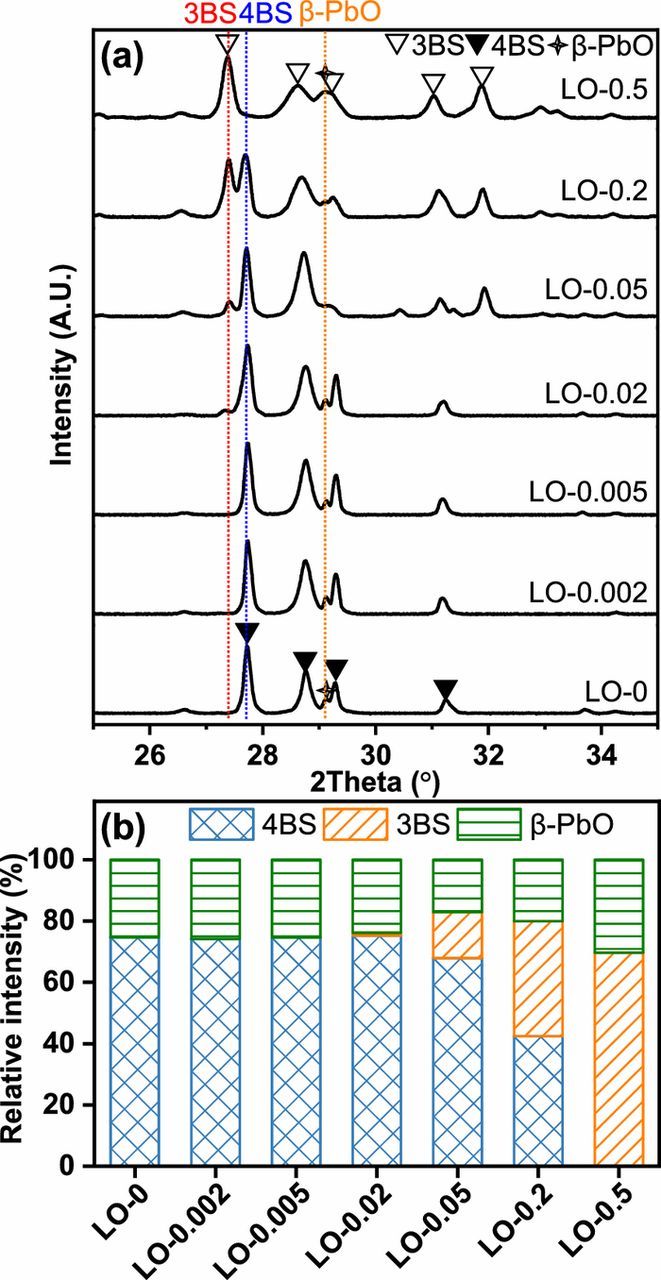
Figure 3. (a) The XRD patterns, and (b) the relative intensity of major crystalline phases of the XRD patterns of the CPPs made from the synthesized leady oxide samples containing different contents of Fe element impurities after curing procedure.
Figure 4a represents the SEM images of the CPP made from LO-0. It consisted of rod-like crystals within the length range of 50–100 μm. The atomic ratio of S:Pb:O element of the selected zone was 1:4.96:8.55, as presented in the EDX result (Figure 4b). It indicates that these rod-like crystals were 4BS crystals (1:5:8), which is consistent with the results of the previous studies.25,26 These large-size 4BS crystals can generate a durable positive plate strength after formation, contributing to a longer cell charge-discharge cycle life. Figure 4c presents the back-scattered electron (BSE) image of the CPP made from LO-0.2 by EPMA. It shows that the sample contains only a small amount of rod-like crystals. The WDS analysis result (Table IV) of the selected rod-like crystals at Position 1 shows that the atomic ratio of S:Pb:O was 1:4.78:7.39:7.74, which was close to the composition ratio of 4BS, indicating that these rod-like crystals were also 4BS. By contrast, the atomic ratio of S:Pb:O at Position 2 and Position 3 were 1:102.5:97.5 and 1:3.68:7.35, respectively, which was close to the composition ratio of PbO (0:1:1) and 3BS (1:4:7), indicating that the major phase was PbO and 3BS at Position 2 and Position 3, respectively. The corresponding WDS mapping result of Fe element is shown in Figure 4d. The darker color represents the lower content of Fe element. Based on the distribution of Fe element, this WDS mapping image can be roughly divided into two areas. The upper right and lower left zones represent the higher-Fe area, and the middle zone represents the lower-Fe area. Combine with the BSE image in Figure 4c and EPMA-WDS mapping result in Figure 4d, it can be concluded that larger 4BS crystals were mainly distributed in the lower-Fe area. This is also consistent with the result in Table IV that the contents of Fe element at Positions 1, 2, and 3 are 0.05, 0.74, and 0.81 wt%, respectively. Therefore, the above results indicate that the generation of 4BS in the CPP was inhibited by Fe element impurities.
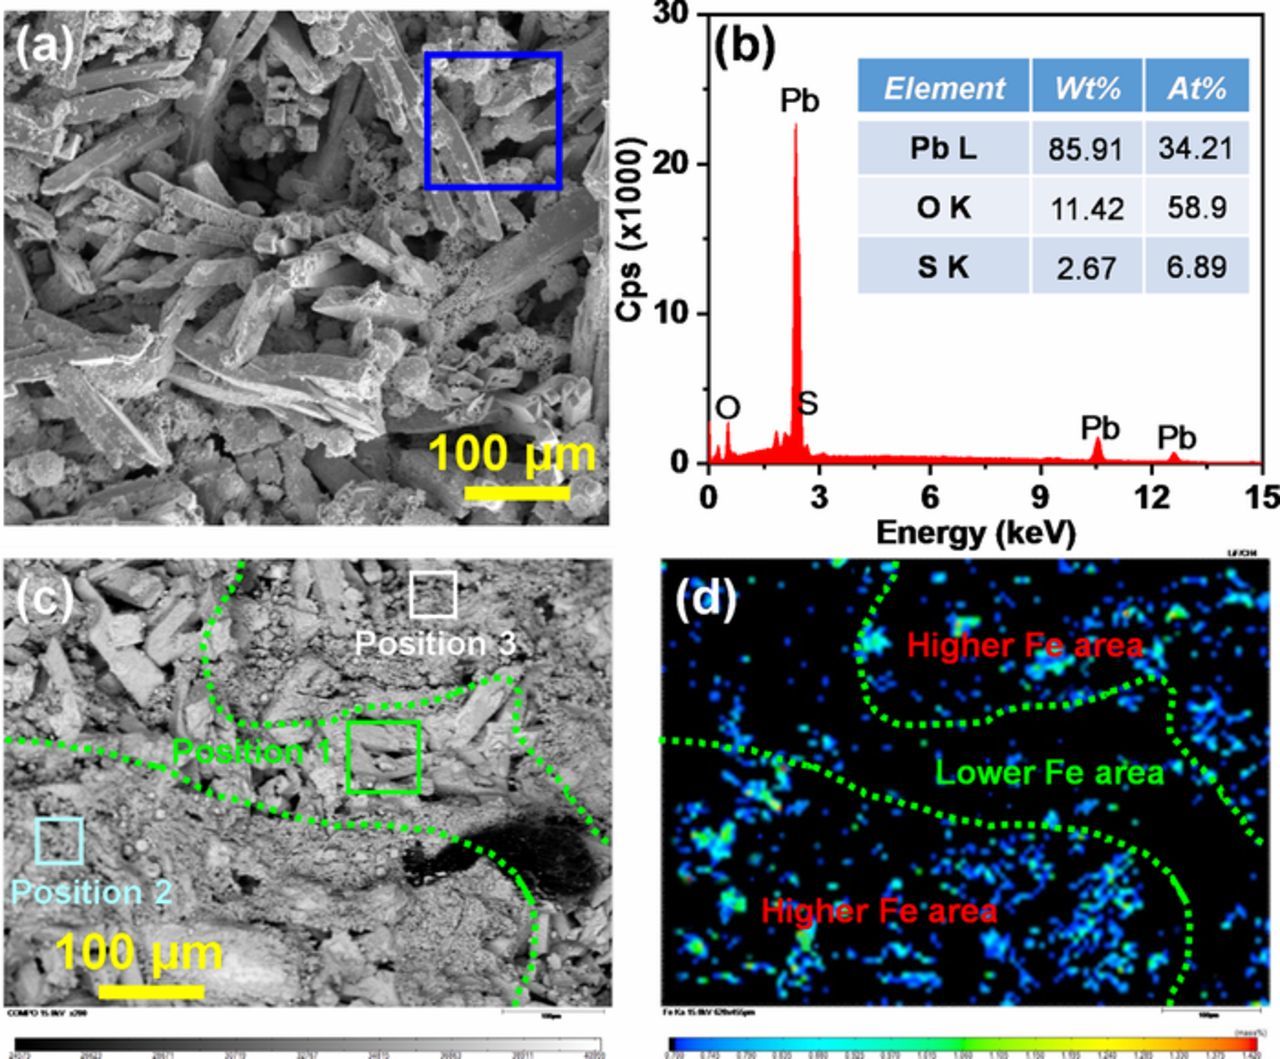
Figure 4. (a) SEM image of the CPP made from LO-0 and (b) the EDX analysis of the selected zone of the left SEM image; and (c) BSE image of the CPP made from LO-0.2 and (d) the corresponding EPMA-WDS mapping result of Fe element of the left BSE image.
Table IV. The EPMA-WDS analysis results of regions denoted as Positions 1–3.
| Position 1 | Position 2 | Position 3 | ||||
|---|---|---|---|---|---|---|
| Element | Wt% | At% | Wt% | At% | Wt% | At% |
| Pb | 86.35 | 35.31 | 92.34 | 50.23 | 82.91 | 30.25 |
| S | 2.79 | 7.39 | 0.14 | 0.49 | 3.48 | 8.22 |
| O | 10.81 | 57.22 | 6.79 | 47.80 | 12.79 | 60.43 |
| Fe | 0.05 | 0.08 | 0.74 | 1.48 | 0.81 | 1.1 |
From the above analysis, the Fe element impurity has a significant influence on the 3BS/4BS ratio of the CPPs. When the Fe element content in leady oxide was higher than 223 mg kg−1 of LO-0.02, the generation and crystallization of 4BS were significantly inhibited.
Microstructural characteristics of PAMs with different content of iron impurities after formation procedure
Figure 5a shows XRD patterns of PAMs after formation procedure. The diffractograms for all samples demonstrate the presence of α-PbO2 and β-PbO2 phases. The intensity of the strongest crystalline peak (27.8o) of α-PbO2 became weaker with the increasing of Fe content. Figure 5b shows that the relative intensities of α-PbO2 and β-PbO2 phases in the PAMs after formation procedure remained basically unchanged when the content of Fe in the leady oxide was lower than or equal to 223 mg kg−1 of the leady oxide samples (LO-0, LO-0.002, LO-0.005, and LO-0.02). The relative intensity of α-PbO2 decreased significantly as the content of Fe increased up to 540 mg kg−1 of LO-0.05, while the relative intensity of β-PbO2 increased accordingly. For the PAM made from the LO-0.5, the relative intensities of α-PbO2 and β-PbO2 are 7.6 and 92.4%, respectively. According to the potential-pH diagram for the Pb-H2O-H2SO4 system constructed by Ruetschi,27 α-PbO2 was usually generated in alkaline environment, while β-PbO2 was generated in acidic environment. During the formation procedure, the 4BS phase generates more OH− ions than 3BS phase (Eqs. 1–2). In addition, the PbO2 formed on the surface of the large 4BS crystals was always denser than that on the small 3BS crystals.28 As a result, the diffusion of H2SO4 electrolyte into 4BS crystals is more difficult than 3BS crystals, so the pH of the electrolyte inside the 4BS-based plate is more alkaline, resulting in the generation of more α-PbO2. The α-PbO2 phase was more favorable for cell life because it has a tighter structure than β-PbO2, which was beneficial to prevent the PAM shedding during the charge-discharge cycling.29,30
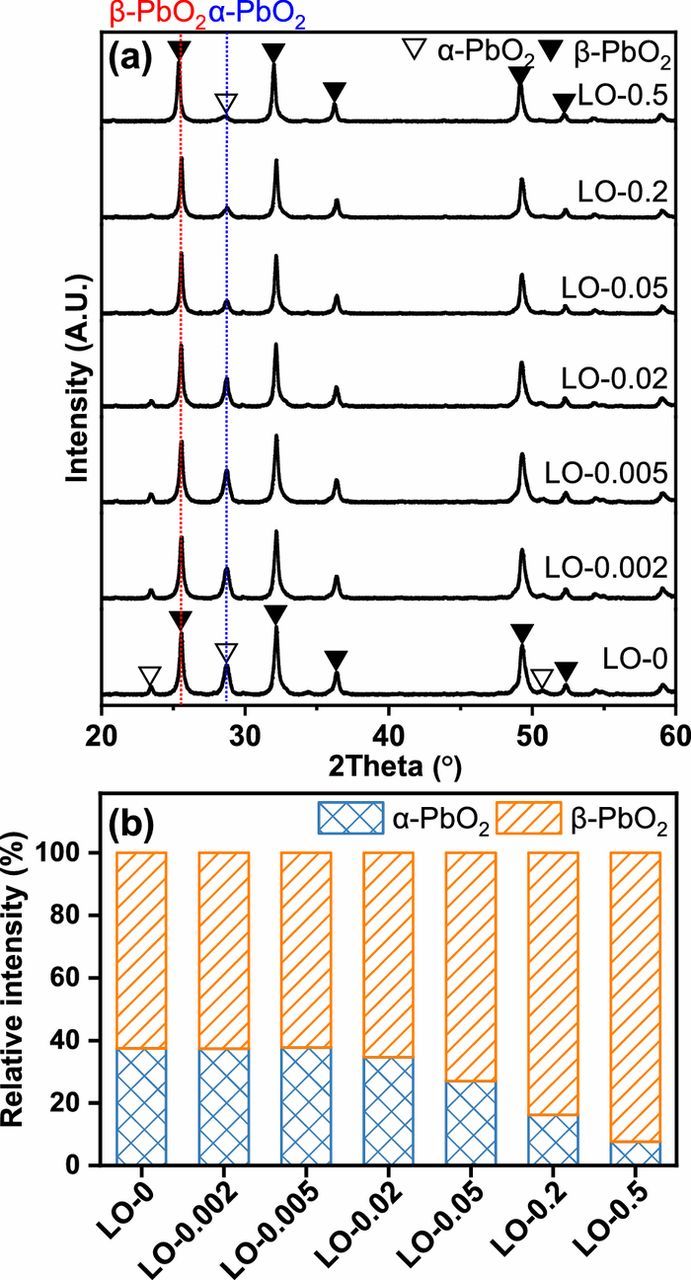
Figure 5. (a) The XRD patterns, and (b) the relative intensity of major crystalline phases of the XRD patterns of the PAMs made from the synthesized leady oxide samples containing different contents of Fe element impurities after formation procedure.
Figure 6a shows the low-resolution SEM image of the PAM made from LO-0. It can be seen that the PAM maintains the skeleton structure of 4BS. The high-resolution SEM image in Figure 6b shows the presence of a large amount of tightly bound small particles in PAM. These microporous, smaller particles were fairly well interconnected into an electron conductive and mechanically stable skeleton for PAM. The EDX analysis in Figure 6c indicates that these particles were PbO2 since the atomic ratio of Pb:O was 1:1.93. Figure 6d shows the low-resolution SEM image of the PAM made from LO-0.2. It can be seen that the PAM has no obvious skeleton structure. The high-resolution SEM image in Figure 6e shows that the particles generated PAM made from LO-0.2 were significantly larger and looser distributed than those made from LO-0. The EDX analysis in Figure 6f indicates that these large particles were also PbO2 since the atomic ratio of Pb:O was 1:2.20. Previous studies have noted the importance of more microporous and smaller PbO2 structure in the cycling performance of cells.12 During the charge-discharge cycling, larger PbO2 was unfavorable to the electrochemical and chemical reactions of the positive plates due to the extremely poor contact between the larger PbO2 particles and electrolyte, i.e., the H+ and HSO4− ions.12 As a result, the discharge capacity of the positive plate with larger PbO2 particle was lower. In addition, the dense structure in PAM made from LO-0 is beneficial for high conductivity and mechanical strength of the plate.8
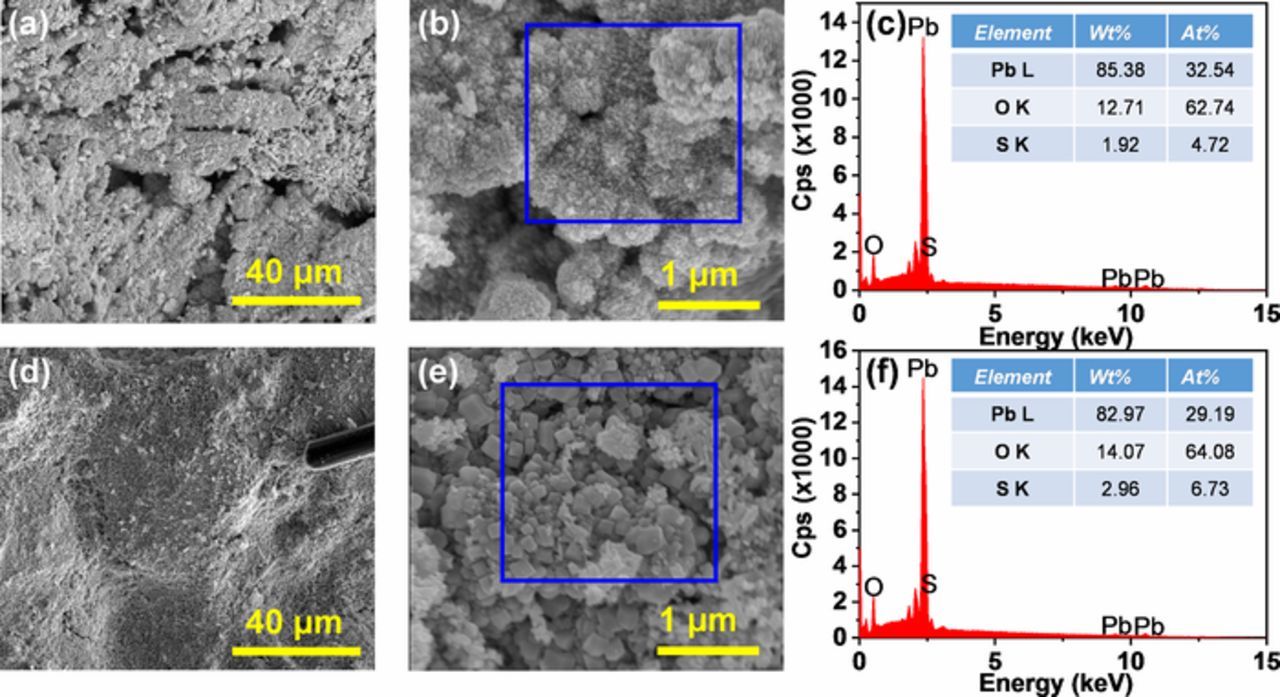
Figure 6. The morphologies of the PAMs made from the synthesized leady oxide samples containing different contents of Fe element impurities after formation procedure: (a), (b) SEM and (c) EDX of PAM made from LO-0; and (d), (e) SEM and (f) EDX of PAM made from LO-0.2.
Figure 7a shows the pore volume distribution vs. the pore diameter of the PAMs after formation procedure. Generally, the electrochemical processes of cell discharge take place on the surfaces of these small pores with a diameter smaller than 100 nm. The PAMs made from lower Fe content leady oxide samples (LO-0, LO-0.002, LO-0.005, and LO-0.02) showed significantly larger pore volume than PAMs with higher Fe content (LO-0.05, LO-0.2, and LO-0.5). Furthermore, Figure 7b shows that the BET surface area of the PAMs made from LO-0.05, LO-0.2, and LO-0.5 is obviously smaller than those made from LO-0, LO-0.002, LO-0.005, and LO-0.02. Larger pore volume and higher surface area are beneficial for facile mass transfer of H2SO4 electrolyte during the cell charge-discharge cycling.
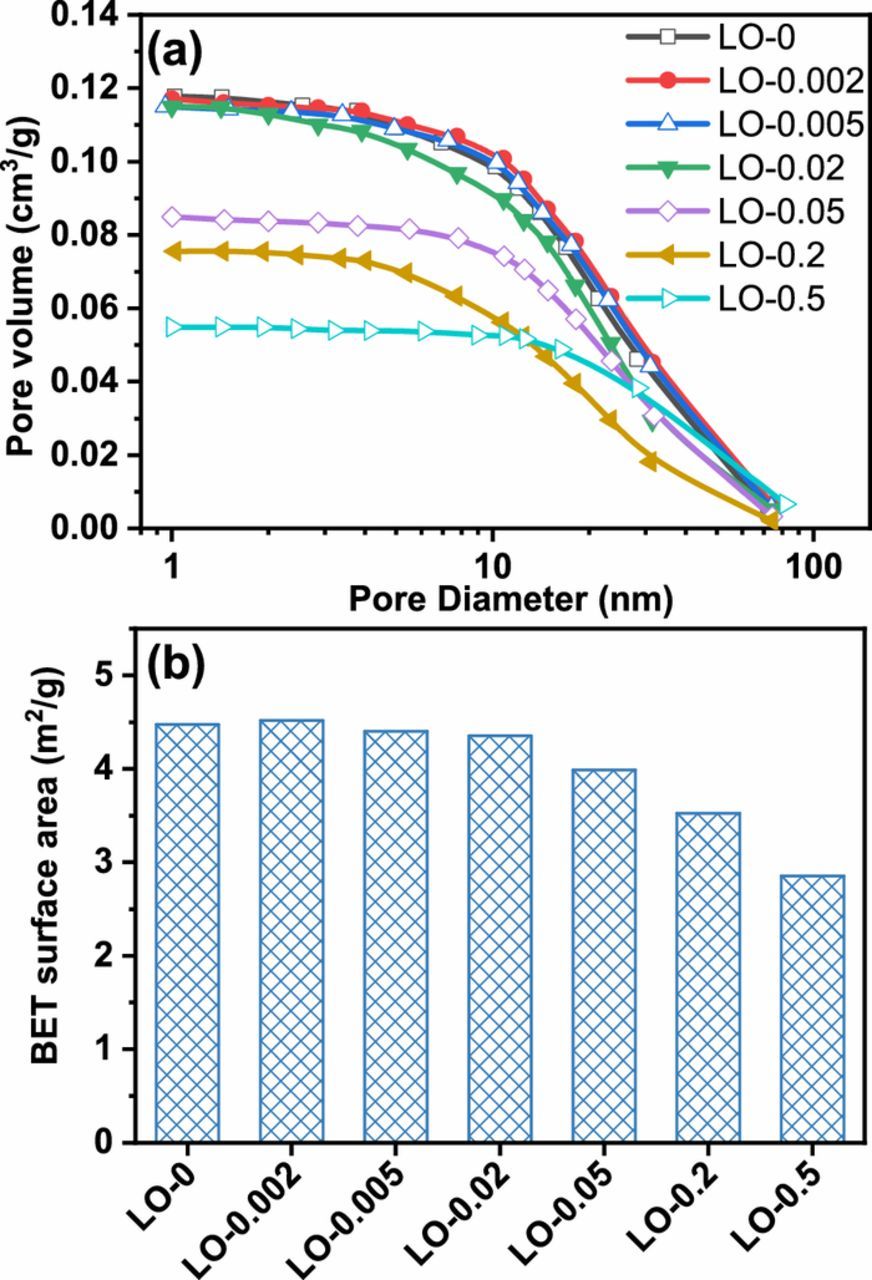
Figure 7. (a) Pore volume distribution and (b) BET surface area of the PAMs made from the synthesized leady oxide samples containing different contents of Fe element impurity after formation procedure.
Microstructure of the hydrated PbO2 in the PAMs after formation procedure
Figure 8a shows the TEM image of gel/crystal zones of PbO2 in the PAM made from LO-0. The dark zones are the crystals of a-PbO2 or β-PbO2, while the lighter regions indicate gel zones of hydrated PbO2.31 The EDX analysis in Figure 8b shows that the selected zone was composed of PbO2 since the atomic ratio of Pb:O:S was 1:2.15:0. In the high-resolution TEM image of the selected zone (Figure 8c), some clear crystal zones can be observed from the composite. The crystal in the upper left zone reveals an interlunar distance of 0.313 nm, which agrees with the interlunar distance of (1, 1, 1) crystal plane of α-PbO2. The crystal in the bottom right zone is identified as β-PbO2 due to its interplanar distance of 0.350 nm. In addition, the PAM contained a lot of hydrated PbO2 in the upper right zone. Figure 8d shows the TEM image of gel/crystal zones of PbO2 in the PAM made from LO-0.2. It shows that the PAM contains more dark zones than the PAM made from LO-0. The EDX analysis in Figure 8e shows that the selected zone was composed of PbO2 since the atomic ratio of Pb:O:S was 1:2.62:0. The high-resolution TEM image (Figure 8f) reveals the presence of big β-PbO2 crystal in PAM.
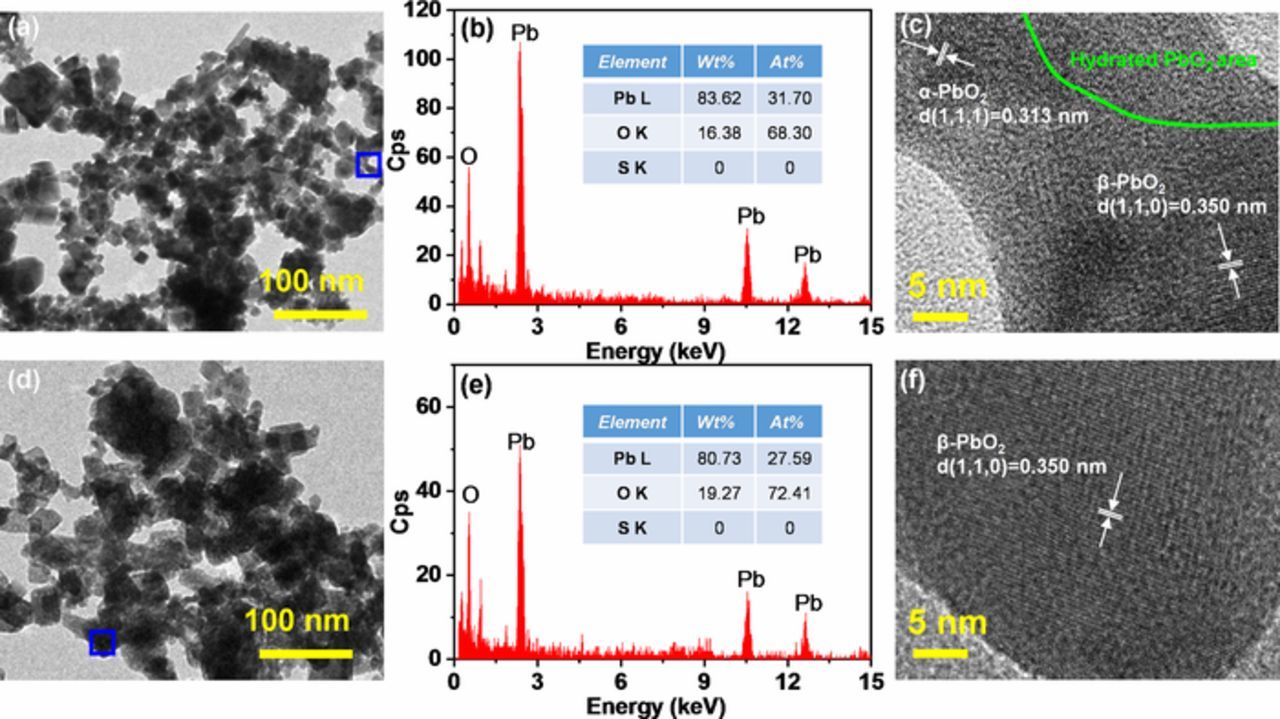
Figure 8. (a) TEM image of PAM made from LO-0, (b) EDX analysis of the selected zone of the left TEM image, and (c) the corresponding high-resolution TEM image; (d) TEM image of PAM made from LO-0.2, (e) EDX analysis of the selected zone of the left TEM image, and (f) the corresponding high-resolution TEM image.
To further investigate the hydrated PbO2 content in the PAMs after formation procedure, XPS spectra of PAMs were acquired. The binding energy was calibrated with respect to the C 1s peak at 284.6 eV. The full spectrum of PAM made from LO-0 after formation in Figure 9a reveals the presence of Pb and O elements. The deconvoluted XPS spectra of O ls peak (Figure 9b) disclose the presence of three peaks at 531.5±0.2 eV (S-O from PbSO4), 530.2±0.2 eV (O-H from hydrated PbO2), and 529.3±0.2 eV (Pb-O from PbO2).12,32 As shown in Figure 9c, the peak area of O-H significantly decreased after the discharge ending of 3rd cycle, owing to the transformation from PbO2 into PbSO4. It indicates that the hydrated PbO2 in gel zones was converted into PbSO4 during discharge. When the plate was re-charged, the gel zone was re-established.11
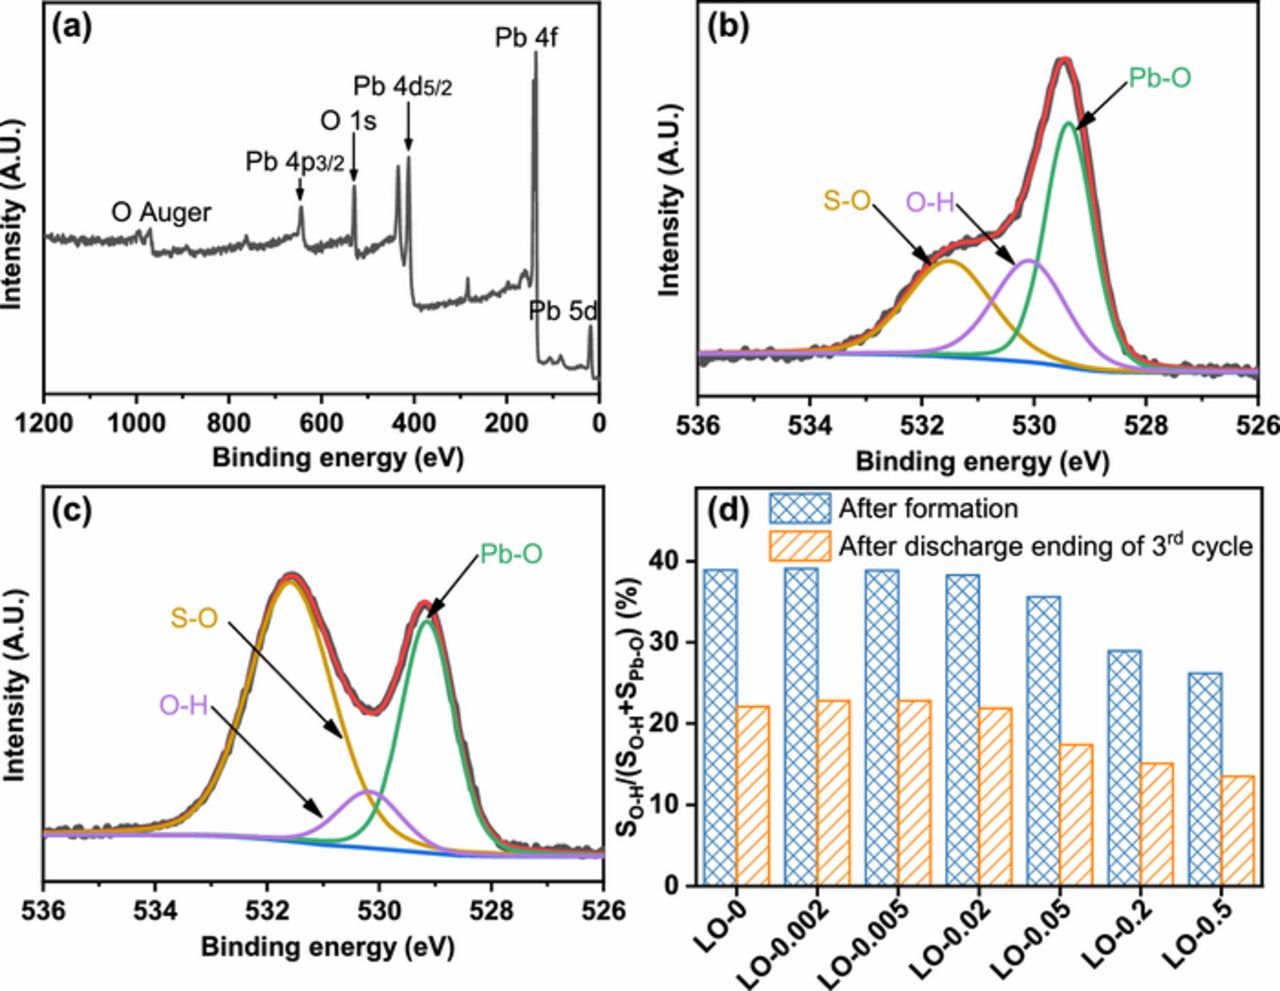
Figure 9. (a) Full XPS spectra of the PAM made from LO-0 after formation; XPS spectra of O 1s of PAM made from LO-0 (b) after formation and (c) after discharge ending of 3rd cycle; and (d) the hydrated PbO2 content of the PAMs made from the synthesized leady oxide samples containing different contents of Fe element impurities.
The ratio of the peak area of O-H to the sum of the peak areas of O-H and Pb-O, defined as SO-H/(SO-H + SPb-O), is used to present the relative content of hydrated PbO2 in the PAMs.11 Figure 9d shows the hydrated PbO2 content of the PAMs with different Fe contents. When the Fe content of the leady oxide was lower than or equal to 223 mg kg−1 of leady oxide samples (LO-0, LO-0.002, LO-0.005, and LO-0.02), the hydrated PbO2 content remained stable, while it decreased significantly when the Fe content of the leady oxide was higher than 540 mg kg−1 in LO-0.05. After the discharge ending of 3rd cycle, the hydrated PbO2 content of the PAM also showed a decreasing trend when the Fe content of the leady oxide was higher than 223 mg kg−1.
Figure 10a shows the BSE image of the PAM made from LO-0 after the discharge ending of 3rd cycle. The WDS mapping results (Figures 10b and 10c) show that the larger crystal with the size of about 20 μm is PbSO4, and the small agglomerated crystals are PbO2. The nanostructured PbO2 particles adhered to the surface of the PbSO4 crystals. In the re-charge step, these PbO2 particles acted as conductive units to promote the conversion of PbSO4.33 As for the PAM made from LO-0.2, the SEM image shown in Figure 10d indicates that the sample consisted of particles with a large size of 30–80 μm. The EDX analysis of the selected zone (Figure 10e) indicates that the crystals were PbSO4 particles since the atomic ratio of Pb:S:O was 1:0.99:4.46. Due to the large particle size of PbSO4, the access from the exterior H2SO4 electrolyte to interior PbSO4 crystals was hindered, and the charge acceptance of the plate was significantly deteriorated.34
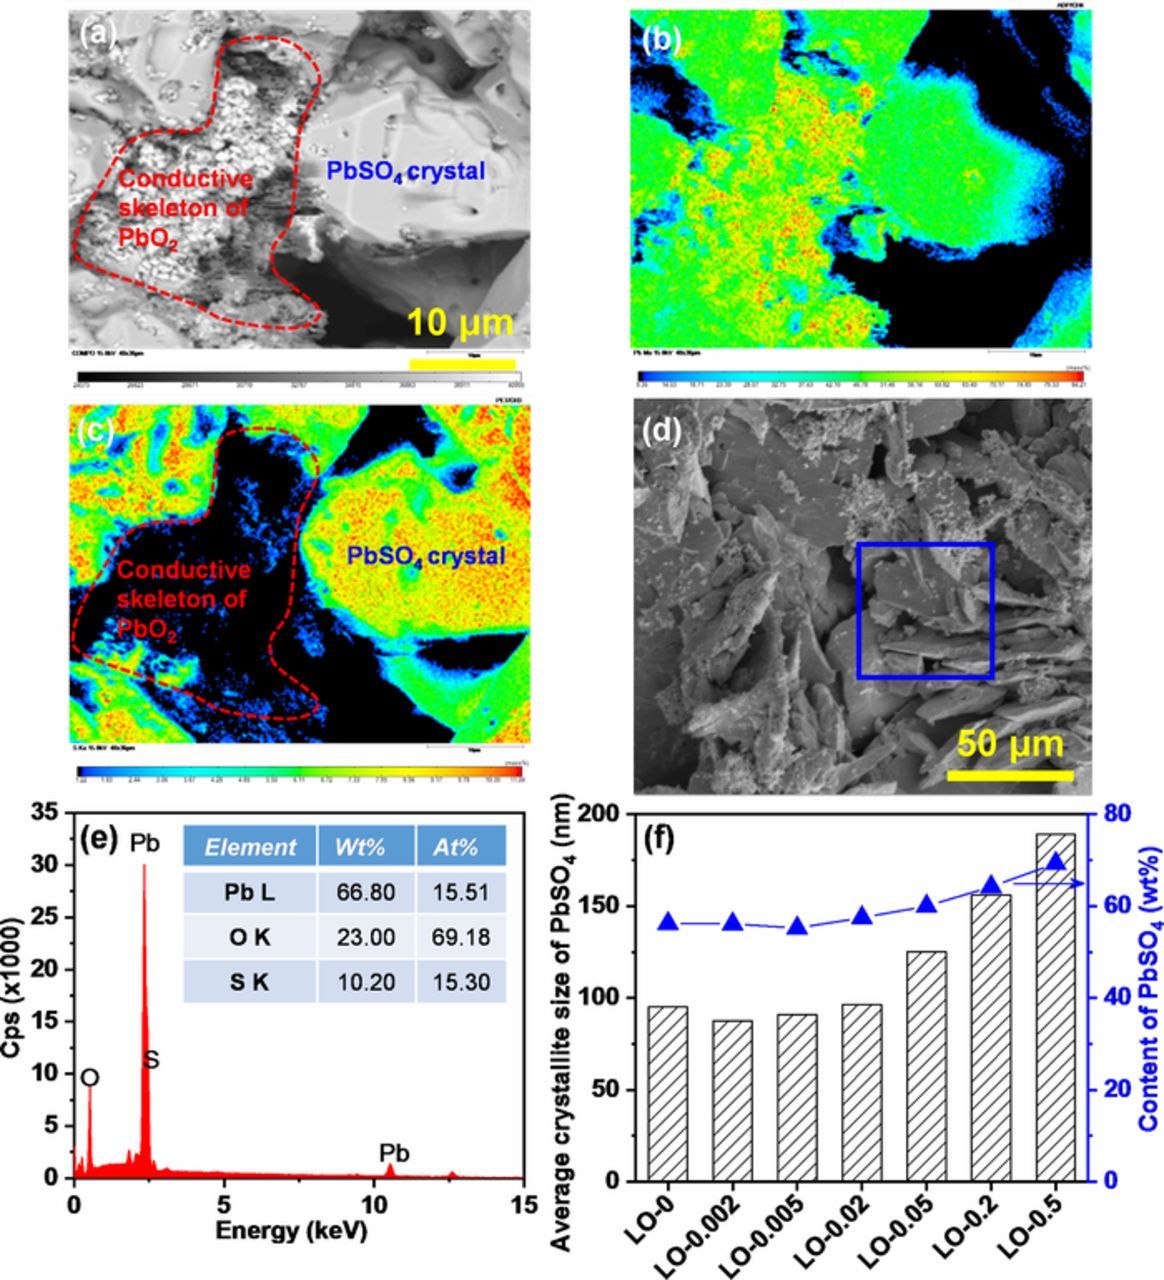
Figure 10. (a) BSE image of the PAM made from LO-0 after discharge ending of 3rd cycle; the corresponding EPMA-WDS mapping of different elements: (b) Pb and (c) S; (d) SEM image of PAM made from LO-0.2 after discharge ending of 3rd cycle, and (e) EDX analysis of the selected zone of the upper SEM image; and (f) the average crystallite size and content of PbSO4 in the PAM after discharge ending of 3rd cycle.
The average crystallite size of PbSO4 was calculated from the XRD patterns using the Scherrer equation.35,36 Figure 10f shows the variation of the average crystallite size of PbSO4 in the PAMs after the discharge ending of 3rd cycle. It can be seen that the PbSO4 crystallite size in the PAMs was increased with the increase of Fe content in the PAMs. Also, those PAMs with higher Fe impurity content contained more PbSO4. This result is also consistent with the SEM images in Figures 10a and 10d.
Effect of iron impurities on the charge-discharge cycle performance of testing cells
Figure 11 shows the initial capacities and cycle performance of the cells assembled from the Fe-containing positive plates. As shown in Figure 11a, when the content of Fe in the synthesized leady oxide was more than 223 mg kg−1 of LO-0.02, the initial capacity of the cells exhibits a decreasing trend. Figure 11b shows the 100% DOD cycle performance of the cells. The curves indicate that the capacity of cell made from LO-0 without Fe impurity kept stable within 200 charge-discharge cycles and its discharge capacity dropped to 1.0 Ah at the 249th charge-discharge cycles. However, the cell made from LO-0.005 exhibits a shorter charge-discharge cycle life, with its capacity decreased from 2.2 to 1.0 Ah after only 230 charge-discharge cycles. In addition, the cycle life of the cells was dramatically shortened with the further increase of Fe content, especially for the cell made from LO-0.05, LO-0.2, and LO-0.5. Figure 11c shows the charging and discharging curves of testing cells assembled from the positive plates made from LO-0 and LO-0.2 in the first charge-discharge cycle. The cell made from LO-0.2 shows faster voltage rise during charging and faster voltage drop during discharging than the cell made from LO-0, indicating that the Fe impurity has a negative effect on the charge storage property of positive plate.
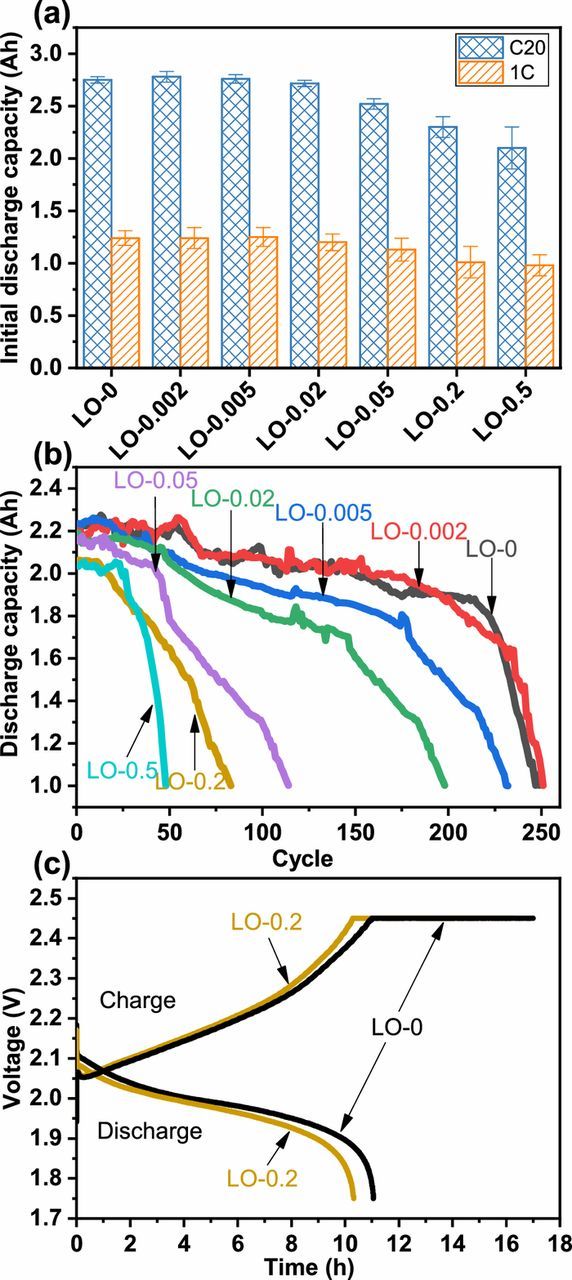
Figure 11. (a) The initial discharge capacity and (b) the 100% DOD cycle performance of the testing cells assembled by the positive plates made from different leady oxide samples; and (c) charging and discharging curves of testing cells assembled by the positive plates made from LO-0 and LO-0.2 in the first charge-discharge cycle.
When the Fe element content in the leady oxide was more than 223 mg kg−1 of LO-0.02, the microscopic morphology and phase composition of the PAMs changed significantly during curing, formation procedures, and charge-discharge cycles. As a result, the initial capacity of testing cell decreased significantly. Besides, the increased hydrogen and oxygen gassing rate caused by Fe impurity aggravated the PAM expansion and shedding during the charge-discharge cycles.16,18 Therefore, the premature capacity loss of the testing cell was observed when the Fe element impurity content in the leady oxide was only 49 mg kg−1 of LO-0.005.
Conclusions
In this work, the Fe-containing leady oxide recovered from the simulated spent lead paste via hydrometallurgical process was used as the raw material for positive plate to investigate the influence of different contents of Fe impurity on the phase composition of positive material during manufacturing procedures of cells (i.e., curing and formation) and charge-discharge cycle of testing cells.
More than 75 wt% of the Fe element impurity in the simulated spent lead paste remained in the synthesized leady oxide product after the hydrometallurgical process with sodium citrate-acetic acid solution. During the curing procedure for positive plate preparation, the content of 4BS in the CPPs significantly decreased when the Fe element content in the leady oxide was more than 223 mg kg−1. The microanalyses of EPMA-WDS results indicate that the generation of 4BS was hindered in the higher Fe areas of CPP. After the formation procedure, the Fe-containing PAMs showed lower specific surface area and contained less α-PbO2. It is notable that the hydrated PbO2 content in the PAMs also showed a decreasing trend with the increasing of Fe content. As a result, the Fe-containing PAMs after discharge consisted of larger PbSO4 crystals, which impeded the diffusion of H2SO4 electrolyte and destroyed the interconnected PbO2 skeleton.
Due to the increased hydrogen and oxygen gassing rate caused by the Fe impurity, the assembled cell experienced a premature capacity loss when the Fe content in leady oxide was only 49 mg kg−1. This study provides an insight into the transformation of Fe impurity in hydrometallurgical recovery process of spent lead-acid battery and effects of Fe impurity on cell performance made from the recovered leady oxide.
Acknowledgments
We appreciate the funding from National Key Research and Development Program of China (2018YFC1900105), Wuhan Yellow Crane Talents (Science) Program and the Innovative and Interdisciplinary Team, HUST (2015ZDTD027). We acknowledge the Analysis and Testing Center of Huazhong University of Science and Technology (HUST) for the materials characterization and analysis support. We also would like to thank Hubei Jinyang Metallurgical Co. Ltd. for the raw materials and financial support.
ORCID
Jiakuan Yang 0000-0002-1936-5646
Bingchuan Liu 0000-0002-6825-3536
Errata
Errata was published for this paper on June 6, 2019. See http://jes.ecsdl.org/content/166/10/X4.