
Abstract
The solid electrode interphase (SEI) on graphite electrodes is important to the performance, calendar life, and safety characteristics of lithium-ion cells. This article examines the SEI formed on binder-free graphite electrodes prepared by electrophoretic deposition. X-ray photoelectron spectroscopy, Fourier transform infrared spectroscopy, and thermogravimetric analysis data were obtained on electrodes cycled in cells containing four electrolytes comprising ethylene carbonate: ethylmethyl carbonate (3:7 by weight) solvent and 
 ,
, 
 ,
, 
 , or
, or 
 salt. Our observations suggest that, in addition to solvent reduction, the reduction of electrolyte salts plays an important role in SEI formation. Mechanisms to account for the formation of these SEI constituents are included in the article.
Export citation and abstract BibTeX RIS
Graphite is widely used as the anode material in commercial lithium-ion batteries. It is well known that the electrolyte components react with the anode surface to form a passivation film, the solid electrolyte interphase (SEI) during initial charging of a lithium-ion battery.1 The SEI layer protects the graphite during subsequent cycling; the composition, morphology, and stability of the SEI are known to critically affect cycling performance and storage life of a lithium-ion cell.2–6
However, there is a continuing debate on the formation mechanisms and composition of the graphite SEI. Various electrolytes have been used in lithium-ion batteries, and the morphology and chemical composition of the SEI are likely dependent on the characteristics of the electrolyte (solvent, lithium salt, and additives).5, 7–15 The standard electrolyte used in commercial lithium-ion cells is a solution of  salt in a mixture of carbonate solvents, including ethylene carbonate (EC) and dialkyl carbonates, such as ethyl methyl carbonate (EMC). Although
  -based electrolytes have the best combination of properties, other electrolytes have been considered because of their unique properties. For instance,
  -based electrolytes demonstrate good thermal stability at elevated temperature, but their conductivities are lower than those of
  -based electrolytes.14 Electrolytes based on the recently developed lithium salts
  (LiBOB) and
  demonstrate excellent ionic conductivity and thermal stability, but their low-temperature performance has been questioned.16–20
A recent investigation of electrode impedance in cells containing  -based composite positive electrodes, mesocarbon microbead (MCMB)-10 graphite-based composite negative electrodes, and electrolytes with 3EC:7EMC solvent and
  ,
,  , LiBOB, and
  salts showed that the electrolyte salt has a strong influence on the impedance of graphite electrodes measured after initial cycling.21 The graphite electrode showed the following impedance trend with salt composition:
  ; that is, the electrode displayed the highest and lowest impedances in cells containing LiBOB and
  , respectively. The study concluded that the nature of the graphite SEI formed in the various electrolytes was an important determinant of the electrode impedance.21 Because electrolyte salt was the only variant, the study postulated that the electrolyte salt has a strong effect on the composition and morphology of the graphite SEI, which is in accordance with the conclusions of other researchers.22–29
Detailed and conclusive analysis of the anode SEI is complicated by the presence of inactive components, such as the polyvinylidene difluoride (PVdF) binder, in conventional composite electrodes. These components often obscure spectral information arising from chemical species in the SEI layer. To alleviate this problem, we developed a binder-free (BF) electrode for the study of graphite SEI layers. Initial data from these electrodes, including materials characterization and electrochemical performance, were reported earlier.15 In this article, we describe the study of SEI layers formed on BF graphite electrodes cycled in cells containing four electrolytes: 
 ,
, 
 ,
, 
 , and
, and  LiBOB in EC:EMC solvent (3:7 by weight). The
 electrolyte was from Tomiyama Chemical Industries (Japan). The high-purity 3EC:7EMC solvent used to prepare the other electrolytes was obtained from Ferro (USA). High-purity
  and
and  salts were acquired from LithChem International and Central Glass Co. (Japan), respectively. The LiBOB salt was obtained from Chemetall GmbH (Germany); the salt was further purified at Argonne by a dissolution∕filtration procedure before electrolyte preparation. The BF graphite electrode samples were examined by Fourier transform infrared spectroscopy (FTIR) with attenuated total reflection (ATR), X-ray photoelectron spectroscopy (XPS), and thermogravimetric analysis (TGA). SEI formation mechanisms were formulated based on these data and are included in this article.
Experimental
The BF graphite electrodes were prepared by electrophoretic deposition (EPD).15, 30 In EPD, colloidal particles suspended in a liquid medium migrate under the influence of an electric field and are deposited onto an electrode. The EPD solution was prepared by dispersing graphite particles (SFG-6, TIMCAL,  ) in anhydrous acetonitrile by ultrasonication. Small amounts
  of triethylamine were added to the EPD bath, to form surface charges on the graphite particles. Copper and stainless steel foils
  were used as cathode and anode, respectively. The graphite particles were deposited on the copper foil by applying a dc voltage of
  for
for  to the electrodes. The graphite electrode, thus prepared, was dried in a vacuum oven at
  to completely remove the residual acetonitrile and triethylamine. The average graphite loading density of the resulting electrode was
  .
.
Cell assembly, galvanostatic cycling, and cell disassembly were conducted in an Ar-atmosphere glove box (
 ,
, 
 ). Electrochemical cycling was conducted using 2032-type coin cells containing small pieces
  of the BF graphite electrode, metallic lithium counter electrode, and Celgard 2325 (
 thick) separator. The coin cells were cycled three times between 2.0 and
  at room temperature with a current density of
  . The cells were then disassembled, and the delithiated graphite electrodes harvested for SEI examination. The cycled electrodes were examined both "as is" ("unrinsed") and after EMC rinsing ("rinsed") to wash off excess electrolyte residue. The samples were rinsed by soaking in
  EMC for
  , after which the EMC was removed by decanting. Fresh BF graphite samples were "dipped" in the various electrolytes and examined to identify characteristic features of the electrolyte residue. All electrodes were vacuum dried overnight at room temperature before examination.
FTIR data provide information on functional groups present in the top  of the graphite electrode, without destroying the surface species. Our FTIR measurements were conducted on a Thermo Nicolet IR 300 spectrometer stored in a glove bag that was purged with high-purity Ar (i.e., the data were collected without any sample air exposure). The spectra were acquired in the ATR mode with
  resolution and 128 total scans. The measurements were conducted at three different spots on the sample to avoid possible error and to examine uniformity of the SEI layer.
After FTIR-ATR, the samples were examined by XPS, which provides information on chemical species present in a  thick layer on the electrode surface. Each sample was exposed to air for a few seconds during insertion into the XPS analysis chamber. The XPS spectra were obtained on a PHI 5500 system using Al
  radiation
  under ultrahigh vacuum conditions; the data were acquired at two different spots for each sample. The C 1s, O 1s, F 1s, P 2p, and B 1s spectra were calibrated based on the C 1s graphite peak binding energy at
  or based on the hydrocarbon peak at
  . Element concentrations were calculated using integrated peak intensities and atomic sensitivity factors from the PHI instrumentation software.
TGA measurements were conducted on rinsed graphite electrode samples to obtain information on volatile organic and inorganic compounds in the SEI. The graphite was removed from the copper current collector in an Ar-filled glove box. The TGA data were collected on a TA Instruments SDT 2900 by ramping the temperature from room temperature to  at a rate of
  . The samples were exposed to air prior to and during the TGA measurements.
Results
Electrochemical cycling
Figure 1 displays the first lithiation–delithation cycle of the BF graphite electrode cells containing various electrolytes; corresponding differential capacity plots are shown in Fig. 2. During the first lithiation, the LiBOB and  cells show a long voltage plateau at voltages of
  , which are not observed for the
  and
and  cells. In Fig. 2, the peak maxima for the LiBOB and
  cells are at 1.75 and
  vs
vs  , respectively. These peaks were observed only in the first graphite-lithiation cycle data [i.e., the peaks are associated with a component (or impurity) in the LiBOB and
  salts that is reduced during the first lithiation cycle].
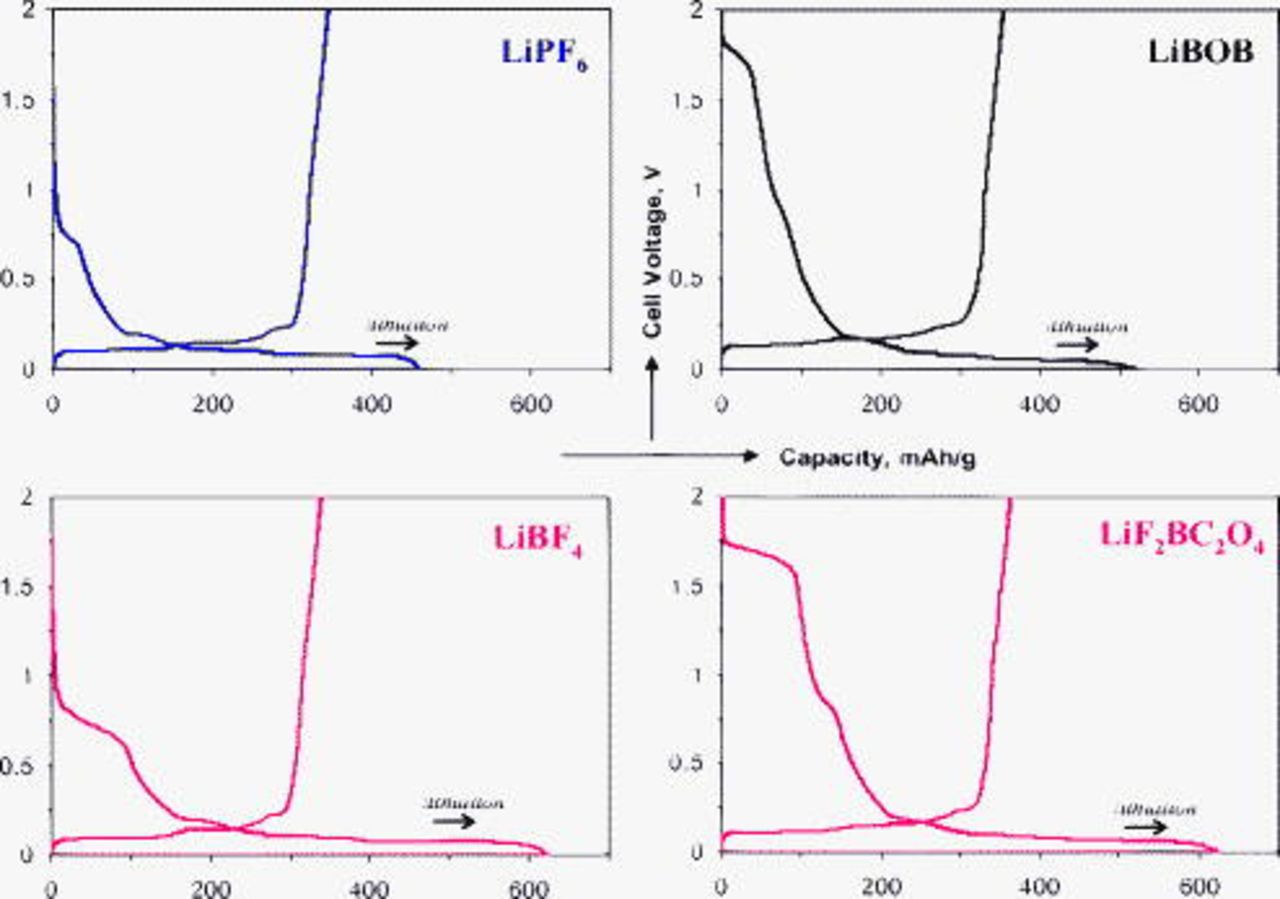
Figure 1. First-cycle lithiation–delithiation data for BF graphite∥Li cells containing various electrolytes. The  -axis shows graphite capacity in milliampere hours per gram and the
  -axis displays the cell voltage.
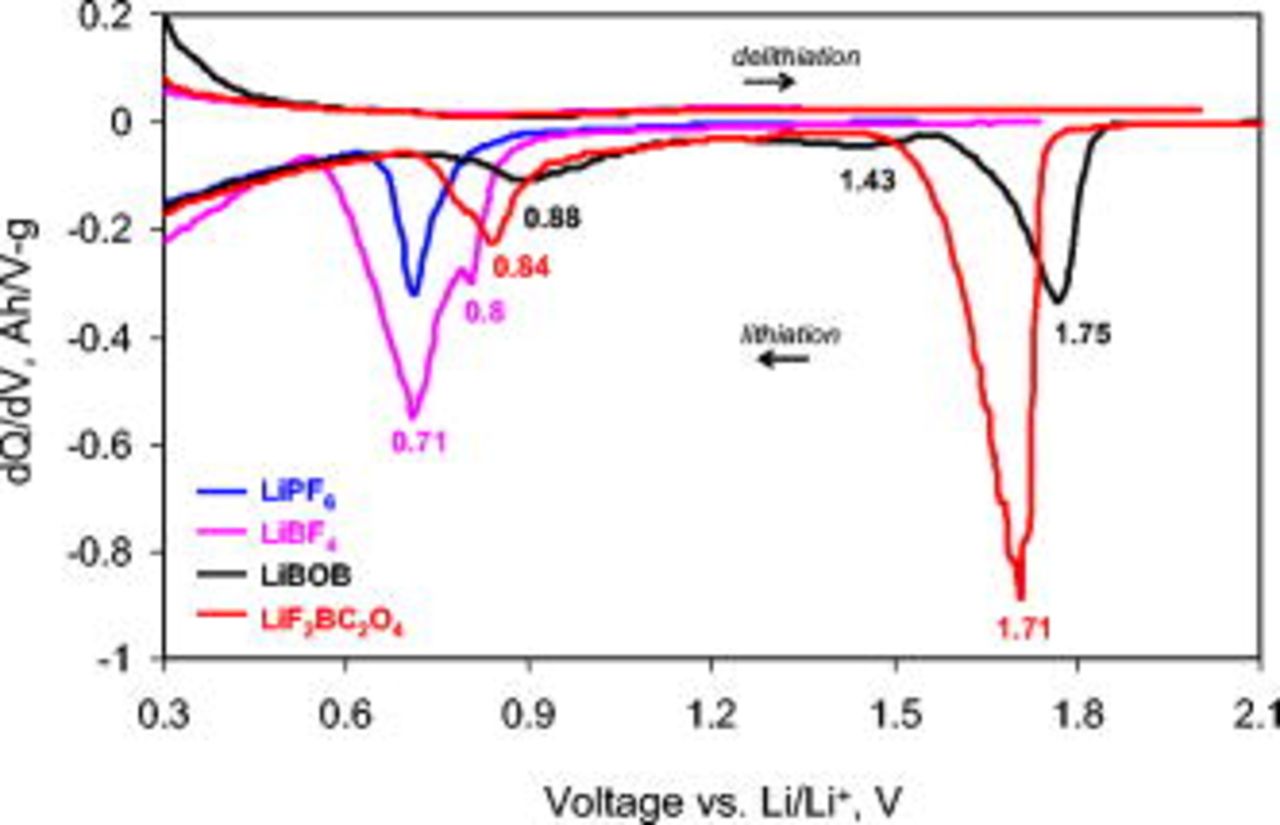
Figure 2. Differential capacity plots, for data shown in Fig. 1, of BF graphite∥Li cells containing various electrolytes. The  -axis voltage range is limited to highlight electrolyte reduction processes. The main graphite lithiation–delithiation peaks, at voltages less than
  , are beyond the scale of this plot.
All cells show voltage plateaus in the capacity plots (Fig. 1) or peaks in the differential capacity plots (Fig. 2) in the  range, corresponding to electrolyte reduction on the graphite negative electrode. These peaks are also observed only during the first graphite-lithiation cycle (i.e., corresponding peaks are not observed during graphite delithiation). In Fig. 2, the peak maximum for the
  cell is at
  vs
vs  . The
. The  cell displays a wider and deeper peak with a shoulder around
  and a maximum at
  . For the LiBOB and
  cells, it is apparent that the high-voltage
  reduction does not suppress further electrolyte reduction on the graphite electrode. The LiBOB electrolyte cells show a small wide peak centered about
  and a larger, broad peak centered about
  . The
. The  cell also shows a broad peak with a maximum about
  vs
vs  . These differences in data for the various electrolytes apparently reflect differences in the SEI formation processes.
All cells exhibited the expected graphite "staging" behavior below  vs
vs  because of the formation of various
  phases
  by lithium intercalation.31, 32 The graphite staging behavior is seen as peaks in the differential capacity plots (Fig. 3). There are obvious differences between the lithium intercalation–deintercalation behavior in the various electrolytes. For example, the LiBOB cell shows stage 1 and 2 peaks at the lowest voltage during lithium insertion and at the highest voltage during lithium extraction. Figure 3 also shows the asymmetric nature of the lithium insertion∕extraction process; the stage 1 lithium extraction peak is observed at a higher voltage than the stage 1 peak associated with lithium insertion. The differences in the voltage profiles during cycling may arise from several reasons that include (i) differences in electrolyte composition, (ii) sample-to-sample variations that produce differences in electrode impedance, etc.
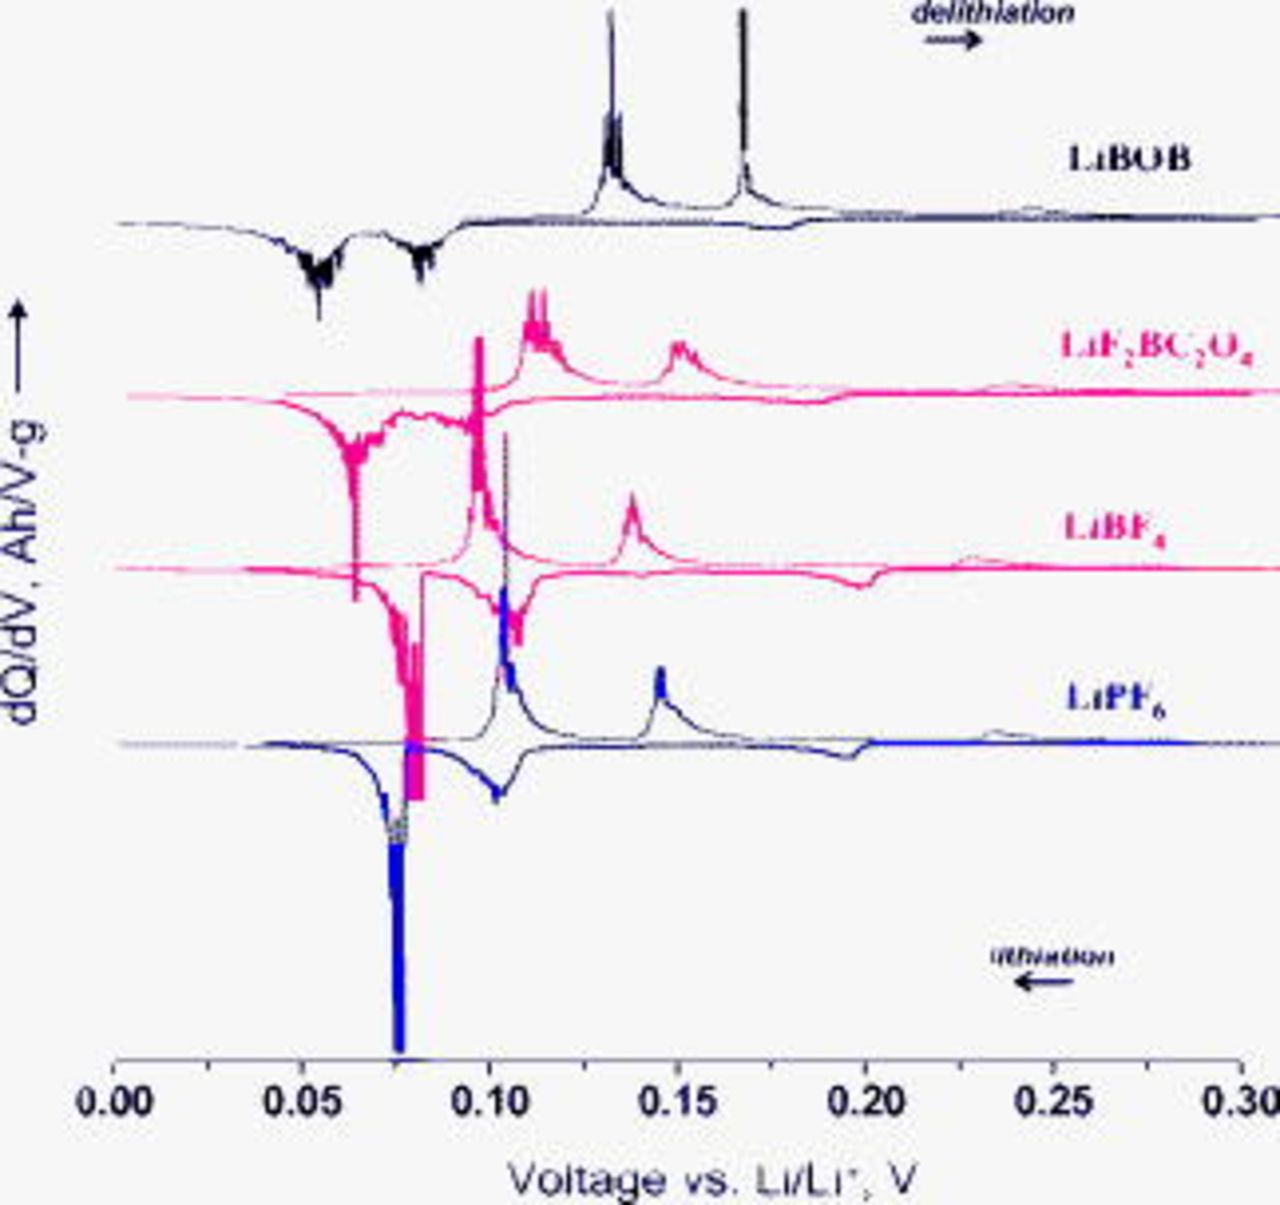
Figure 3. Differential capacity plots showing peaks associated with graphite lithiation–delithiation during the first cycle for BF graphite∥Li cells containing various electrolytes.
In general, the irreversible capacities of the BF graphite electrodes, during the first lithiation–delithiation cycle, are higher than those of traditional composite graphite electrodes. The voltage plateaus during the first lithiation cycle for the BF graphite and composite electrodes appear at the same voltage values for the various electrolytes. However, the plateaus are broader for the BF electrodes probably because of their higher electrochemical surface areas and, therefore, a larger number of graphite sites available for electrolyte decomposition. (The coverage of graphite particles by the PVdF binder in traditional graphite electrodes probably hinders electrolyte decomposition at some of the graphite sites thus reducing the width of the voltage plateau.) The high irreversible capacities of the BF graphite electrodes were observed only during the first cycle. In general, the cycling efficiencies were high (between 95 and 99%) during the subsequent cycles, and the electrodes displayed stable cycling characteristics up to  .15
.15
XPS
XPS data from samples exposed to the various electrolytes are shown in Fig. 4, 5, 6 and 7; the spectral intensities are normalized to highlight peaks in the data. The binding energies (BEs) of the various electrolyte salts are shown in Table I. Variations are often observed between XPS data obtained on the pure salts by different investigators.33, 34 These variations may arise from several reasons that include (i) differential charging, in which BE shifts are induced by the presence of insulating species at the surfaces of conducting electrodes, and (ii) differences in charge-referencing used by the researchers.
Table I. BEs of various electrolyte salts determined by XPS. The data were calibrated based on the C 1s hydrocarbon peak at  .
.
| C 1s | O 1s | F 1s | B 1s | P 
| |
|---|---|---|---|---|---|

| 687.7 | 138.0 | |||

| 687.2 | 195.4 | |||

| 289.8 | 533.7, 532.7 | 193.7 | ||

| 290 | 533.9, 532.9 | 687.2 | 194.7 |
In general, the BF graphite data are simpler to interpret than typical composite electrode data because they do not contain binder peaks in the C 1s and F 1s data. For example, electrodes containing carboxymethyl cellulose display peaks at 286 and  from C–O and
  environments in the binder.4 Electrodes containing PVdF display peaks at 286 and
  in C 1s and at
  in F 1s from C–H and C–F environments, respectively, in the binder.35 In addition, the PVdF binder in composite electrodes is known to soak up the carbonate-rich electrolyte; therefore, carbonate peaks could be intense in the XPS data of composite electrodes. Then again, the overlap of the carbonate peak position in the
  to 291 eV range with the C–F peak position in the PVdF binder complicates the analysis.
Figure 4 shows C 1s, F 1s, P 2p, and O 1s spectra from the BF graphite electrodes after exposure to  electrolyte. The elemental concentrations calculated from the XPS spectra are given in Table II. The dipped samples show peaks associated with graphite (284.5, C 1s) and intensities associated with the electrolyte components. Interestingly, the F 1s and P 2p BE's are observed at 686.9 and
  , respectively, which are different from the values reported for pure
  in Table I. These differences may be due to solvation of
  by solvent (EC) molecules, or may arise from differential charging of
  . The unrinsed samples indicate peaks associated with alkanes (C–H,
  ), ethers or lithium alkoxides (C–O,
  ), and carbonates
  in the C 1s spectrum, in addition to the graphite peak; these additional compounds are electrolyte reduction products generated during the electrochemical cycling. The F 1s spectrum indicates peaks associated with P–F and O–P–F
  , presumably from fluorophosphate and oxyfluorophosphate compounds, and LiF
  formed during cycling. The
  and
and  species in the unrinsed sample are obviously different from the
  electrolyte residue in the dipped sample, as indicated by the difference in F 1s BEs. The peak at
  in the P 2p spectrum most likely arises from P–O functional groups in the oxyfluorophosphate compounds.36 Rinsing in EMC exposes more of the graphite by dissolving electrolyte residue and portions of the SEI. Rinsing decreases the alkoxide and carbonate content in the C 1s spectra, decreases P–F and O–P–F content but increases LiF content in the F 1s spectra, and decreases the P–O content in the P 2p spectra. The reduction in relative oxygen concentration (see Table II) on rinsing is consistent with the removal of oxygen-bearing species.
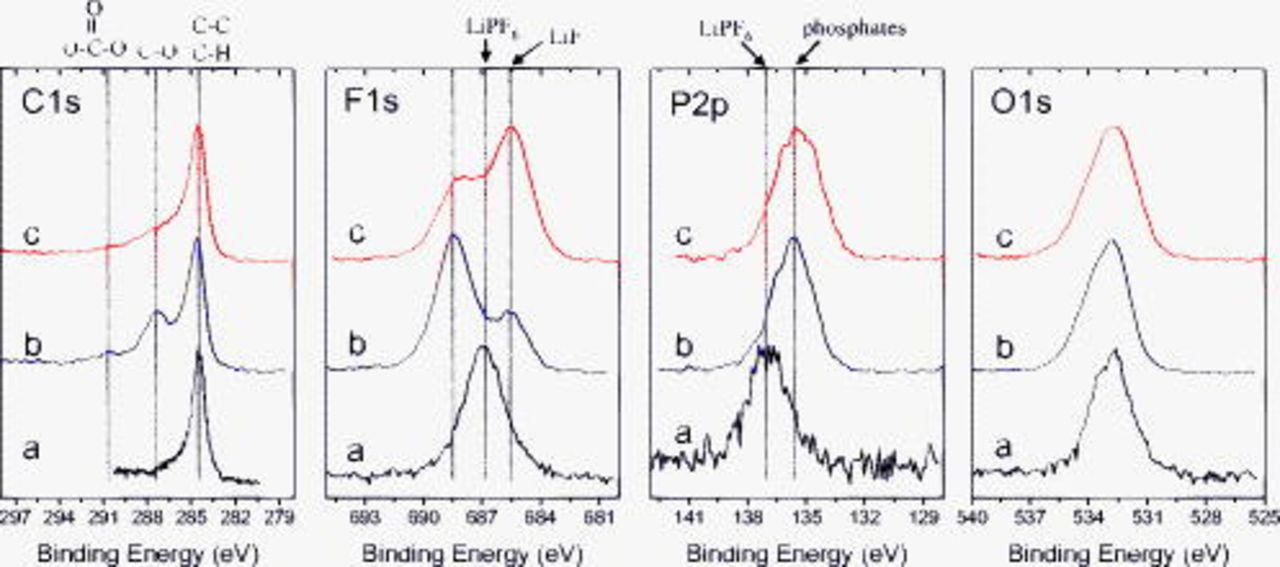
Figure 4. XPS data from BF graphite samples exposed to  electrolyte: (a) dipped, then dried, (b) cycled, but unrinsed, and (c) EMC rinsed.
Table II. Element concentrations (in atomic percent) calculated from XPS spectra of dipped, unrinsed, and rinsed BF graphite samples exposed to various electrolytes.
| Salt | Electrodes | Li 1s | B 1s | C 1s | O 1s | F 1s | P 2p |
|---|---|---|---|---|---|---|---|

| Dipped | 6.8 | – | 19 | 32 | 37.3 | 4.9 |
| Unrinsed | 24.1 | – | 23 | 27.2 | 19.4 | 6.3 | |
| Rinsed | 26.1 | – | 39.2 | 14.4 | 17 | 3.3 | |

| Dipped | 13.4 | 10.8 | 23.1 | 12.6 | 40.1 | – |
| Unrinsed | 15.4 | 9.3 | 29.9 | 18.3 | 27.1 | – | |
| Rinsed | 11.2 | 8.1 | 45 | 22.4 | 13.3 | – | |

| Dipped | 3.2 | 2.8 | 57.7 | 28.2 | 8.1 | – |
| Unrinsed | 14.7 | 6.7 | 36.6 | 31.6 | 10.4 | – | |
| Rinsed | 26.6 | 4.4 | 31.3 | 23.1 | 14.6 | – | |
| LiBOB | Dipped | 9.2 | 0.8 | 68.9 | 21.1 | – | – |
| Unrinsed | 8.3 | 5.5 | 42 | 44.2 | – | – | |
| Rinsed | 8.5 | 0.3 | 49.6 | 41.6 | – | – |
Figure 5 shows C 1s, F 1s, B 1s, and O 1s spectra from the BF graphite electrodes after exposure to the  electrolyte. The dipped samples showed high Li, B, and F concentrations, indicating
  residue (
 , F 1s;
  , B 1s) on the graphite surface. The cycled but unrinsed samples indicate intensities for C–H
  , ethers or lithium alkoxides
  , and carbonates
  compounds in the C 1s spectrum, in addition to graphite. The F 1s spectrum indicates intensities associated with B–F and O–B–F
  , and LiF
  formed during cycling. The intensities at
  in the B 1s spectrum arises from the B–F and O–B–F compounds. Rinsing in EMC exposes more of the graphite by washing off some of the surface compounds, including solvated
  species. Table II shows significant decreases in the relative concentrations of Li and F, and an increase in the oxygen concentration. The intensity of the
  peak in the C 1s spectrum is not altered much by EMC washing, which suggests that the ether linkages probably result from inorganic C–O–B compounds. The rinsed sample intensities are consistent with the presence of LiF,
  , and
, and  species on the sample surface.
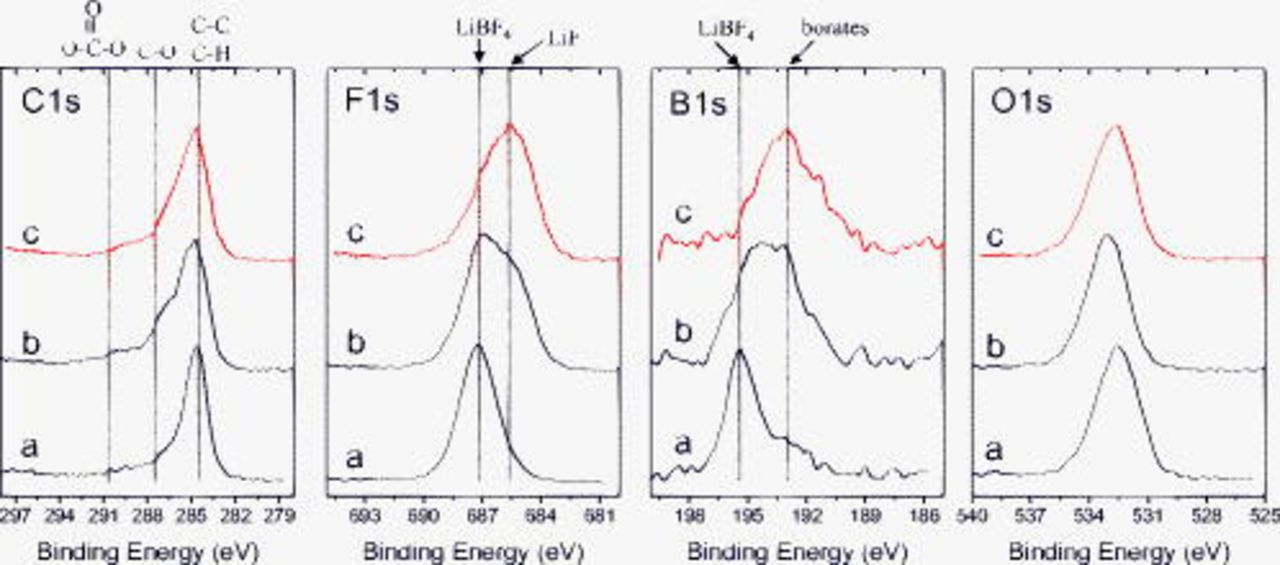
Figure 5. XPS data from BF graphite samples exposed to  electrolyte: (a) dipped, then dried, (b) cycled, but unrinsed, and (c) EMC rinsed.
Figure 6 shows C 1s, F 1s, B 1s, and O 1s spectra from the BF graphite electrodes after exposure to the  electrolyte. The dipped sample data contain peaks associated with the
  salt (
 , C 1s;
  , F 1s;
  , B 1s) along with graphite. The C 1s spectrum of the cycled but unrinsed sample shows significant intensities associated with C–H
  , C–O (ethers or lithium alkoxides, 287.2), and oxalate
  species; the intensity observed in the
  range is from carbonates. The absence of the
  peak indicates that graphite is buried under overlying compounds in the SEI. Significant changes are observed in the data after EMC rinsing. The increase in the relative concentrations of Li and F, and the intensity at
  in F 1s, indicates that more LiF is exposed after rinsing. The C 1s spectrum after rinsing showed an increase in the relative intensity at
  (C–H), but a decrease in the relative intensity at
  (oxalates). However, the data still shows a significant peak at
  , which is associated with lithium oxalate (or alkyl esters of oxalic acid). The graphite peak is not observed even after rinsing, which suggests that the SEI contains carbon-bearing (oligomeric) species that are not soluble in EMC. The B 1s spectra are consistent with the presence of
  and
and  compounds in the SEI.
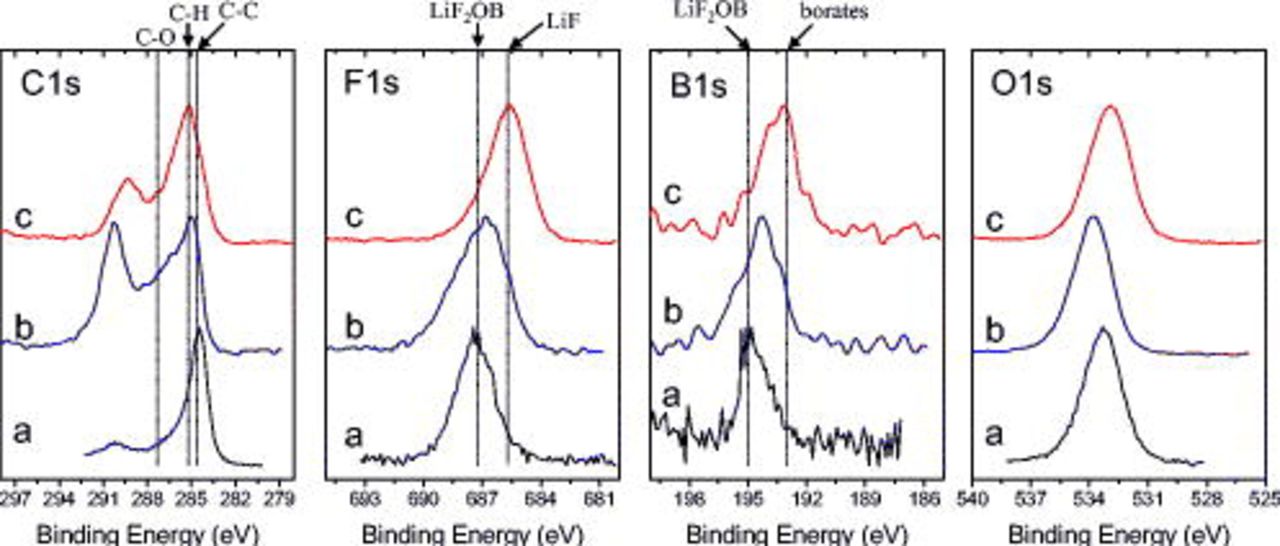
Figure 6. XPS data from BF graphite samples exposed to  electrolyte: (a) dipped, then dried, (b) cycled, but unrinsed, and (c) EMC rinsed.
Figure 7 shows C 1s, B 1s, and O 1s spectra from the BF graphite electrodes after exposure to the LiBOB electrolyte. The dipped sample data contain peaks associated with the LiBOB salt ( , C 1s;
  , B 1s), and graphite. The
  peak is not observed in data from the unrinsed and rinsed samples, which indicates that the graphite is buried under overlying compounds in the SEI. The C 1s spectrum of the cycled but unrinsed sample shows significant intensities associated with C–H
  , C–O (ethers or lithium alkoxides,
  ), and oxalate
  species. On EMC rinsing, the relative concentration of C increases, whereas the relative concentrations of B and O decrease (see Table II). The C 1s spectrum after rinsing shows an increase in the relative intensity at
  (C–H), but a decrease in the relative intensities at 287.5 and
  . Moreover, the data shows a significant peak at
  , which is associated with lithium oxalate (or alkyl esters of oxalic acid).
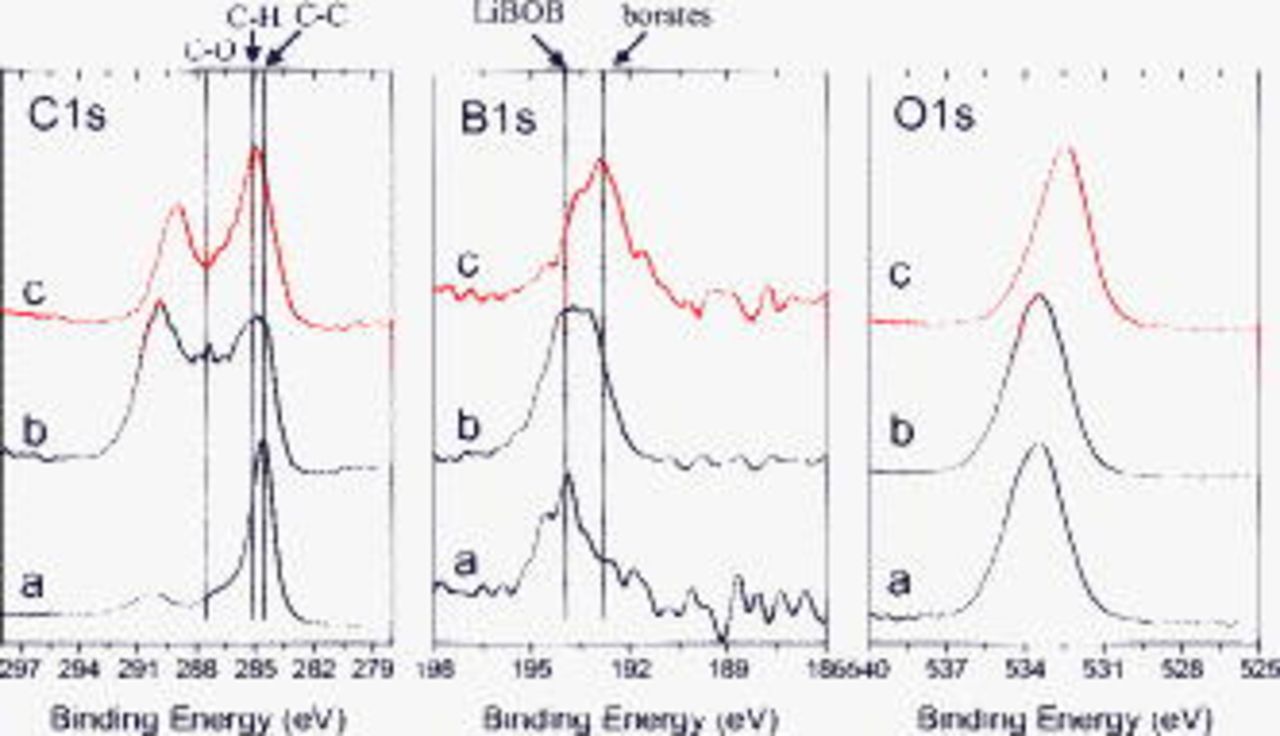
Figure 7. XPS data from BF graphite samples exposed to LiBOB electrolyte: (a) dipped, then dried, (b) cycled, but unrinsed, and (c) EMC rinsed.
FTIR
FTIR data from the samples exposed to the various electrolytes are shown in Fig. 8, 9, 10 and 11. The spectra contain numerous peaks that reflect the presence of organic species on the graphite. A rigorous analysis of these spectra is not possible because several possible species in the SEI have overlapping IR bands. We have attempted to identify possible compounds in the SEI by comparing the BF graphite electrode results with data available in literature8, 37 and with model compound data that we gathered during the course of this study (see Fig. 12). The  ,
,  ,
,  , LiBOB,
  , and
, and  compounds were acquired from commercial suppliers. The
  compound was prepared by a solid-state reaction of
  and
and  , and the
  compound was prepared by reacting
  and
and  .
.
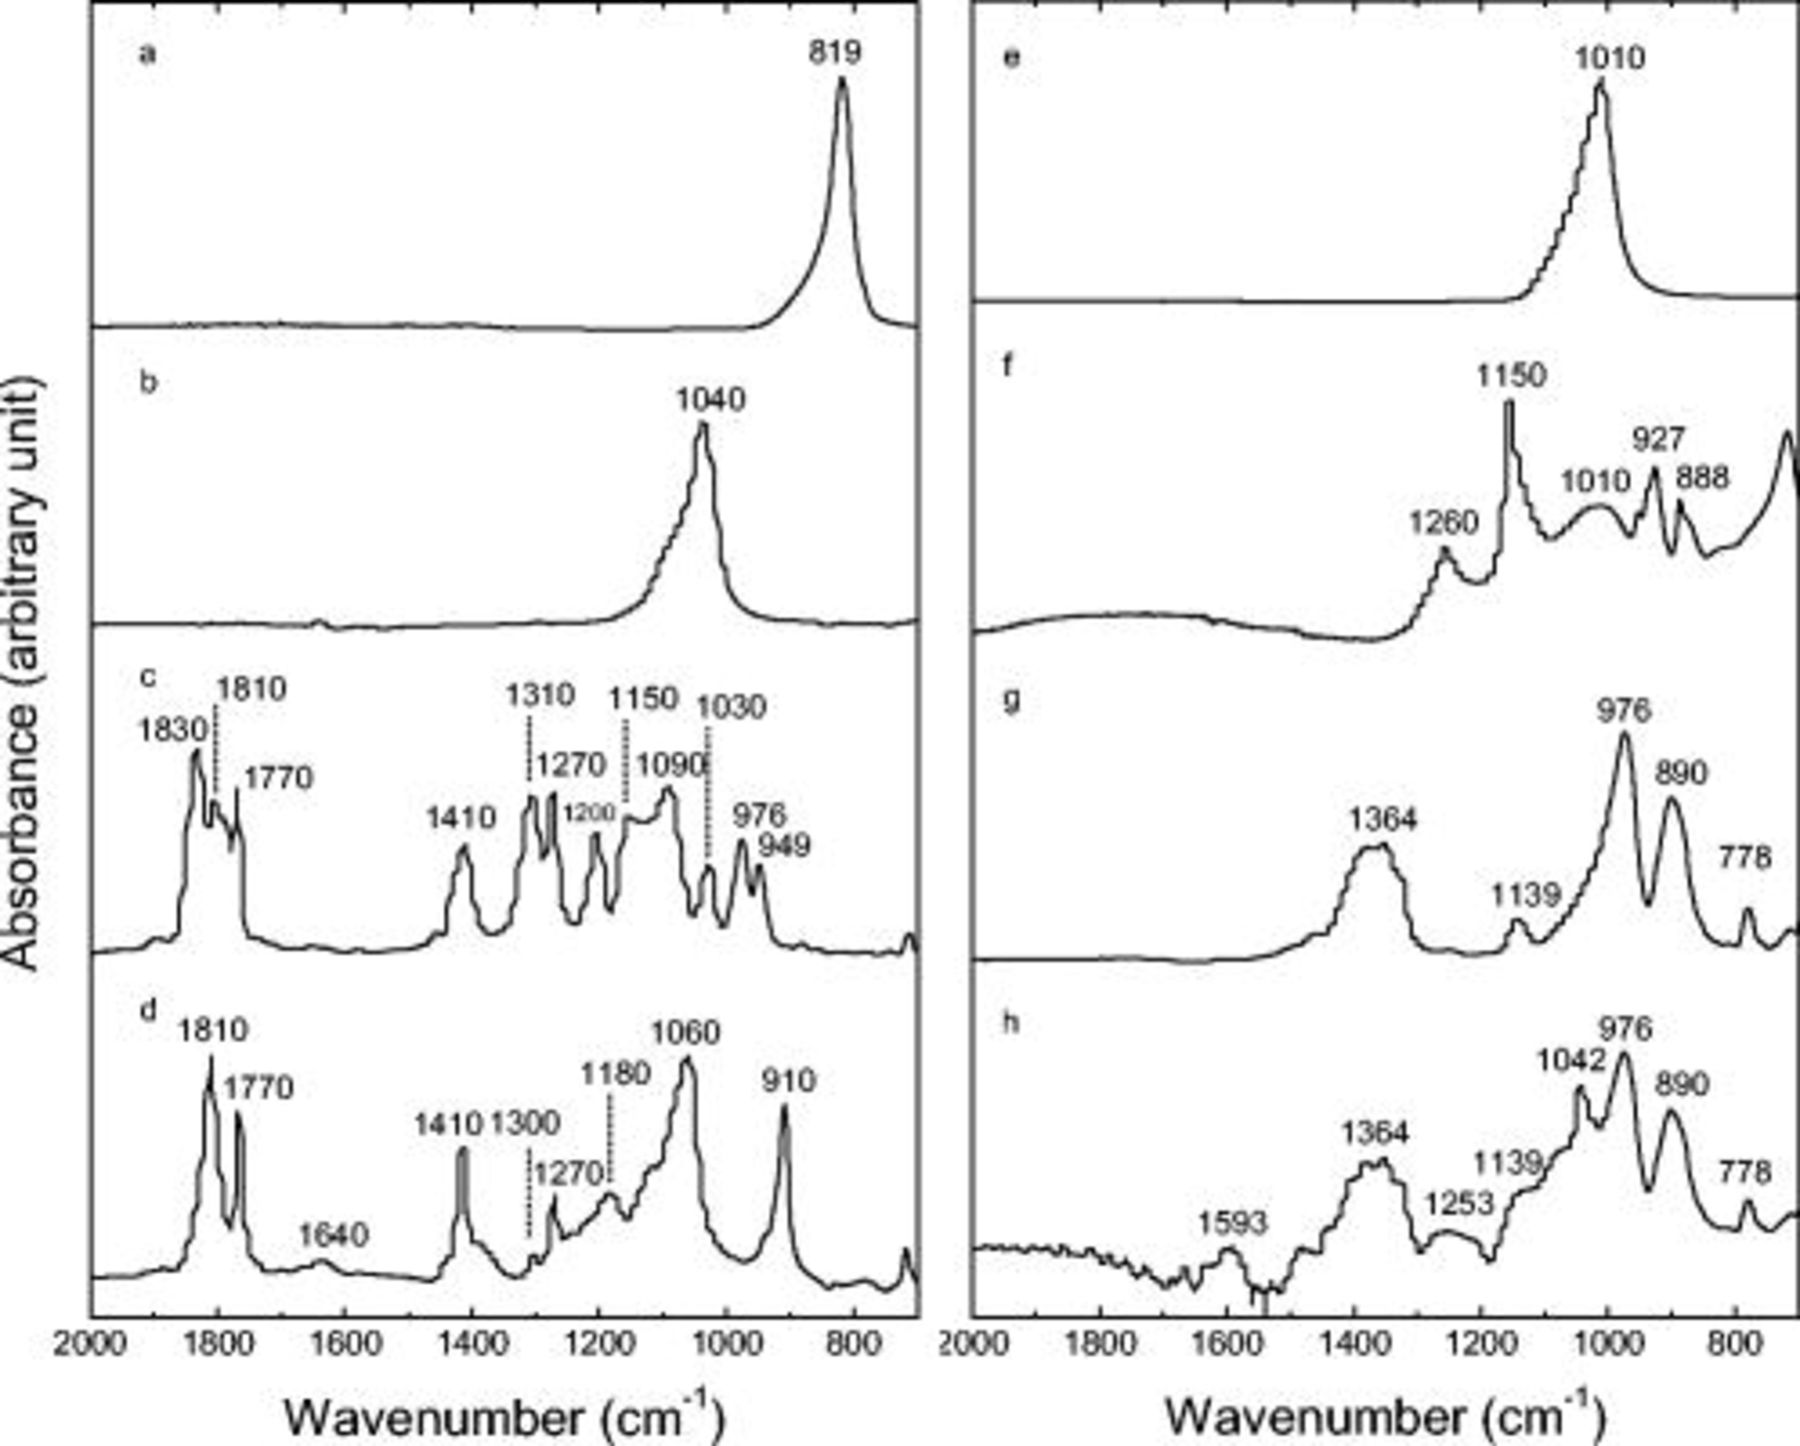
Figure 12. FTIR data from (a)  , (b)
, (b)  , (c) LiBOB, (d)
  , (e)
, (e)  , (f)
, (f)  , (g)
, (g)  , and (h)
  .
.
Figure 8 contains spectra from electrodes exposed to the  electrolyte. The dipped sample contains absorption peaks at 1760
  , 1560, 1480
  , 1400
  , 1190, 1068
  , 830
, 830  , 771
, 771  , and
, and  . By comparison to "model" data from EC and
  , these peaks can be attributed to
  solvates. The unrinsed sample data are similar to the dipped sample data, except that most absorptions appear to be shifted to higher wavenumbers. IR absorptions are fairly sensitive to environment. For example, if a
  bond is coordinated to a metal such as Li, then this will shift the absorption due to a change in the bond-stretching frequency. The small shifts that are observed between the dipped and unrinsed spectra may be due to small differences in the environment of the samples (more or less Li ions, slight difference in charge of graphite, etc.). The presence of lithium alkyl carbonates cannot be confirmed in the data; absorptions from compounds such as lithium ethylene dicarbonate, if present, may be overshadowed by strong absorptions from the
  solvates. The peak at
  is not attributed to
  because
  also shows a very strong absorption at
  , which is not observed.38, 39 This observation is in accordance with previous studies, which concluded that
  in the graphite SEI can be avoided by appropriate cell operation and handling of the electrodes.6, 15 The absorptions in the
  region may be from compounds containing C–O and P–O functional groups, such as lithium alkoxides, lithium alkyl phosphates, or lithium fluorophosphates. In the rinsed sample, the single broad adsorption at
  is attributed to lithium alkyl phosphates
  (
( group) or lithium fluorophosphates
  .
.
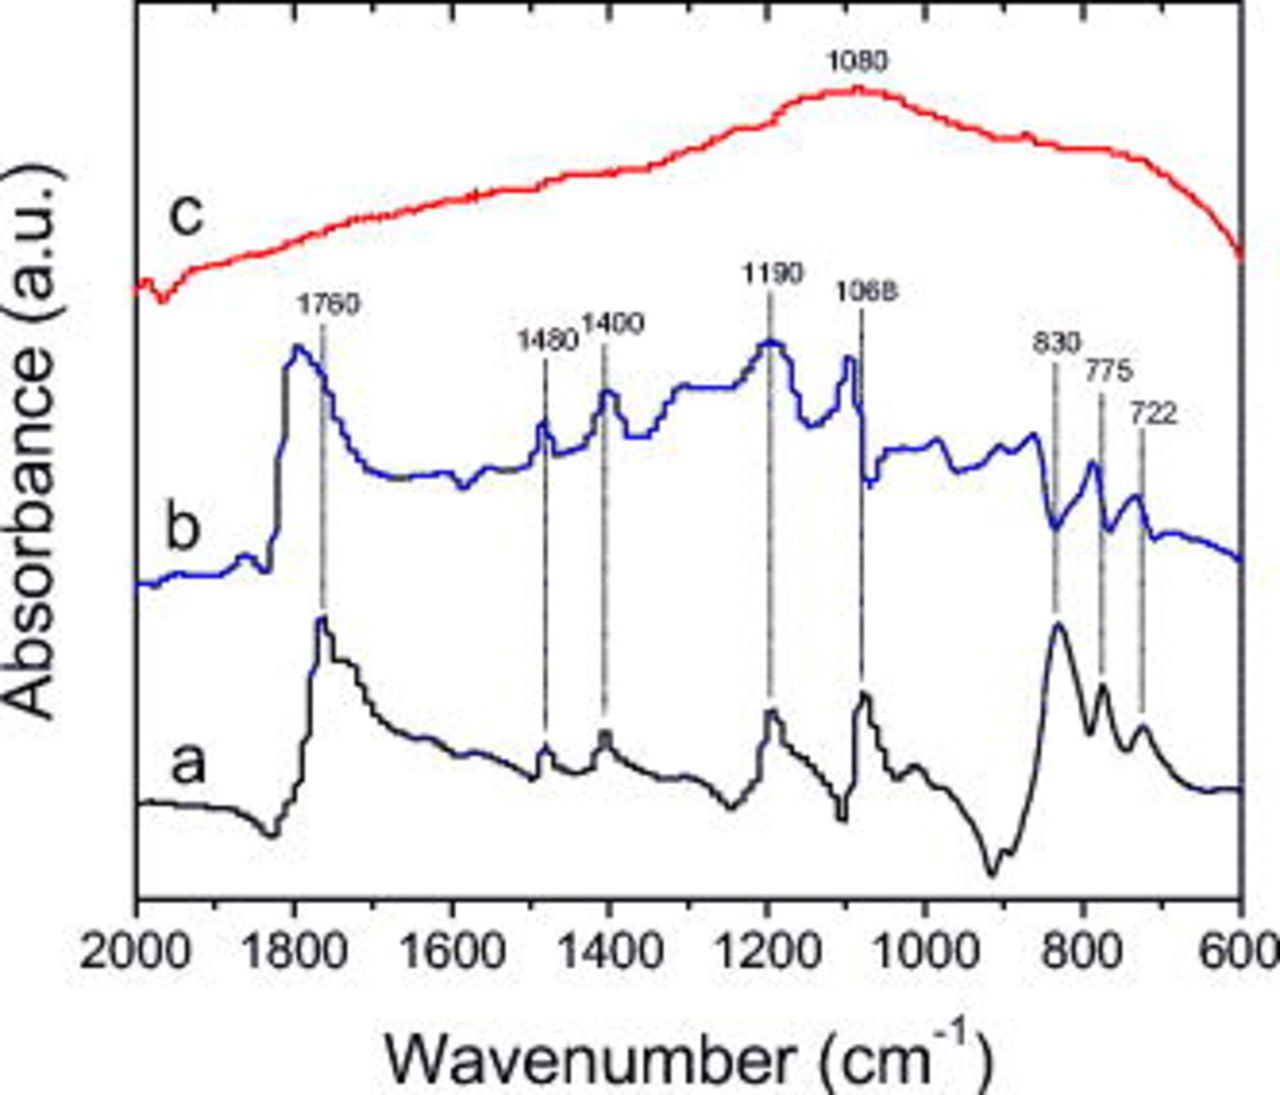
Figure 8. FTIR data from BF graphite samples exposed to  electrolyte: (a) dipped, then dried, (b) cycled, but unrinsed, and (c) EMC rinsed.
Figure 9 contains spectra from electrodes exposed to the  electrolyte. The main absorptions of the
  solvates on the dipped electrode are at 1762
  , 1482
  , 1407
  , 1191
  , 1052
  , 977
, 977  , 901
, 901  , and 771
  and
and  . Although there are small differences in intensities, the absorptions of the unrinsed and dipped electrode are relatively similar. Furthermore, the additional absorptions in the unrinsed sample are similar to the absorptions that are retained after rinsing the electrode, which indicates that sample rinsing removes most of the residual
  solvate. The rinsed electrode spectrum supports the existence of B–O or B–F linkages in borates or fluoroborates (broad peak
  ) and alkyl orthoborates such as
  or
or  (1355, 1260, and
  ).8 The broad peak centered around
  suggests the presence of compounds bearing carbonyl bonds. The unrinsed sample has an additional peak at 1160, probably a C–O stretch from either an ether or an alkoxide that is washed away on rinsing. In general, the data show that absorptions characteristic of C–H or
  bonds (other than those from the electrolyte residue) are weak. That is, the graphite SEI generated during cycling in the
  electrolyte shows high concentrations of inorganic borates
  or lithium fluoroborates
  and low concentrations of organic compounds on the SEI surface.
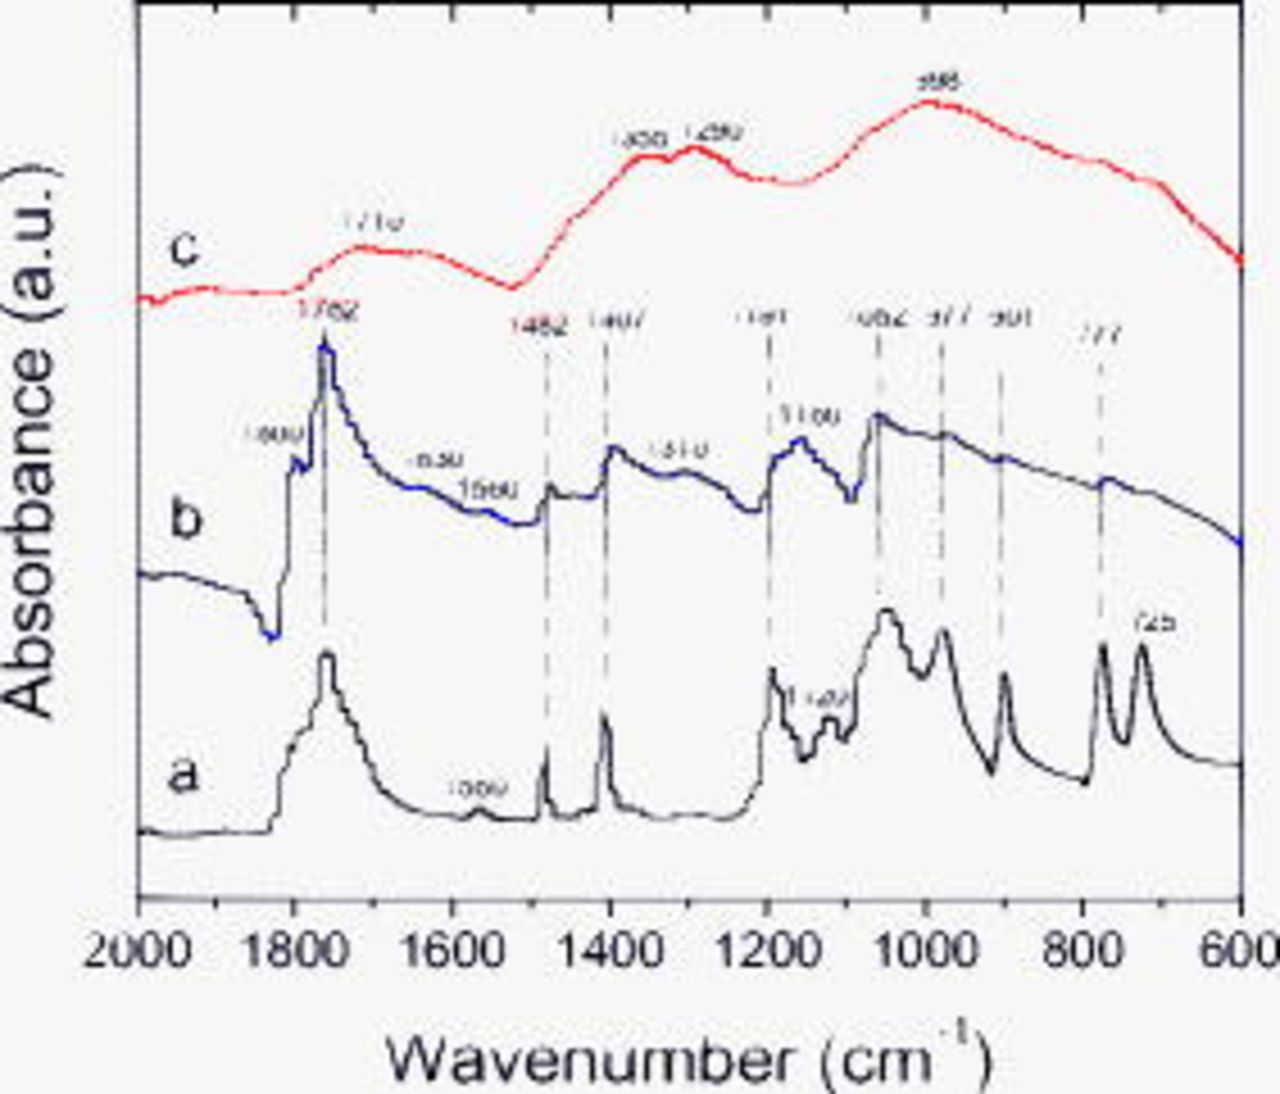
Figure 9. FTIR data from BF graphite samples exposed to  electrolyte: (a) dipped, then dried, (b) cycled, but unrinsed, and (c) EMC rinsed.
Figure 10 contains spectra from electrodes exposed to the  electrolyte. The main absorptions from
  solvates are at 1810, 1780
  , 1722
  , 1480
  , 1430, 1358
  , 1240, 1213
  , 1140, 1091
  , 1052
  , 957
, 957  , 904, 784
  , and
, and  . Many of the absorptions in the unrinsed electrode spectrum may be associated with
  solvates; the remaining resonances are similar to the absorptions observed in the rinsed samples. After EMC rinsing, the remaining surface species on the electrode have absorptions characteristic of lithium oxalate (1633, 1327, and
  ), B–O–B, C–O–B, and B–F linkages (1006, 938, and
  , respectively), and alkanes. The broad peak centered around
  suggests the presence of compounds bearing carbonyl bonds. The unrinsed sample has an additional peak at 1160, probably a C–O stretch from either an ether or an alkoxide that is washed away on rinsing. The IR data, in conjunction with the XPS data, support the presence of lithium oxalate (or alkyl esters of oxalic acid), and various B-containing species, including tri-coordinated borates and
  in the SEI.
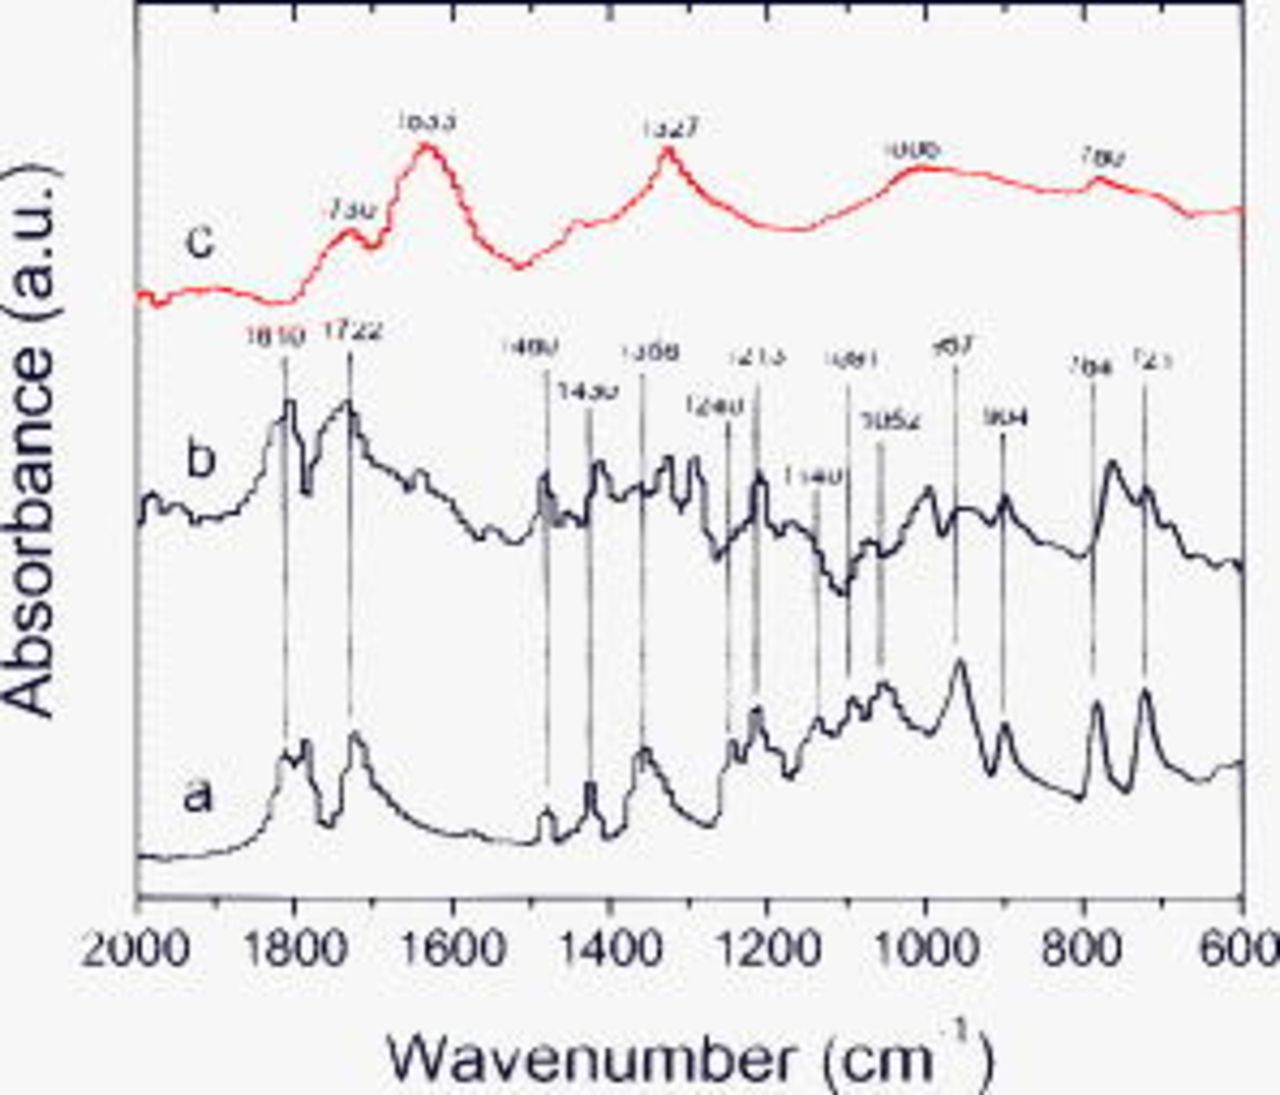
Figure 10. FTIR data from BF graphite samples exposed to  electrolyte: (a) dipped, then dried, (b) cycled, but unrinsed, and (c) EMC rinsed.
Figure 11 contains spectra from electrodes exposed to the LiBOB electrolyte. The main absorptions from  solvates are at 1809
  , 1754
  , 1479
  , 1408
  , 1288
  , 1200
  , 1083
  , 987
, 987  , 898
, 898  , 772
, 772  , and
, and  . The spectrum of the unrinsed electrode is similar to that of the dipped electrode; the additional peak at
  , similar to that observed for
  and
and  , is probably a C–O stretch from either an ether or an alkoxide that appears to be washed away on rinsing. Compared to the unrinsed spectrum, the rinsed data contains fewer peaks, which indicates that the electrolyte residue and possibly a portion of the SEI are washed away. The peaks at 1810 and
  suggest the presence of compounds bearing carbonyl bonds. Absorptions characteristic of lithium oxalate (1626, 1320, and
  ), B–O–B linkages
  , and hydrocarbons (2913 and
  ) are also observed in the data. The rinsed data are similar to that obtained for the
  sample and support the presence of lithium oxalate (or alkyl esters of oxalic acid), various B-containing species, including tri-coordinated borates and
  in the SEI.
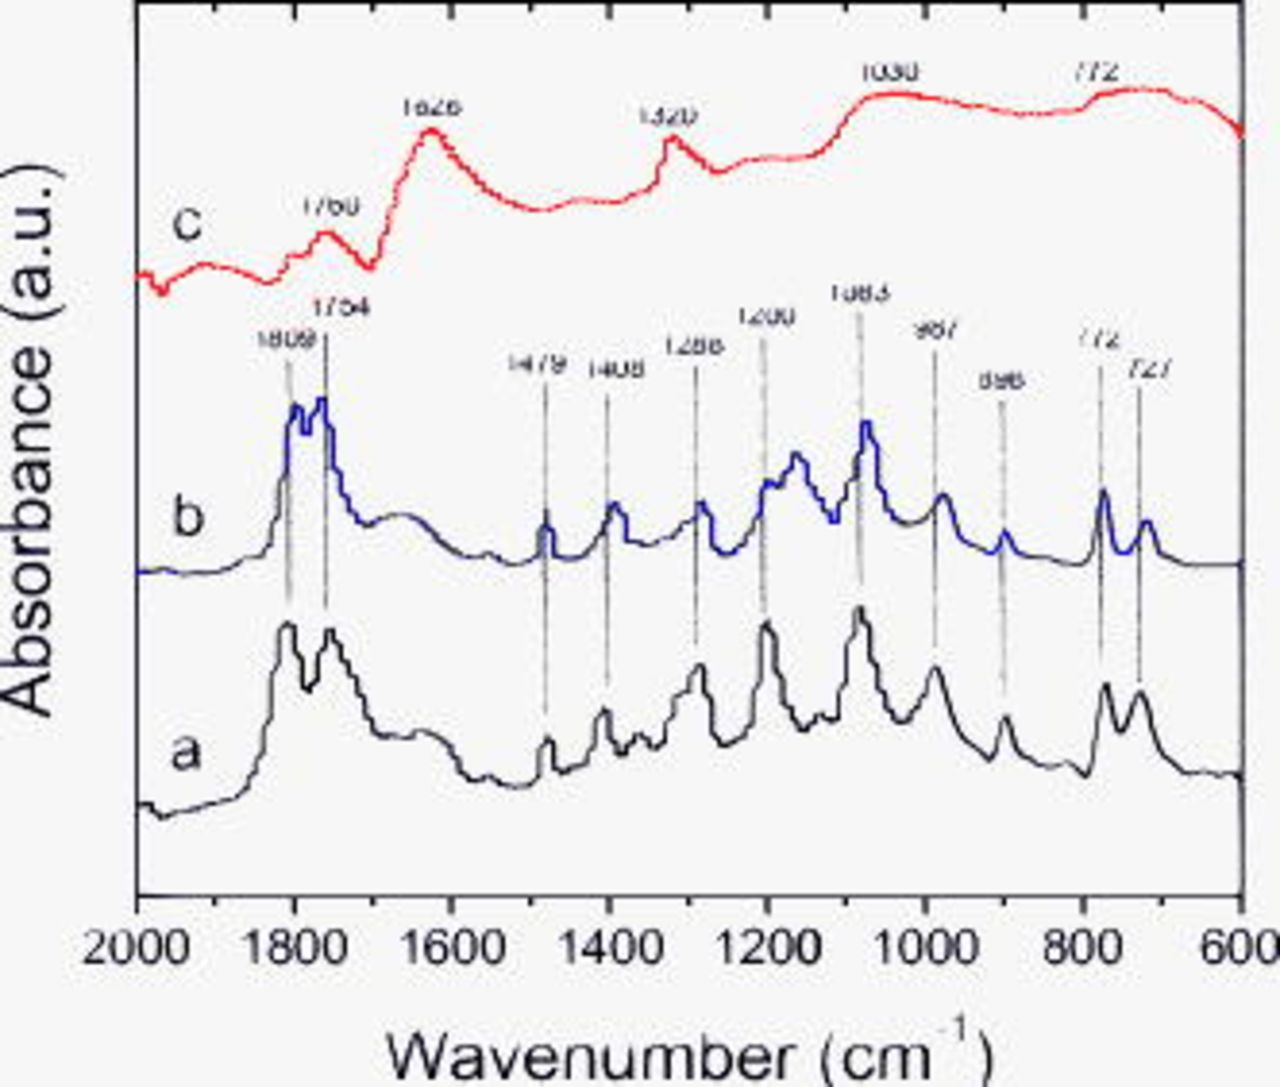
Figure 11. FTIR data from BF graphite samples exposed to LiBOB electrolyte: (a) dipped, then dried, (b) cycled, but unrinsed, and (c) EMC rinsed.
TGA
TGA data, obtained on graphite powders from the rinsed electrodes, are shown in Fig. 13 and 14. The  , LiBOB and
  samples show a small weight gain (up to 2%) on initial heating with a peak maximum around
  (Fig. 13), which may be related to reaction of the SEI with oxygen in air. On heating past
  , all samples show gradual and similar weight loss (to
  ). The weight-loss characteristics of the various samples differ significantly beyond
  . The weight loss is greatest for the LiBOB sample, which suggests large concentrations of oligomers∕organic species on the electrode surface. In contrast, the weight loss is relatively small for the
  and
and  samples, which indicates low concentrations of organic compounds in these samples. The
  data show an intermediate weight loss, which suggests that the SEI has less oligomers∕organics than the LiBOB sample but much more than that on the
  and
and  samples.
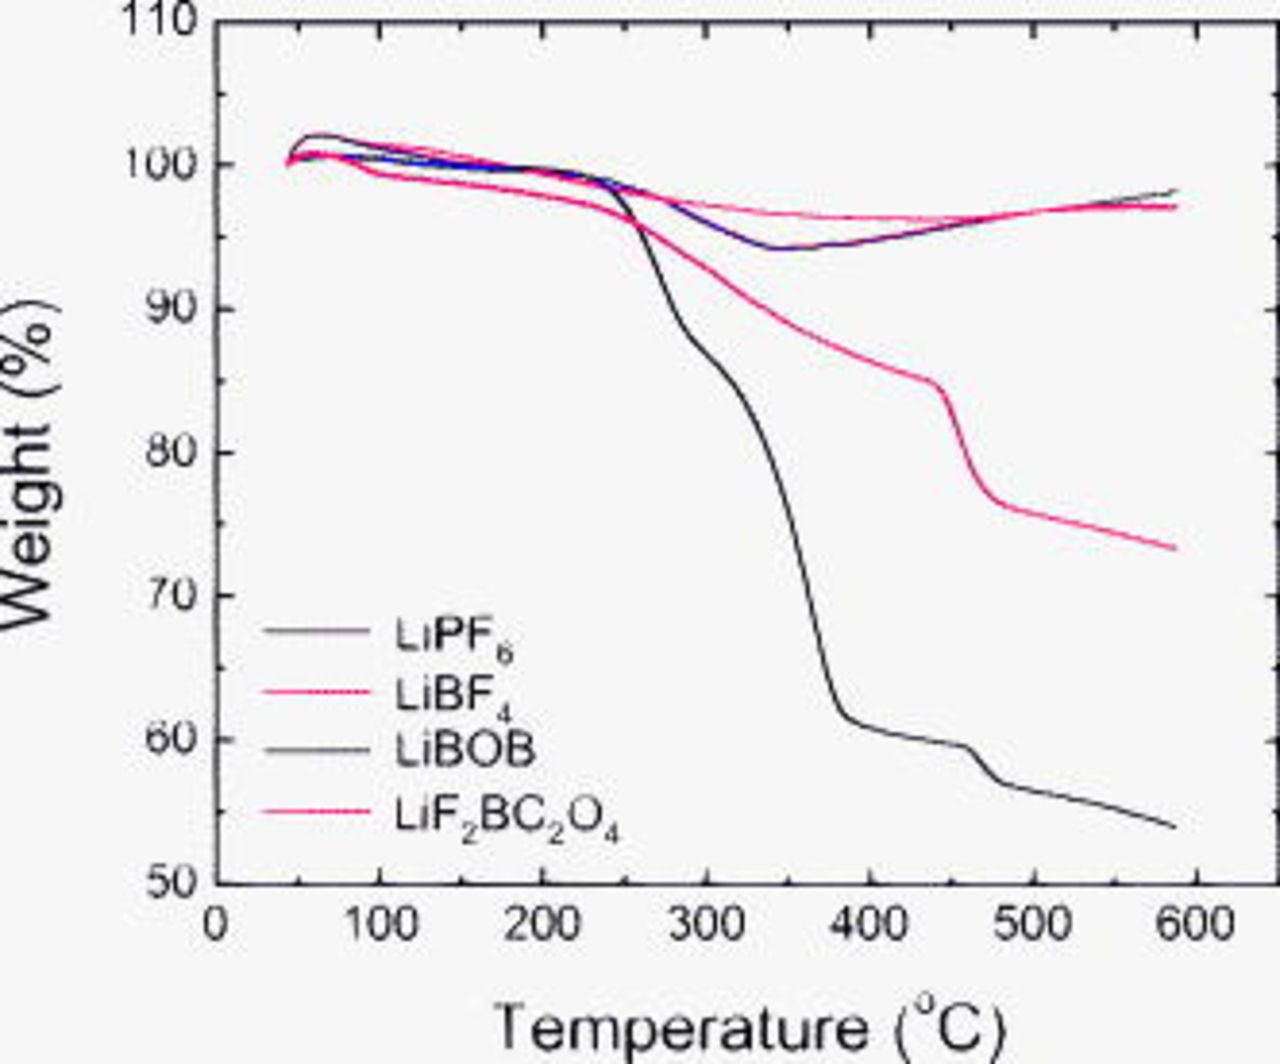
Figure 13. TGA weight change data from graphite samples removed from EMC-rinsed electrodes that were cycled in various electrolytes.
Figure 14, which is a plot of the weight-loss derivative as a function of temperature, provides another perspective on the TGA data. The peaks in the data are associated with the decomposition of SEI component(s) in a particular temperature range. For example, both the LiBOB and  data show a peak
  , which can be attributed to the thermal decomposition of lithium oxalate in the SEI. (TGA data from high-purity lithium oxalate was obtained to confirm this assignment.) The LiBOB data also shows distinct peaks centered near
  and
and  . The LiBOB salt is known to be thermally stable up to
  and loses weight beyond this temperature through the evolution of CO and
  . However, the XPS and FTIR data indicate that rinsing washes away most of the electrolyte residue. Therefore, the LiBOB data peaks are not likely to be from the salt, but rather from various oligomers, trigonal borates, or organoborate compounds in the SEI. The peak centered near
  may have minor contributions from the residual salt solvates. The
  sample data show several small peaks between 250 and
  , possibly resulting from the decomposition of various oligomers, and trigonal borate or organoborate compounds. There may be minor contributions from the electrolyte residue because the
  salt is known to decompose above
  . Distinct peaks are not seen in the
  sample data, which suggests low concentrations of organic species in the rinsed-electrode SEI. The small peaks observed in the
  sample data between 225 and
  may be associated with alkyl phosphates on the graphite surface.
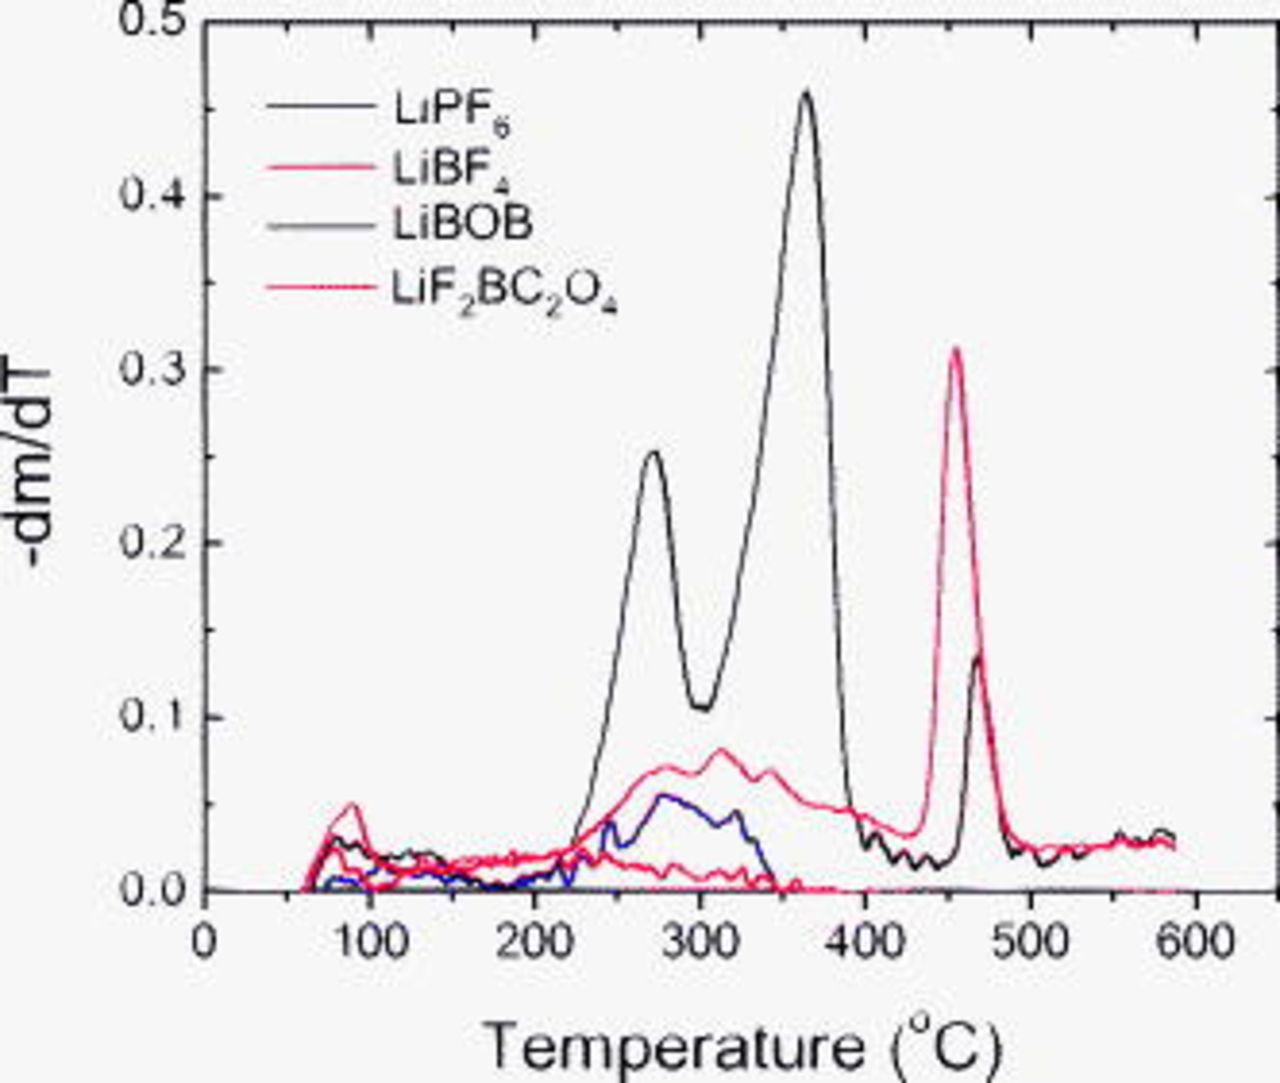
Figure 14. The derivative of the weight change data (shown in Fig. 13) as a function of temperature. Peaks in the data are associated with the decomposition of SEI constituents.
Discussion
It is apparent from the data that there are differences between the constituents of the graphite SEI formed in various electrolytes, which indicates differences in the mechanisms of SEI formation. All SEIs contain constituents that are soluble in EMC and other constituents that are insoluble in EMC. Although most soluble components are precipitated salt-solvent complexes, some of the SEI constituents are also soluble in EMC. Many of the peaks associated with the soluble SEI constituents are structurally similar to previously reported solvent reduction products, such as lithium alkoxides and lithium alkyl carbonates. Proposed mechanisms of formation for these soluble compounds have been described previously.40, 41 The spectral data of the insoluble components of the SEI are very different for the different electrolytes indicating the presence of different compounds and, hence, different formation mechanisms.
The formation mechanisms also have to account for observations on graphite electrodes harvested from cells that underwent only formation cycling.42 The harvested graphite electrodes were rinsed in EMC, incorporated into new cells, and cycled with a lithium counter electrode. These cells did not show the electrolyte reduction peaks in the differential capacity plots ( vs
vs  ) that are observed during the first graphite lithiation cycle. Because EMC rinsing washes away a portion of the SEI layer (along with the electrolyte residue), it is apparent that the EMC-soluble SEI does not passivate the graphite surface. Rather, the SEI remaining after washing (i.e., the EMC-insoluble SEI) inhibits further electrolyte reduction on the graphite probably by modifying∕functionalizing the graphite edge planes.
Typically, the SEI is attributed to the solvent reduction at the graphite surface. However, our various observations indicate that electrolyte salt reduction must also play a major role in SEI formation.25–29, 40 We propose the following SEI formation mechanisms that show the interactions between salt and solvent components during electrolyte reduction to explain our various data (see Fig. 15, 16, 17 and 18).
For  electrolytes the reduction of
  coupled with a ring-opening reaction of EC allows for the generation of
  ,
,  , ethylene, and LiF (Fig. 15). The LiF precipitates while the
  increases the internal pressure of the cell. The
  reacts further with the carbonate solvents to generate related
  and
and  while the ethylene is polymerized to generate polyethylene.43 For
  electrolytes the reduction of
  coupled with a ring-opening reaction of EC will be different since
  species are not stable. Therefore, the reaction forms
  linear polymeric structures along with
  , ethylene, and LiF (Fig. 16). These polymeric structures could also have significant cross-linking via loss of the remaining fluorine∕oxygen exchange reaction on boron.
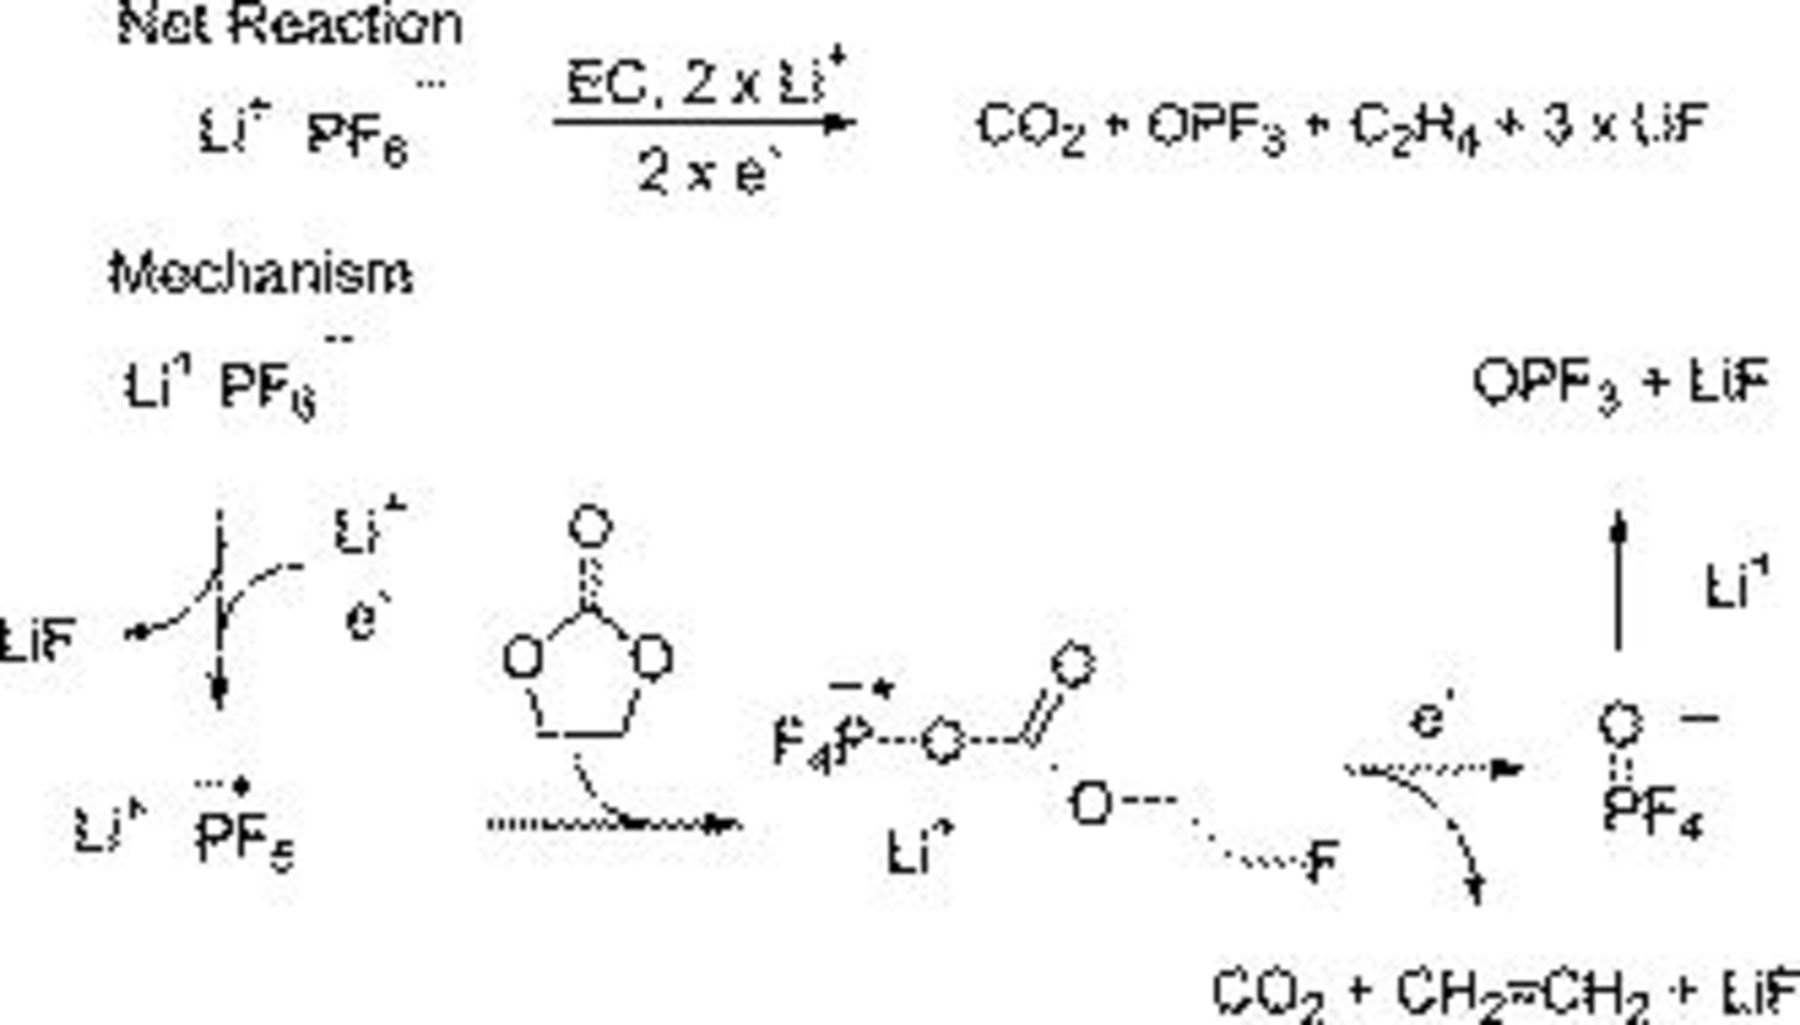
Figure 15. Reaction mechanism postulated to explain the formation of SEI constituents in the  electrolyte.
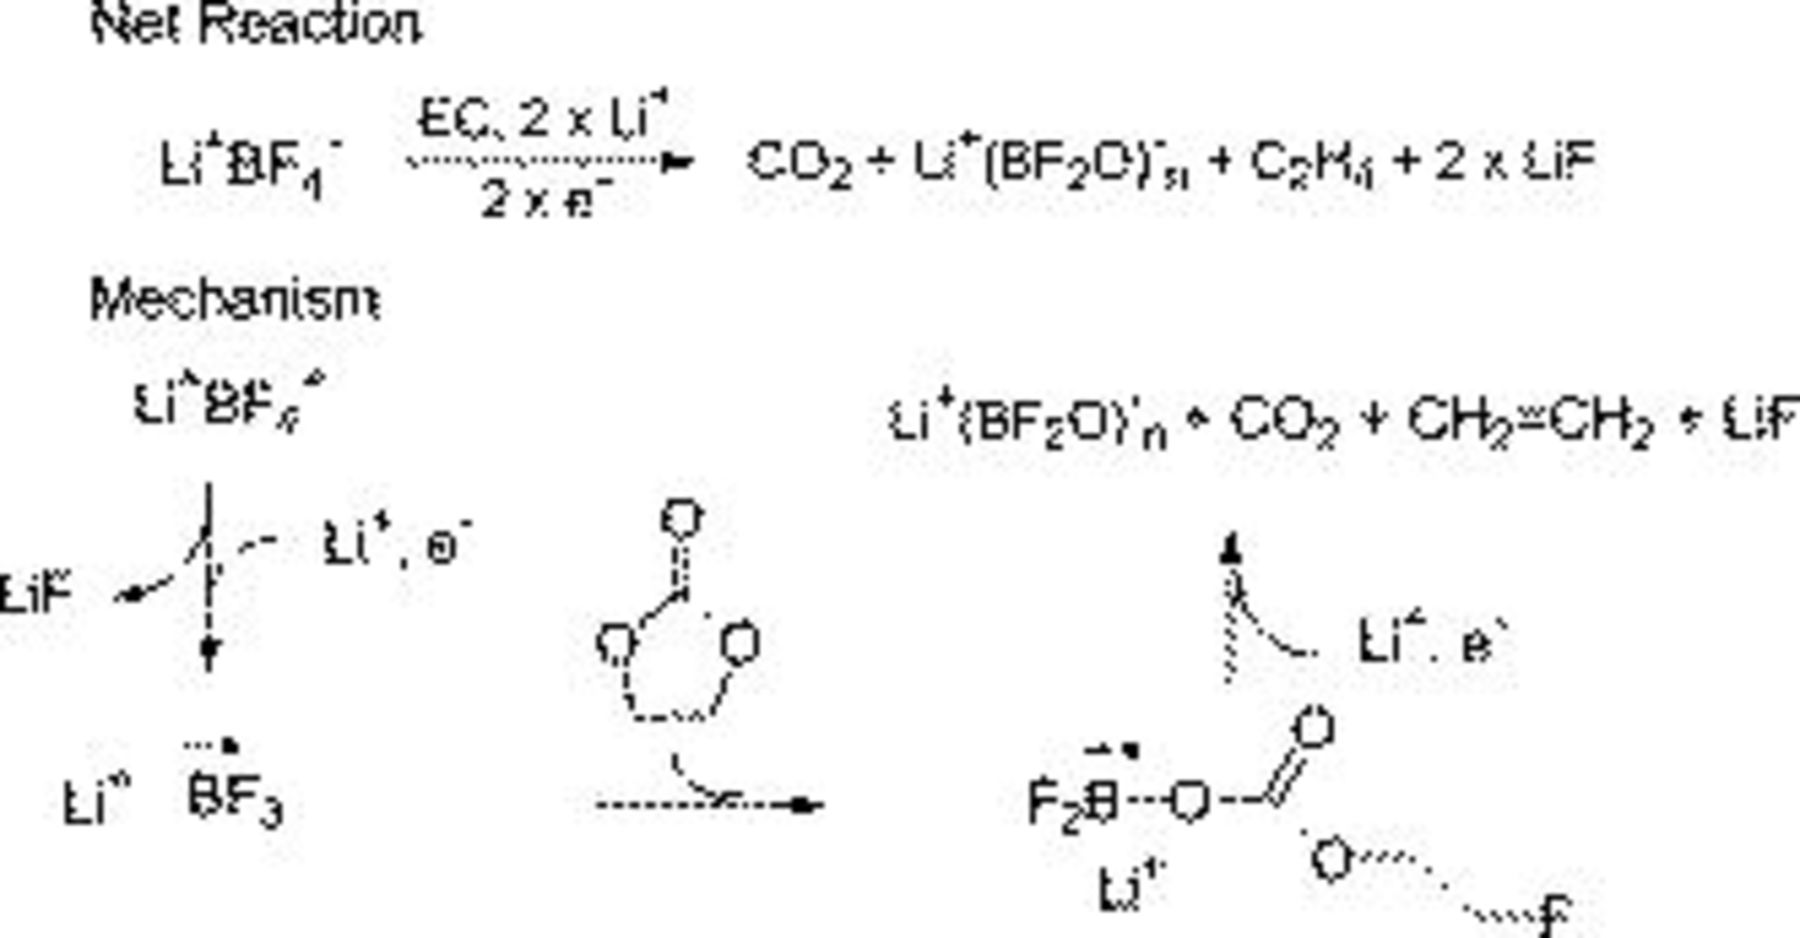
Figure 16. Reaction mechanism postulated to explain the formation of SEI constituents in the  electrolyte.
The reduction of  induces a ring-opening reaction of the salt, which coupled with a ring-opening reaction of EC generates a
  polymer and
  (Fig. 17a); an alternative reaction route generates the linear borate with an oxalate ligand on B and LiF (Fig. 17b). The presence of LiF in the XPS data suggests that Fig. 16b is a more likely reaction route. Partial ring opening of the LiBOB molecule on reduction coupled with EC ring-opening reaction generates a linear borate with an oxalate ligand and
  (Fig. 18). In addition, one would expect to observe additional reactions resulting from the ring opening of the oxalate ligand.

Figure 17. Reaction mechanisms postulated to explain the formation of SEI constituents in the  electrolyte.
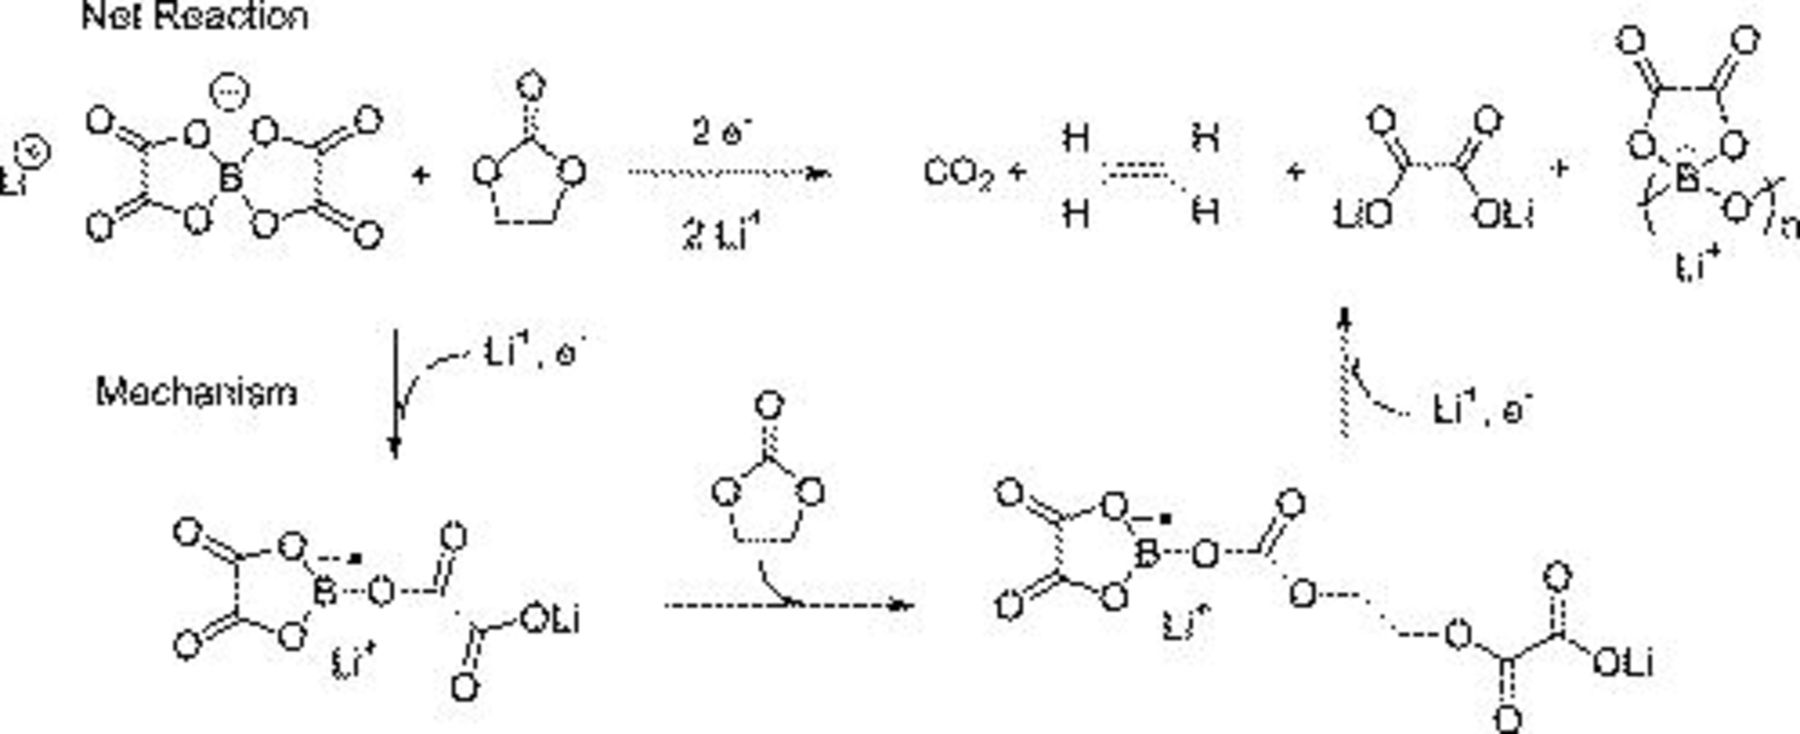
Figure 18. Reaction mechanism postulated to explain the formation of SEI constituents in the LiBOB electrolyte.
The observed impedance differences between graphite formed in various electrolytes, and attributed to differences in SEI morphology and composition,21 can be at least partially explained by our proposed mechanisms. The lower graphite impedance in  electrolytes may be attributed to the generation of
  species, which may be of lower molecular weight and less likely to be cross-linked. However, these species may also be more soluble in the electrolyte, which explains the poorer SEI stability during elevated temperature aging
  . The higher graphite impedance in
  electrolytes may be due to the presence of a dense linear
  inorganic polymer on the graphite surface. However, this polymer is more stable at elevated temperatures, and its presence may explain the better performance retention of electrolytes containing
  during elevated temperature aging. The
  electrolyte can generate different types of borate polymers; the unique combination of these polymers and their apparently good lithium-ion conductivity may explain the low graphite impedance. The LiBOB electrolyte apparently generates a highly crosslinked borate∕oxalate SEI that has high impedance. It should be noted that the electrode impedance may also depend on the location of the inorganic products, such as LiF and
  in the graphite SEI. These inorganic compounds can hinder lithium-ion motion when present in the "inner" SEI, adjacent to the graphite edge planes. Additional experiments are in progress to examine the validity of the various proposed mechanisms and their relationship to electrode impedance.
Conclusions
BF graphite electrodes produced by electrophoretic deposition and formed in electrolytes containing EC:EMC (3:7) solvent and various salts (
 ,
, 
 ,
, 
 , and
, and  LiBOB) were analyzed by FTIR, XPS, and TGA. Our data indicate the following:
- (1)Electrolyte reduction occurs on the graphite surface, but only during the first lithiation cycle. For graphite samples lithiated in LiBOB and
 electrolytes, reduction processes at multiple voltages ( and vs Li), whereas samples lithiated in and electrolytes typically display electrolyte reduction at vs Li.
 - (2)LiF and phosphate compounds, such as lithium alkyl phosphates (, etc.), and lithium oxyfluorophosphates are important components of the graphite SEI formed in the electrolyte.
- (3)LiF, alkyl borates, such as, lithium borates , and lithium fluoroborates are prominent in the graphite SEI formed in the electrolyte. The reduction products of the salt are less soluble in EMC than the related reduction products of . The insoluble B-containing species may include inorganic∕polymer compounds (–B–O–) with or without cross-linking.
- (4)A significant quantity of LiF,, and lithium oxalate (or alkyl esters of oxalic acid) is present in the SEI of graphite formed in electrolyte. Our data also support the presence of organic species∕oligomeric compounds that decompose at elevated temperatures.
- (5)Lithium oxalate (or alkyl esters of oxalic acid),, tri-coordinated borates and various oligomeric compounds are present in the graphite SEI formed in LiBOB. These compounds appear to be insoluble in EMC and decompose at temperatures above . The graphite SEI may be fairly thick because graphite peaks are not observed in the XPS data and abundant organic decomposition products are found in the TGA data.
- (6)Lithium alkoxides, such as, and possibly small amounts of lithium alkyl carbonates, such as lithium diethylene carbonate, may also be present in the graphite SEI, but these species are washed off during electrode rinsing. Our data does not support the presence of in any of the graphite SEI.


Acknowledgments
This work was supported by the U.S. Department of Energy (DOE), Office of Vehicle Technologies. We are grateful for the support of Tien Duong and Dave Howell at DOE, and Gary Henriksen and Dennis Dees at Argonne. We acknowledge the assistance of Magdalena Furczon (Argonne) for electrochemical measurements on the BF graphite samples and Liu Zhou (URI) for preparation and characterization of  .
.
Argonne National Laboratory assisted in meeting the publication costs of this article.