
Abstract
The temperature dependence of the relaxation of poly(aniline) (Pani) and poly (o-toluidine) (POT) in aqueous eutectics of  and
and  in the temperature range
  K, was investigated. As the temperature decreased the anodic peak parameters,
  increased,
  increased, and
  decreased. The data is interpreted qualitatively within the framework of the extended Feldberg's model, which takes into account the capacitive current contribution to the total current as well as the interaction between neighboring redox centers. The results agree with other experimental observations related to the relaxation of the polymer films. The temperature dependence of the change in the anodic peak parameters shows that the polymer relaxation decreases as the temperature is decreased. The relaxation can be explained through a kinetic process with a rate constant depending on the degree of advance of the reaction (Elovich kinetics). © 2005 The Electrochemical Society. All rights reserved.
Export citation and abstract BibTeX RIS
Electroactive polymers have a wide range of applications including sensors, mechanical actuators, permselective membranes, displays, and batteries, just to mention a few.1 Actually, these polymers are a net of polyelectrolyte chains. As the polymer is oxidized, the chemical nature of the polyelectrolyte changes and, consequently, many of its properties, such as conformational structure, state of swelling, counterion screening, and the state of binding, also change.
Moreover, many electroactive polymers show the so-called first cycle effect,2
3 memory effect,4 or slow relaxation.5 These relaxation effects are characterized by changes in the voltammetric profile, obtained during the first positive going half cycle, after holding the potential at a suitable negative value, with respect to the steady-state voltammetric profile. The differences between both voltammetric profiles, in steady state conditions and after relaxation at a negative potential, show up in the features of the anodic current peak corresponding to the first redox couple of the polymer. They are shifts in the positive direction of the peak potential,  a decrease in the peak width at half current,
  and an increase in the value of the peak current density
  The magnitude of these changes depends on the time spent at the negative potential. The experimental evidence is also a manifestation of the polyelectrolytic nature of these polymers. The changes in the chemical nature of the polymer upon oxidation as well as the relaxation process have attracted the attention of many workers in the field (see Ref. 2
3
4
5
6
7
8
9
10
11
12
13
14
15
16
17
18, and references therein).
The magnitude of these changes depends on the time spent at the negative potential. The experimental evidence is also a manifestation of the polyelectrolytic nature of these polymers. The changes in the chemical nature of the polymer upon oxidation as well as the relaxation process have attracted the attention of many workers in the field (see Ref. 2
3
4
5
6
7
8
9
10
11
12
13
14
15
16
17
18, and references therein).
The relaxation effect is particularly notorious in conducting polymers derived from ring substituted aryl amines. Interestingly, ladder polymers of ring substituted aryl amines, such as poly(o-aminophenol) (POAP) and poly(phenylendiamine) (PPDA) and poly(bencidine) (PB), do not show this effect.19 Also, N-substituted polymers show little effect.20 21 Furthermore, the nature of the solvent has influence on the relaxation effect11 and an increase in the proton concentration of the external solution decreases the relaxation time.12 18
Not only the voltammetric features change during the relaxation. Thus, during the subsequent positive going half potential cycle it is observed that, as compared to that measured in steady state potential cycling, the spin number increases.22 Also, the amount of protons expelled during the oxidation, following the relaxation, increases with respect to that during the steady-state potential cycling.15 Moreover, during relaxation the polymer undergoes a contraction that is much larger than that occurring under steady-state cycling conditions.16 These facts strongly point to a conformational transition from a linear to a coiled form of the polymer during its relaxation. Conformational changes in this type of polymer were first proposed by Heinze and co-workers.23 Recently, we found that the spectral response of substituted aryl amine polymers, also change during the relaxation.14 19 24
Several models have been proposed to explain the relaxation effect. Among them we will mention: (i) a slow cis-trans isomerization kinetics of the polymer chains;23  slow adsorption/desorption of ions;2
17
slow adsorption/desorption of ions;2
17  changes in the polaron-bipolaron equilibrium constant;22
  percolation of conducting clusters;25
9
percolation of conducting clusters;25
9  N-shaped free energy curves;26
  incomplete reduction of the polymer;3 and
  changes in the local pH due to changes in the value of the potential at the outer Helmholtz plane.12
The electrochemical features of the relaxation phenomena of substituted arylamine derived polymers can be summarized as follows:18 (i) The polymer relaxes even if it is not completely reduced;  For completely reduced polymers the relaxation time depends on the external acid concentration and on the film thickness but it is independent of the ionic strength of the external medium;
  Within a determined potential window the polymer relaxation is independent of the applied potential;
  After a short current transient, no current flows during relaxation. Analysis of this current transient does not show any diffusion control;
  Once the polymer is completely reduced and relaxed, its state (degree of reduction, protonation and ion incorporation) is independent on the composition and concentration of the electrolyte in which this particular state was obtained; and
  in those conditions, the shape of a subsequent voltammetric oxidation profile depends exclusively on the composition and concentration of the electrolyte in which the polymer is being oxidized.
Then, and considering that conformational changes probably take place during the relaxation process, the effect of the temperature on the relaxation process should be a valuable tool to study it. In general, the temperature dependence of the electrochemical processes is a valuable tool, but it is under employed. Thus, in the whole field of conducting polymers, only a few works on changing this variable have been reported.13 27 28 29 30 31 32 To our knowledge, no studies of the temperature dependence of the relaxation phenomena have been reported. Therefore, we think that more insight on the relaxation effect can be obtained from the study of its the temperature dependence.
In a previous work, we have studied the effect of temperature on the voltammetric and impedance response of POT.29
30 There we found that the voltammetric response could be explained employing Feldberg's model33 for the redox switching of a layer including a large capacitive contribution. This large capacitive contribution is due to charges generated within the polymer as a consequence of the oxidation. It is clear that the relaxation phenomena is a kinetic process and its extension is monitored by the changes in the subsequent anodic voltammetric response. Then, Feldberg's model will allow to analyze the present results. Moreover, considering that relaxation implies conformational changes in the reduced polymer, it is clear that these will affect, indirectly, the subsequent voltammetric response. To this end, we studied in this work the temperature dependence of the relaxation of poly(aniline) (Pani) and poly (o-toluidine) (POT) in aqueous eutectics of  and
and  in the temperature range
  K.
K.
Experimental
Pani and POT films were built up on Au electrodes as described previously.18 The area of the working electrode was 0.316 cm2. The voltammetric charge of the films employed in this work, Q, at room temperature in the potential range  V, was
  mC cm−2. The film thickness could be derived from the charge vs. film thickness relationship established before for these polymers.34
35 However, for the reasons stated before18
31
32 we will employ Q as a measure of the film thickness.
mC cm−2. The film thickness could be derived from the charge vs. film thickness relationship established before for these polymers.34
35 However, for the reasons stated before18
31
32 we will employ Q as a measure of the film thickness.
The electrolyte solutions were prepared from  (97%) and
  (70%) acids (Merk, p.a.), aniline and o-toluidine (Fluka-Garantie, puriss. p.a.) and Milli-Q water.
The experimental set-up for the voltammetric measurements was a three-electrode glass cell as described elsewhere.13 The auxiliary electrode was a cylindrical Pt foil. The reference electrode was a  electrode as described previously.13 Potentials, E, in the text are referred to the reversible hydrogen electrode scale at T.
The cell temperature was monitored by means of precision thermistors (YSI 44001) and kept constant at ±1 K using a home made thermostat employing liquid air as the refrigerate fluid.
Conventional voltammetry was performed at different sweep rates, v, ranging from  to 0.3 V s−1, covering a potential region between 0.0 and 0.5 V, using a PAR 273 potentiostat and Philips PM 8134
  recorder.
The voltammetric experiments holding the potential at  V were made at a sweep rate of
  V s−1.
Results
In Fig. 1, we show the  response at room temperature of the three systems studied here: Pani in 3.7 M
  POT in 3.7 M
  and POT in 3.7 M
  As the temperature is changed, the steady state (subindex 0) peak parameters show the features reported previously:31
  increases,
  increases, and
  decreases, as T decreases. These changes are greater for the anodic peak than for the cathodic one. Here, we will only show the temperature change of
  (Fig. 2) and
  (Fig. 3) for the anodic peaks. For all the systems studied here
  depends almost linearly with the sweep rate, v, up to 0.1 V s−1, at all temperatures. However, the
  slope decreases as T decreases.31 On the other hand, as reported previously,31 the sweep rate dependence of
  does not change markedly with T.

Figure 1.
 voltammetric response of Pani and POT in different electrolytes at room temperature. (▵) steady state cycling (•) after relaxation. (a) Pani in 3.7 M
  (b) POT in 3.7 M
  and (c) POT in 3.7 M
 V s−1.

Figure 2. Temperature dependence of  (•) Pani in 3.7 M
  (○) POT is 3.7 M
  and (▪) POT in 3.7 M
 V s−1.

Figure 3. Temperature dependence of  (•) Pani in 3.7 M
  (○) POT in 3.7 M
  and (▪) POT in 3.7 M
 V s−1.
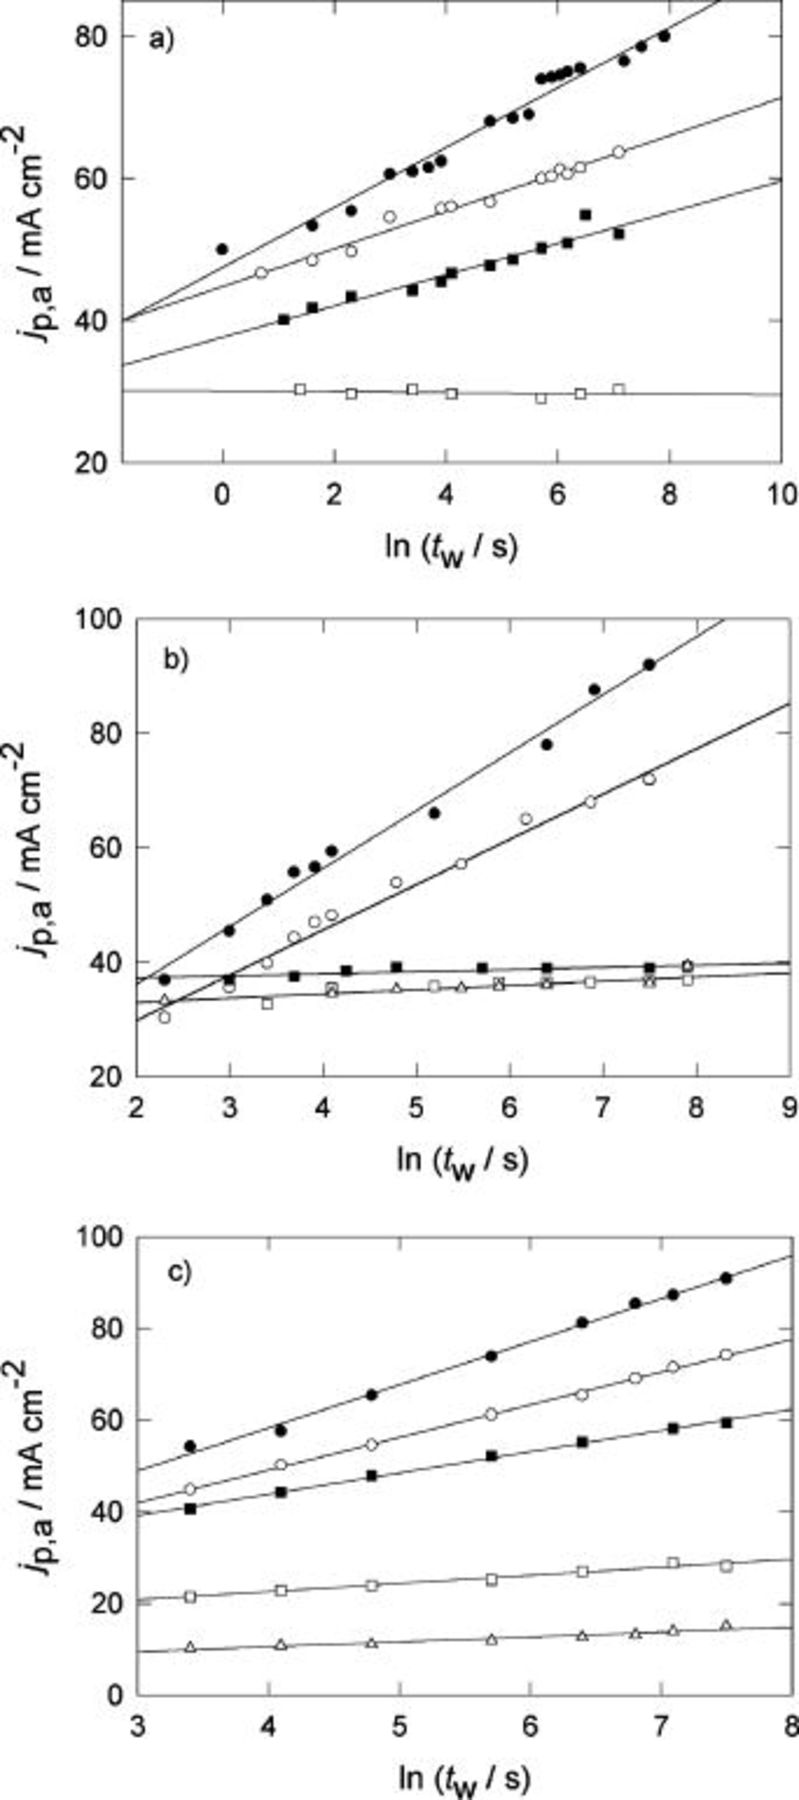
The change of  with the holding time,
  at fixed holding potential,
  for different temperatures is summarized in Fig. 4, 5, and 6 for the three systems. The change in
  with the holding time is shown is Fig. 7, 8, and 9.
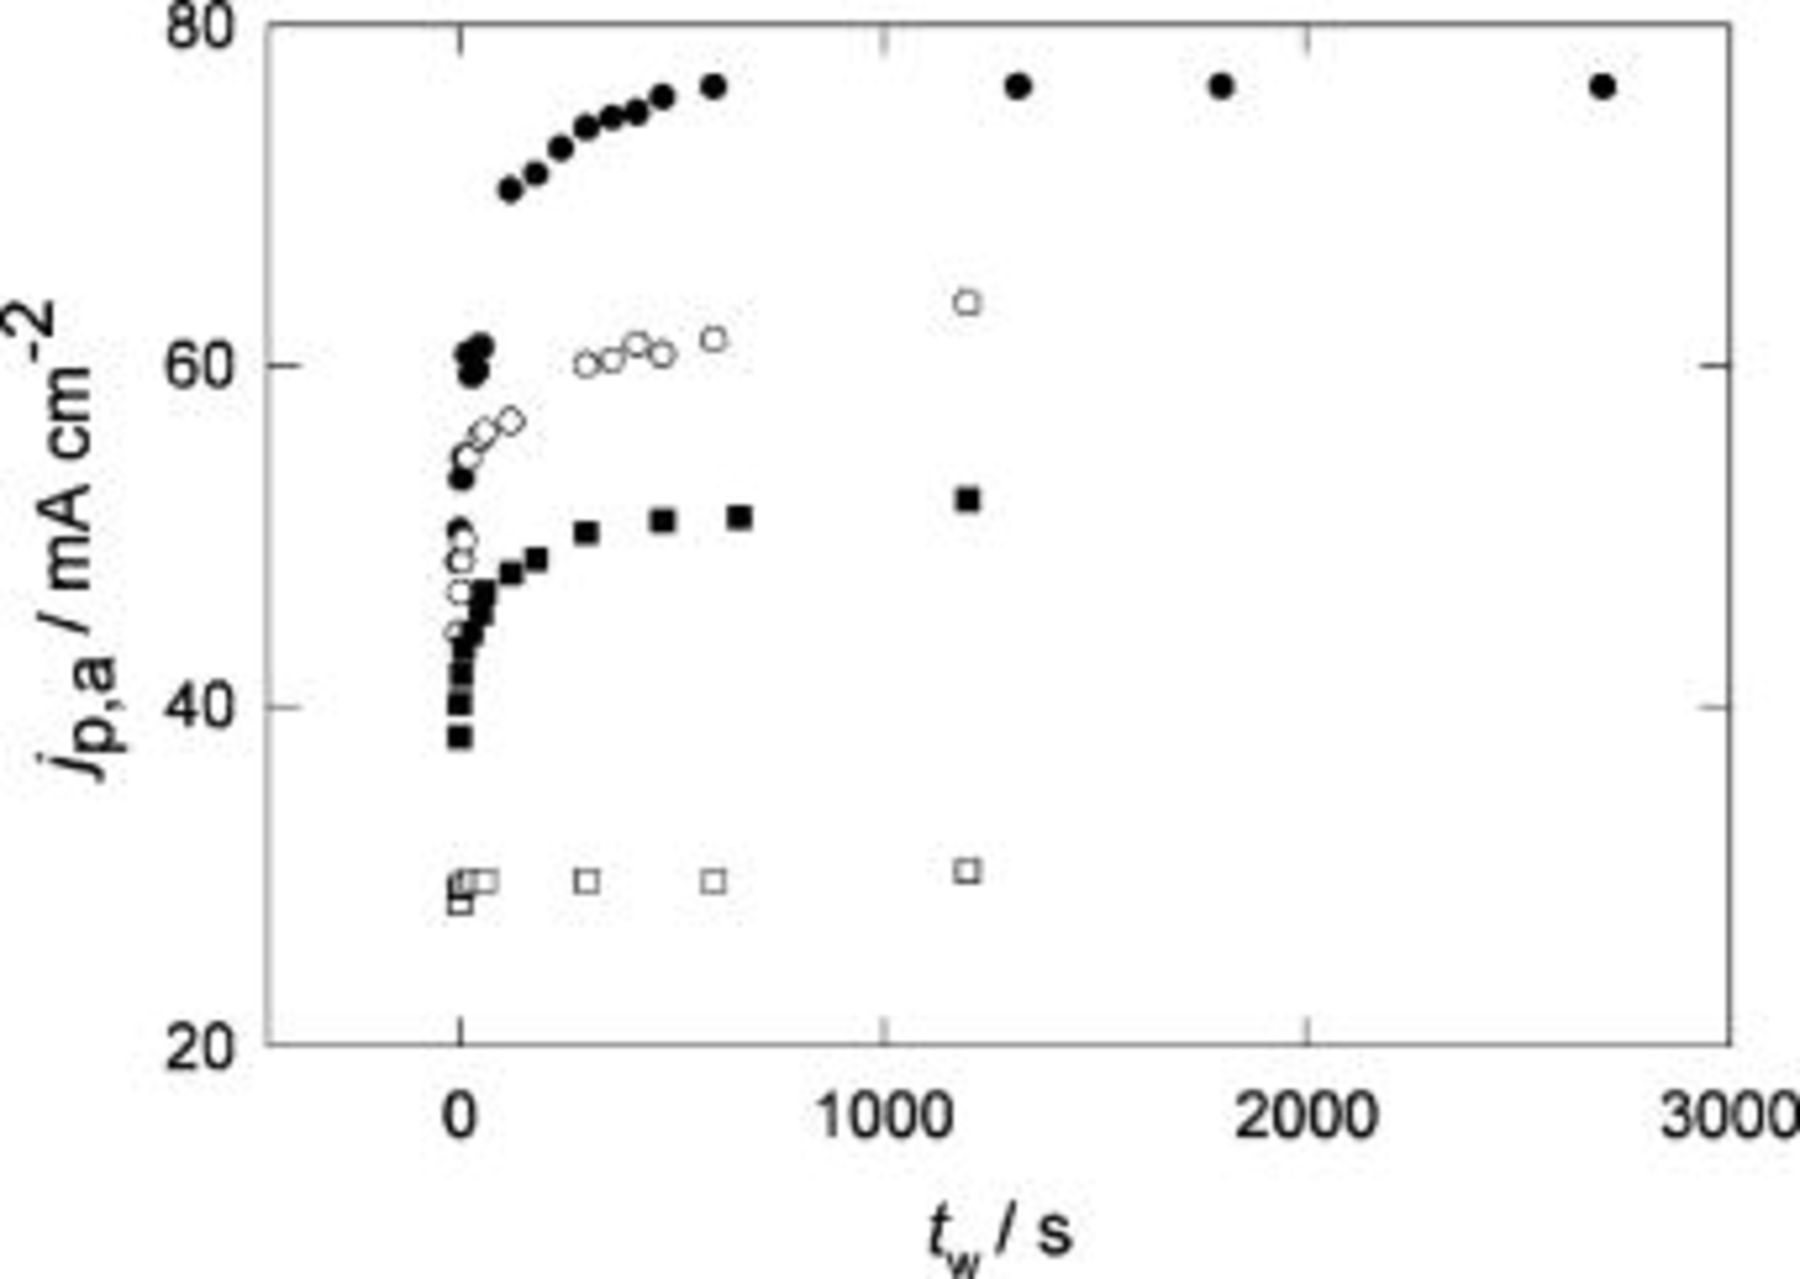
Figure 4. Change of  with the holding time,
  for Pani in
  at different temperatures. Holding potential
  V.
V.  V s−1. (•) 296 K, (○) 288 K, (▪) 240 K, (□) 203 K.
Figure 5. Change of  with the holding time,
  for POT in
  at different temperatures. Holding potential
  V.
V.  V s−1. (•) 296 K, (○) 283 K, (▪) 250 K, (□) 244 K, (▵) 203 K.

Figure 6. Change of  with the holding time,
  for POT in
  at different temperatures. Holding potential
  V.
V.  V s−1. (•) 296 K, (○) 280 K, (▪) 250 K, (□) 241 K, (▵) 222 K, (♦) 203 K.

Figure 7. Change of  with the holding time,
  for Pani in
  at different temperatures. Holding potential
  V.
V.  V s−1. (•) 296 K, (○) 288 K, (▪) 240 K, (□) 203 K.
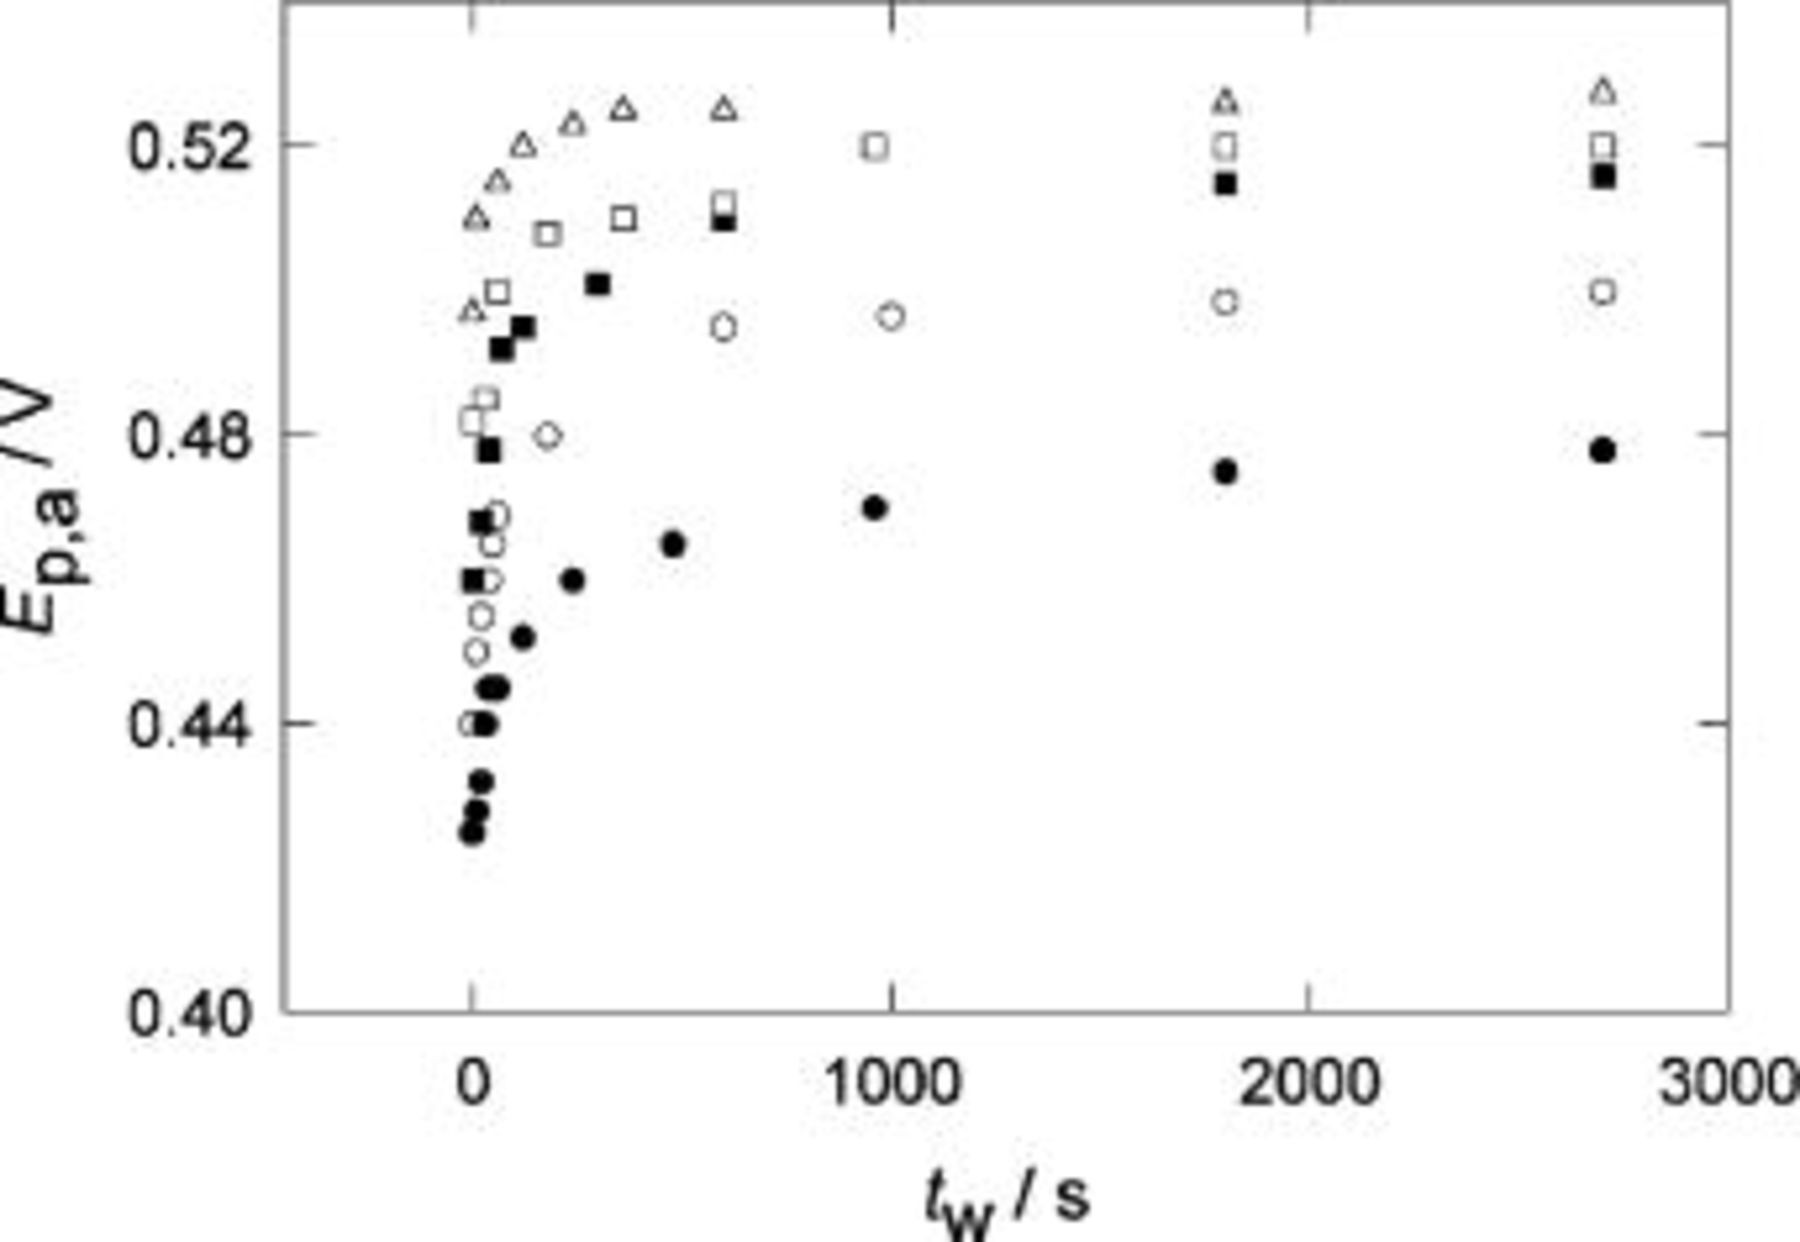
Figure 8. Change of  with the holding time,
  for POT in
  at different temperatures. Holding potential
  V.
V.  V s−1. (•) 296 K, (○) 283 K, (▪) 250 K, (□) 244 K, (▵) 203 K.
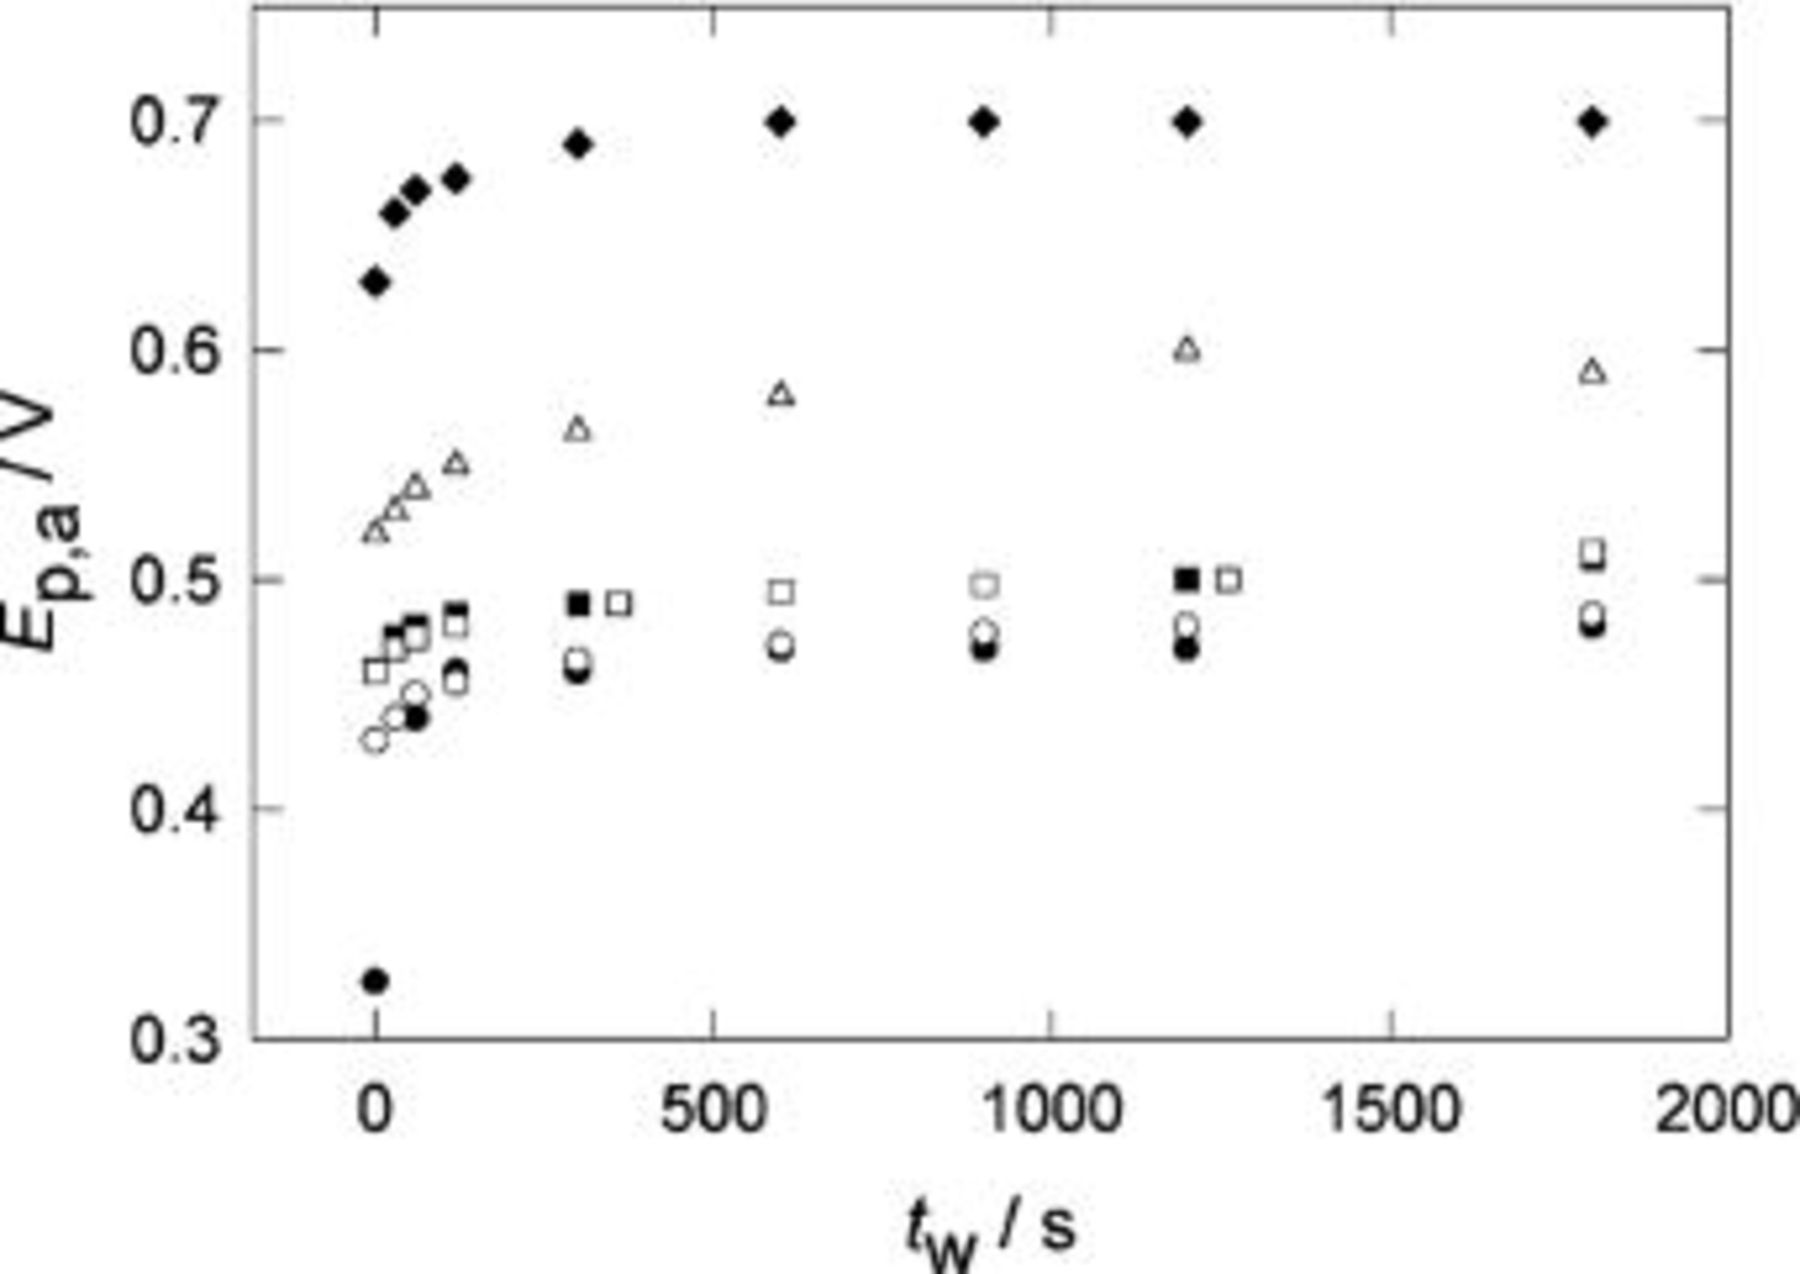
Figure 9. Change of  with the holding time,
  for POT in
  at different temperatures. Holding potential
  V.
V.  V s−1. (•) 296 K, (○) 280 K, (▪) 250 K, (□) 241 K, (▵) 222 K, (♦) 203 K.
Both quantities,  and
and  depend linearly on the logarithm of
  according to,12 (Fig. 10 and 11, respectively)


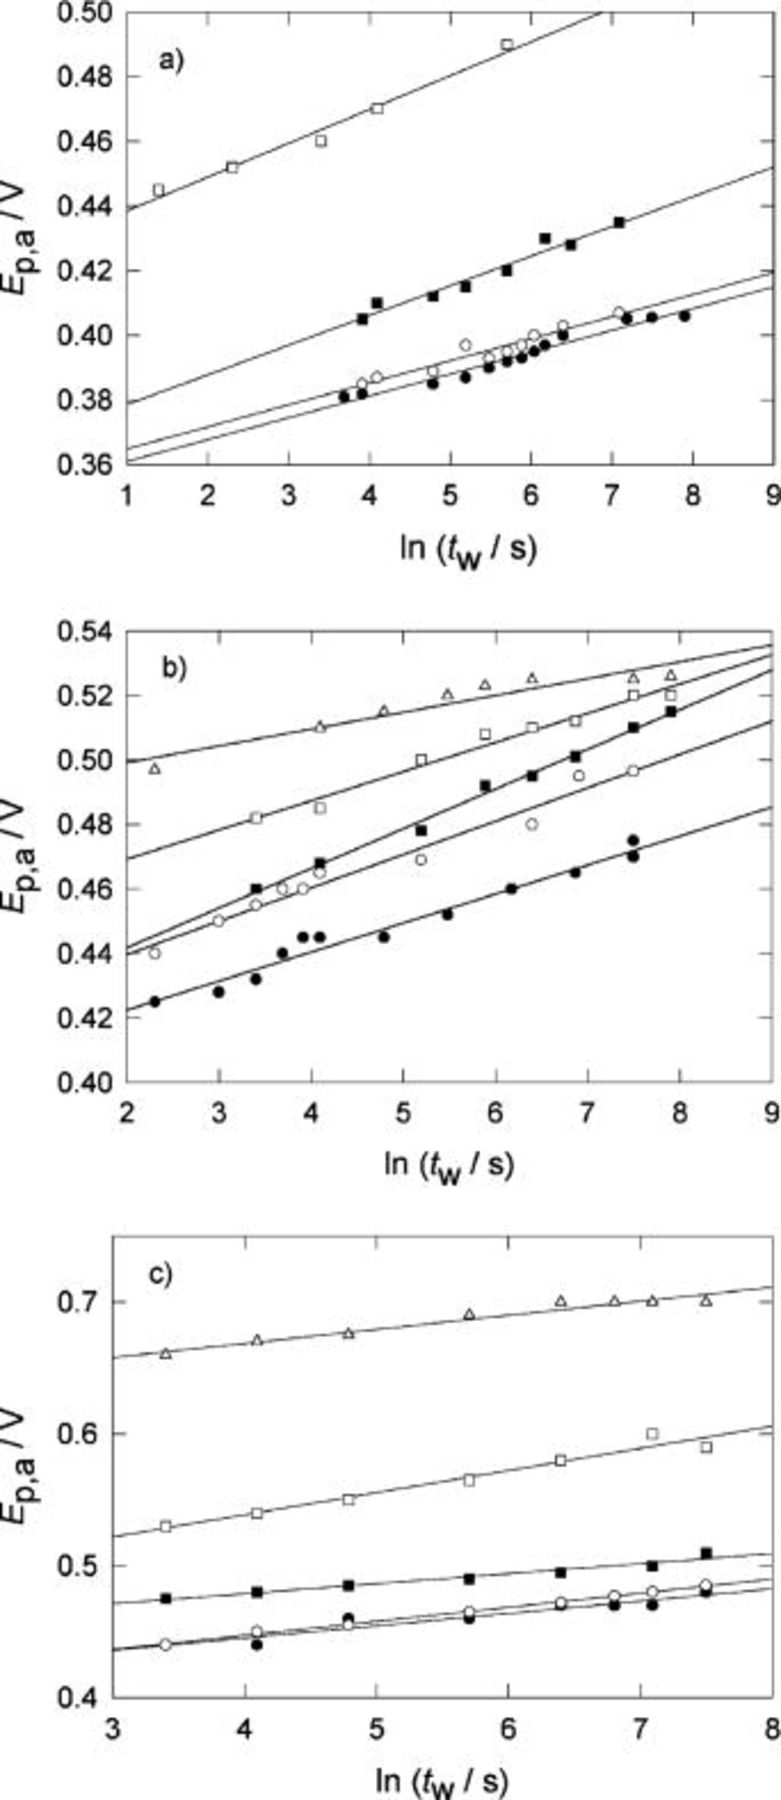


The slope  decreases as the temperature decreases; whereas the slope
  is practically independent of T.
In addition, it is interesting to consider the changes in  and
and  in going from the steady state voltammetric response,
  and
and  to that of a completely relaxed polymer
 and
and  so that
  and
and  For reasons that will become apparent, it is convenient to introduce the relative changes,
  Figure 12 and 13 show the temperature dependence of
  and
and  for the systems studied in this work. In view of the small changes of
  with temperature we will concentrate on the temperature changes of
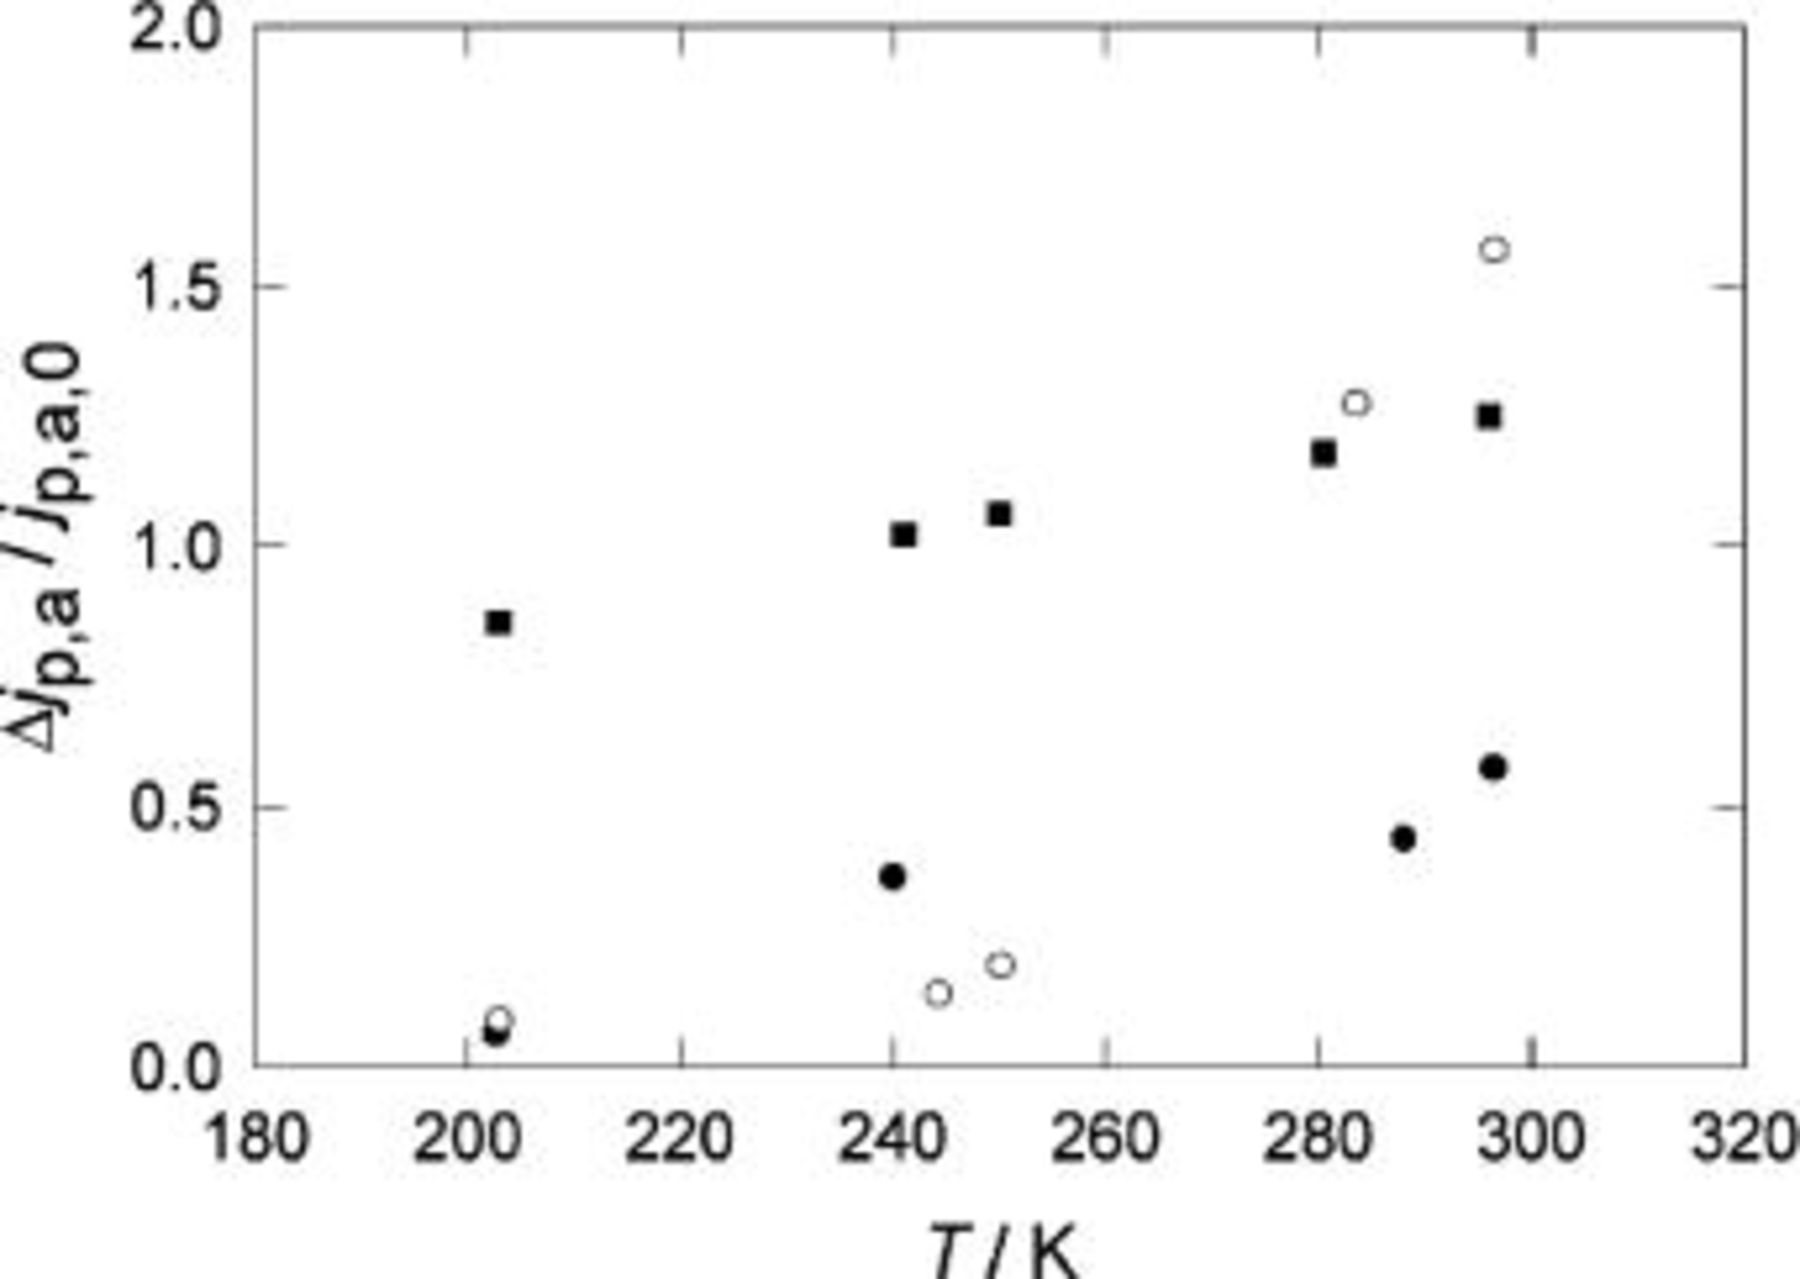
Figure 12.
 vs. T. (•) Pani in 3.7 M
  (○) POT is 3.7 M
  and (▪) POT in 3.7 M

Figure 13.
 vs. T. (•) Pani in 3.7 M
  (○) POT is 3.7 M
  and (▪) POT in 3.7 M
Discussion
Qualitative description of the redox switching of an electroactive polymer.—
Let us first consider a simplified scheme that represents the redox switching of the first redox couple of Pani.3 36 37 38 Leucoemeraldine (LE, insulator) is oxidized to Emeraldine (EM, conductor), according to

where -NH- represents non-protonated amine groups, -N = nonprotonated imine groups, B represents benzoic rings and Q quinonic rings. Depending of the proton concentration of the external electrolyte, both forms, LE and EM, are protonated to different degrees leading to  and
and  forms.31 The polymer, in both oxidation states, also contains different amounts of anions, according to its oxidation degree, to maintain the electroneutrality within the polymer (see Ref. 39 and references therein). In this example the amine groups are the reduced ones and the imine groups are the oxidized ones.
Both, the reduced form (LE) and the half-oxidized form (E) of these polymers constitute a net of partially charged polyelectrolyte chains. When such a polyelectrolyte is brought in contact with an electrolytic solution the following contributions to the free energy of the polymer, should be considered:40
41
42 (i) When the polymer interacts with the solvent, changing its conformational structure and incorporating solvent molecules (swelling), the free energy involved in the process will have a term of free energy of mixture,  plus, as a consequence of the swelling, a term of free energy of deformation of the polymer. Because this last contribution is purely entropic, we will call it:
 As the polymer bears a net charge, there will also be a free energy of a counterion ionic atmosphere formation,
 The polymer also undergoes a binding equilibrium process due to the possibility of exchanging protons with the solution. This process depends on the chemical potential of the protons in solution and so, there will be a binding free energy involved in the process,
  Therefore, when the reduced form of the polymer is brought in contact with the solution the total free energy change should be

and similarly for the oxidized form, 
To oxidize the polymer it is necessary to apply a potential E, and as the oxidized form is formed it will interact differently with the solution and therefore, a part of the electrical energy expended must include the free energy terms due to the different interaction of the reduced and oxidized forms with the external electrolytic solution. We have already shown that when different free energy contributions, as those mentioned above, change during the redox process, the equilibrium potential, E, may be written as42

where  and
and  are the chemical potentials of the oxidized and reduced redox centers,
  is the chemical potential of the electrons, α is the number of redox centers in a polymer unit, and
  and
and  are the chemical potentials corresponding to the
  and
and  contributions, respectively.
In principle, the terms  and
and  could be evaluated from Flory's theory of polymer solutions together with the atmosphere charging and binding terms.40
41 However, the complexity of the present system and the lack of the appropriate information prevents, for the time being, to make a detailed calculation of the influence of these effects on the voltammetric response of aryl amine derived polymers. For these reasons we will apply a formal electrochemical approach and so the effects mentioned in the above paragraph will be included in the apparent formal standard potential.42 As discussed elsewhere this may lead to an apparent formal potential distribution.43
could be evaluated from Flory's theory of polymer solutions together with the atmosphere charging and binding terms.40
41 However, the complexity of the present system and the lack of the appropriate information prevents, for the time being, to make a detailed calculation of the influence of these effects on the voltammetric response of aryl amine derived polymers. For these reasons we will apply a formal electrochemical approach and so the effects mentioned in the above paragraph will be included in the apparent formal standard potential.42 As discussed elsewhere this may lead to an apparent formal potential distribution.43
The strategy will then be as follows: First, we will revisit the effect of temperature on the voltammetric response as a way to establish its formal description and to take into account that this will be the tool we will employ to sense what happens after relaxation. To this end we will employ Feldberg's model. Then, we will consider how Feldberg's model has to be modified to describe the voltammetric response after relaxation. This is tantamount to include interactions in Feldberg's model. Then, after the formal machinery is ready we will attempt to apply it to the experimental results obtained as a function of temperature. Furthermore, it is evident that the behavior of POT in  seems to follow a different trend from the other two systems:
  increases markedly with the decrease in temperature (Fig. 2),
  does not change with temperature (Fig. 3), the behavior of
  as a function of T is clearly different from those of the other two systems (Fig. 12), and the dependence of
  with T is also different (Fig. 13). The latter is surely due to the marked dependence of
  with T. For this reason we will exclude the system POT in
  from the discussion.
Temperature dependence of the peak parameters.—
The temperature dependence of the steady state peak parameters of arylamine derived polymers has been studied previously.28
30
31 In the Results section we showed that as T decreases,  decreases and
  slightly increases. At all temperatures, during the positive half potential cycle,
  depends linearly with the sweep rate whereas
  does not change with v, these two experimental conditions are diagnostic criteria for reversible electron transfer.44 Besides, in previous work we established that the total surface concentration of redox sites in the polymer film,
  was independent of T.31 In addition, we found that the voltammetric capacitance,
  is much bigger than the low frequency capacitance,
  as determined by electrochemical impedance spectroscopy (EIS).32 Moreover, in that work we arrived at the conclusion that in the nonconducting state of the polymer the rate determining process is the charge transfer at the polymer solution interface and that it decreases as the temperature is decreased. In the conducting state, the rate determining step is the compensation of charge due to the ionic movements within the polymer and these also decrease as the temperature is lowered. These facts preclude an explanation of the
  dependence on T, based on a change of
  with T.
Moreover, these experimental findings cannot be explained in terms of a simple model of a reversible electron transfer without taking into account the interaction between the redox centers. In the absence of interactions the peak current is defined as44
In that case,  should decrease as T increases. Moreover, a reversible electron transfer model does not allow one to explain why the voltammetric capacitance is much larger than the low frequency one. This experimental finding is due to the fact that, during potential sweeping, as opposed to the application of a small ac perturbation, there is a contribution to the total current that is not observed during the application of a small ac perturbation. This extra current contribution comes from the fact that, as the polymer is oxidized by sweeping the potential, charges are generated within the polymer that give rise to a capacitance at the polymer solution interface and within the polymer. This experimental fact can be explained in terms of a model proposed by Feldberg33 that takes into account this capacitive current contribution. In Feldberg's model the total oxidation current
  is written as
where  is the faradaic current and
  the capacitive one. Feldberg considered a reversible one-electron transfer in the absence of interactions between the redox centers, that is33

where  and
and  is the apparent formal potential of the redox couple. The capacitive current,
  is assumed to be a fraction of the faradaic one

where a is a parameter of the model, v is the sweep rate,  the potential of zero charge of the polymer, and
  is the faradaic charge. Then

Note that Feldberg's model, in the absence of interactions between the redox centers, retains the dependence of the voltammetric parameters on the sweep rate for a reversible process.
Now, the experimental findings described above can be explained by considering that, as the temperature is lowered, the ionic movements are hindered and, therefore, during the time required to sweep the potential, the charging of the capacitor does not reach its equilibrium value. That is, as the temperature decreases the capacitive current contribution is diminished. So, as T is lowered it is observed that the current decreases whereas the peak potential remains practically unchanged.
Formal description of the relaxation phenomena.—
There are two facts that should be kept in mind about the relaxation phenomenon. The first one is that, as noted, during steady state cycling the reduced form does not reach equilibrium. Kalaji et al.7 have shown that the charge associated with the first oxidation cycle is not fully recovered on the reverse sweep; it means that repetitive cycles are characteristic of a film which is still partially oxidized.
On the other hand, experiments of volume changes made with POT, upon redox switching, evidence that during continuous potential cycling the films show smooth and relatively low volume changes but, when the polymer is completely reduced and relaxed its volume reaches a minimum, and the overall change is about an order the magnitude higher than in continuous cycling, with little dependence on the electrolyte anion. It is during the relaxation that de-swelling of the polymer and the incorporation of protons occurs.16 The latter is clearly seen in the experiments of proton injection/ejection performed with the RRDE,15 during the redox switching of Pani film. In that case, a slow proton incorporation during relaxation is observed. This is reasonable because, in the reduced state, the polymer essentially consist of an hydrophobic environment that hinders ionic movements.45 Also, it must be remarked that the analysis of the current transients during the relaxation shows that the current drops first rapidly and then decreases very slowly. It does not show a diffusion control.18 Therefore, relaxation is not controlled by the diffusion-in of protons or by the diffusion-out of anions.
The changes in the oxidation peak parameters after relaxation may be explained, at least in a formal way, with a simple model of a reversible electrochemical charge transfer for confined redox couples including next neighbor interactions.46 According to this model the current density is

where  and
and  are the interactions factors. They have units of cm2 mol−1. The peak parameters
 and
and  should depend on the interaction factors according to

and

where

Within this framework, it is easy to show that for the peak to become thinner and taller, and for it to appear at more positive potentials after relaxation, it must be  negative and
  positive and bigger than
  This is shown in Fig. 14, where the voltammetric profile was simulated according to Eq. 11 and 12 for different values of
  and
and  Here, positive values of the interaction parameters imply attractive interactions between the redox centers. These conditions for
  and
and  imply
imply  and negative,
  and
and  and they indicate that the interaction between the oxidized centers is repulsive and that the interaction between the reduced redox centers is attractive. This is reasonable because it is well known that the oxidized centers are positively charged. This also shows that after relaxation the repulsion of the oxidized centers and the attraction of the reduced centers or both increases. This, in turn, implies that one or both types of centers become closer after relaxation. The model of Anson and Laviron albeit takes into account interaction between neighboring redox centers, does not incorporates the capacitive current contribution as proposed by Feldberg which is necessary to take into account to explain the temperature dependence of the voltammetric response of these kind of polymers. Then, to include properly the interaction between the redox centers, it would be necessary to extend Feldberg's model to include these interactions. This extension is made in the Appendix.


The temperature dependence of the voltammetric response after the relaxation phenomena.—
With the ideas developed above, it is now possible to explain the observed temperatures effects in the voltammetric response after relaxation. The experimental data (Fig. 12 and 13) shows that  decreases and
  increases as the temperature decreases.
This can be interpreted qualitatively within the framework of the extended Feldberg's model, shown in the Appendix, by assuming that the parameters of the model (i.e.,  and a) do not change with T. Actually, what happens is that the decrease in T makes that these parameters do not reach their equilibrium values, as it was explained above. We may assume that in making the relative ratio
  at a fixed temperature, the influence of the temperature dependence on the parameters
  and a, cancels out and only remains the temperature dependence of
  and
and  Neglecting, for simplicity, the contribution of the capacitive charging during polymer oxidation, it is easy to see that for
  to decrease and
  to increase, it is necessary that
  decreases as T decreases. According to our interpretation of the change of
  during the relaxation this would means that as the temperature decreases the polymer relaxation is smaller. This would be reasonable if the relaxation phenomenon is attributed to conformational changes of the polymer. Therefore, decrease in temperature hinders these changes and so the relaxation decreases.
The kinetic of the relaxation phenomena.—
In the experimental section we stated that the magnitude of the peak potential and current depended on the waiting time on a logarithmic way. The increase in the anodic current can be considered as a measure of the extension of relaxation and then it can be interpreted through the Zeldovich-Roginskii or Elovich (see Ref. 47) rate equation in which the rate constant depends exponentially on the extent of the reaction. This type of kinetics is presented by systems activation controlled in which there are interactions among the reactants. This is equivalent to considering a distribution of activation energies. Thus, we can visualize the relaxation as an activated process by which the polymer is transformed from a more or less linear form to a nearly coiled one. Then, this process will involve the rearrangement of the bonds linking the different units of the polymer. Most likely, this process will require the participation of some species from the external solution, most likely protons, whose concentration in the external phase is denoted by c. We have already shown that, for this kind of polymers, the relaxation depends on the pH of the external medium.18 The Elovich rate equation can be expressed as
with

where θ is a measure of the extent of the relaxation reaction,  the rate constant at the extent θ,
  the rate constant at
  and
and  a parameter that takes into account the coverage dependence of the rate constant and α and K are constants.48 It is convenient to note that Elovich equation is strictly valid at intermediate extension of the reaction. Integration of Eq. 16 leads to
with

Equation 18 has the form of the experimental laws (Eq. 1 and 2). The constants  and
and  should depends linearly on T. The long extrapolation to obtain the constant
  prevents an accurate value to be obtained. For these reasons we only discuss the temperature dependence of
  The constant
  depends linearly with T. This fact, together with the logarithmic time dependence supports the proposed kinetic scheme.
Conclusions
We have shown that, after polymer relaxation, the change in the peak current decreases and peak potential increases, as the temperature decreases. The change in the peak parameters upon relaxation can be interpreted in a formal way in terms of a reversible process with near neighbor interactions. This interpretation indicates that, after relaxation, the reduced redox centers must be closer than before relaxation. This fact is congruent with other experimental observations showing that during relaxation the polymer reduces its volume considerably. The temperature dependence of the change in the peak parameters, again interpreted with a simple model including near neighbor interaction, shows that the relaxation decreases as the temperature is decreased. This suggests that as the temperature is lowered the contraction of the polymer is hindered. The kinetics of relaxation is a logarithmic one. This is interpreted in terms of a first order kinetic in which the rate constant depends on the extent of the reaction (Zeldovich-Roginskii, Elovich kinetics).
Acknowledgments
This work was financially supported by the Consejo Nacional de Investigaciones Cientı́ficas y Técnicas, the Agencia Nacional de Promoción Cientı́fico Tecnológica, the Universidad Nacional de La Plata, the Universidad de Buenos Aires, and the Comisión de Investigaciones Cientı́ficas de la Provincia de Buenos Aires.
Agencia Nacional de Promoción Cientı́fı́co Tecnológica assisted in meeting the publication costs of this article.
:
Appendix
Extension of Feldberg's Model to Processes Including Near Neighbor Interactions
Following Feldberg, we define the capacitive charge,  as a fraction of the faradaic charge,
  as
as
where a is a parameter of dimensions V−1, and  the potential of zero charge. The total charge is
Deriving the charge with respect to time we obtain the total current as a function of the faradaic current

In the present case, in the presence of interaction between the redox sites, the faradaic current can be written as a function of the fraction of the oxidized polymer, f, as46

where f is the fraction of oxidized sites, and  and
and  have been defined in the text. f is related to the potential through

because f is defined implicitly as a function of E. The faradaic current can only be expressed explicitly as a function of f. Integration of  with respect to f in Eq. 23, gives the faradaic charge as a function of f. The result is
after some rearrangements in Eq. 23, we obtain the total current as a function of f as

where, in Feldberg's notation,  and
and  Taking into account Eq. 25, the final expression for the current is

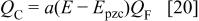
A simulation of Eq. 27 is shown in Fig. 15, both in the absence, (a), and in the presence, (b), of interactions.
Figure 15. Comparison of simulated results according to Eq. 27 for different values of  and
and 
 V,
V,  mol cm−2,
  V. (a)
  mol−1 cm2,
  mol−1 cm2; (b)
  mol−1 cm2,
  mol−1 cm2.