


Abstract
The authors conducted a cohort study within the Danish National Birth Cohort to determine whether coffee consumption during pregnancy is associated with late fetal death (spontaneous abortion and stillbirth). A total of 88,482 pregnant women recruited from March 1996 to November 2002 participated in a comprehensive interview on coffee consumption and potentially confounding factors in pregnancy. Information on pregnancy outcome was obtained from the National Hospital Discharge Register and medical records. The authors detected 1,102 fetal deaths. High levels of coffee consumption were associated with an increased risk of fetal death. Relative to nonconsumers of coffee, the adjusted hazard ratios for fetal death associated with coffee consumption of ½–3, 4–7, and ≥8 cups of coffee per day were 1.03 (95% confidence interval (CI): 0.89, 1.19), 1.33 (95% CI: 1.08, 1.63), and 1.59 (95% CI: 1.19, 2.13), respectively. Reverse causation due to unrecognized fetal demise may explain the association between coffee intake and risk of fetal death prior to 20 completed weeks' gestation but not the association with fetal loss following 20 completed weeks' gestation. Consumption of coffee during pregnancy was associated with a higher risk of fetal death, especially losses occurring after 20 completed weeks of gestation.
Coffee drinking is common, and in many countries it is considered a harmless habit, although caffeine has powerful effects on a wide range of organ systems. Coffee is the main source of caffeine in Denmark, and coffee consumption there is high (1). Coffee or caffeine has been linked to various adverse pregnancy outcomes, including fetal loss (2), birth defects (3), and fetal growth retardation (4, 5); thus, coffee consumption during pregnancy has been subject to preventive action in some countries. However, these putative effects have been questioned, and many countries, including Denmark, have no official policy against coffee drinking during pregnancy.
Caffeine is a methylxanthine which is rapidly absorbed by the digestive system. It crosses the placenta freely, which implies that caffeine concentrations in the fetus are the same as those in the mother's plasma (6). Caffeine clearance slows down during pregnancy, and in the second and third trimesters, the half-life of caffeine is tripled in comparison with nonpregnant women (7–9). Moreover, the fetus has low levels of enzymes that metabolize caffeine (10). Caffeine increases levels of cellular cyclic adenosine monophosphate, which may influence cell development (11); it also increases levels of circulating catecholamines that could interfere with uteroplacental circulation through vasoconstriction (12).
Research on caffeine intake and spontaneous abortion or stillbirth has produced conflicting results (2, 13, 14). Many studies have been too small to detect an effect or have relied on retrospective information, which is subject to recall bias. Our aim in this study was to evaluate the association between coffee consumption during pregnancy and the risk of fetal death, taking into account a number of potential confounders.
MATERIALS AND METHODS
The study was carried out in the Danish National Birth Cohort, which is the subject of an ongoing nationwide study of pregnant women and their offspring (15). Women were recruited into the Danish National Birth Cohort by their general practitioners, and approximately 60 percent of all practitioners in Denmark chose to take part in recruitment. The pregnant women received written information about the Danish National Birth Cohort at their first antenatal visit to the general practitioner, which is usually scheduled at gestational weeks 6–10. The women were included in the cohort when we received a signed informed consent form. During the period from March 1, 1996, to November 1, 2002, a total of 101,032 women agreed to participate. We estimate that approximately 60 percent of all invited pregnant women participated in the study. The only inclusion criteria applied were 1) being accessible by telephone, 2) being able to speak Danish well enough to take part in the study interviews, and 3) intending to continue the pregnancy to term (15). Information on various exposures incurred during pregnancy was obtained through computer-assisted telephone interviews.
We included all pregnant women for whom we had information from the first telephone interview (n = 88,570). The interview was considered missing if we could not reach the woman at the scheduled time or in three additional attempts to make contact. The interview was also designated missing if the woman was no longer pregnant at the time of the interview. The interview took place at approximately 16 weeks' gestation (interquartile range, 13–19 weeks).
Exposure assessment
The exposure of interest was coffee. The participants were asked, “How many cups of coffee do you drink daily?” Answers were coded in number of cups per day; a mugful was coded as two cups. Women with missing information on coffee consumption were excluded from the study (n = 32). Similar questions were asked about consumption of tea, while information on cola intake was gathered as none, <1 liter/week, or ≥1 liter/week. Information on potential confounders, such as previous fetal death, parity, smoking, alcohol intake, height, prepregnancy body weight, and socio-occupational status, was also collected in the first interview. Socio-occupational status was based on self-reported current job title. If the woman was attending school, her socio-occupational status was based on the type of education being received. If the woman's job title was missing (n = 4,249), we used her husband's job title, if available. This approach resulted in our having only 583 women without socio-occupational classification. Socio-occupational status was classified into three categories: high, middle, and low. Women with higher education (4 years beyond high school) or in management were classified as “high.” The category “middle” included skilled workers and women with middle-range training, while the category “low” included unskilled workers and the unemployed.
Pregnancy outcome
Livebirths and stillbirths were identified in the Civil Registration System and the Danish Medical Birth Registry through record linkage, using the mother's civil registration number. Cases of spontaneous abortion, induced abortion, ectopic pregnancy, and hydatidiform mole were identified in the National Hospital Discharge Register. Women with a diagnosis of hydatidiform mole were excluded from the study (n = 15). Emigrants and the time of emigration were identified in the Civil Registration System. In less than 1 percent, we failed to identify the outcome of pregnancy in the registry; we then used information on outcome from the pregnancy interview.
The main outcome in the study was fetal death, defined as either spontaneous abortion (gestational age <196 days) or stillbirth (gestational age ≥196 days). This was the official definition used in Denmark during the study period. Intrapartum death (n = 27) was considered a separate category of fetal death in the analyses, since the cause of death in these cases might have been related to the quality of clinical care during labor (16). Since we had no information on whether a spontaneous abortion had occurred in a multiple pregnancy, multiple births were retained in the study population (n = 1,937). When a multiple pregnancy ended with both a liveborn child and a stillborn child, the outcome was coded as livebirth (n = 20).
Information about gestational age was obtained from the National Hospital Discharge Register. This estimate of gestational age was mainly based on ultrasound examination. Women with missing information on gestational age (n = 23) or with a gestational age of less than 28 days (according to information from the National Hospital Discharge Register) at the first pregnancy interview (n = 8) were excluded from the study. Furthermore, 10 women were excluded because they participated in the first interview after termination of pregnancy. The final study population consisted of 88,482 pregnancies with 1,102 fetal deaths.
In a subanalysis of causes of stillbirth, we used information from the women who entered the Danish National Birth Cohort between May 1, 1998, and April 30, 2001, and participated in the first pregnancy interview (n = 55,379).
Medical records on stillbirths for this population have been collected nationwide. Cause of death was classified as suggested by Andersen et al. (17), based on a categorization suggested by Cole et al. (18) and Hey et al. (19). For the present study, we combined the causes “intrauterine growth retardation,” “infarction of the placenta with no intrauterine growth retardation,” and “abruptio placentae” into the category “placental dysfunction.” Intrauterine growth retardation was defined as a birth weight more than two standard deviations below the mean for gestational age on the reference curve, as suggested by Marsal et al. (20). All records were retrieved and coded independently by two of the authors (B. H. B., E. A. N.), who were blinded with respect to the main exposure. In cases of disagreement (n = 6), the cases were further evaluated until consensus was reached.
Statistical methods
We estimated relative risks of fetal death due to coffee intake as hazard ratios (with 95 percent confidence intervals) in Cox regression analysis with left-truncation and right-censoring. Days of gestation was used as the underlying time variable. Pregnancies were entered at the time of first interview, and observation time ended at the time of any of the following events: fetal death, induced abortion, emigration, participant's death, or initiation of an intrapartum death or livebirth. To improve comparability, we stratified data in the Cox regression model according to gestational week of first pregnancy interview.
In the analysis, coffee intake was considered as a categorical variable (0, ½–3, 4–7, and ≥8 cups/day) and as a continuous variable (number of cups per day) in a test for trend. If the intake of coffee was less than one cup per day but more than zero, we recoded it as half a cup of coffee per day. Almost all caffeine intake among participants came from coffee, but we also analyzed the data according to caffeine intake itself by using average levels of 100 mg of caffeine for a cup of coffee and 50 mg for a cup of tea (21). Potentially confounding factors were selected a priori as age at conception, parity, prepregnancy body mass index, smoking, alcohol consumption, and socio-occupational status, since these factors have all been linked to fetal death (22–26).
A clinically spontaneous abortion may occur weeks after actual fetal demise (27), and exposure information obtained from an interview during this time period need not reflect the actual exposure at the time of interest. Intake of coffee during this time period may be high as a consequence of fetal death. To assess the possible bias effect of delayed fetal expulsion that occurred shortly after the date of the interview, we repeated the analysis using delayed entry times. Delay time was gradually increased from 2 days to 28 days in 2-day increments.
We divided the follow-up period into three gestational age intervals (<140, 140–195, and ≥196 days) to study whether coffee increased the risk of fetal death during a specific time period. We used a likelihood ratio test to test for interaction with gestational age.
We also analyzed causes of singleton stillbirth as the primary outcome in a separate Cox analysis using the day of first pregnancy interview or day 195 as the entry date, if the interview was performed before that day. Because of the relatively small number of stillbirths, coffee intake was analyzed in three categories only (0, ½–3, and ≥4 cups/day).
We used likelihood ratio tests to assess whether the effect of coffee intake on fetal death and stillbirth was modified by smoking, alcohol use, or parity.
Since 1,436 women contributed more than one pregnancy to the study, we used robust standard errors to correct for possible dependence between pregnancy outcomes in the same woman (28). Moreover, we repeated all analyses using only the first pregnancies of these women. We used Stata software (version 8.0 SE; Stata Corporation, College Station, Texas) for all statistical analyses.
All Danish scientific ethics committees and the Danish Data Protection Board approved the study.
RESULTS
A total of 49,042 (55.4 percent) women did not report drinking coffee during pregnancy; 27,803 women (31.4 percent) drank ½–3 cups/day, 8,619 women (9.7 percent) drank 4–7 cups/day, and 3,018 women (3.4 percent) drank ≥8 cups/day. The overall crude risk of fetal death during follow-up was 12.5/1,000 (n = 1,102). Table 1 displays maternal coffee consumption according to a number of sociodemographic and lifestyle factors. Women with a high intake of coffee were older, more often smoked, and had a higher intake of alcohol. They were more often multiparous or belonged to a lower socio-occupational group.
Percentage distribution of maternal characteristics according to coffee intake and fetal death, Denmark, 1996–2002
Coffee consumption (cups/day) | Fetal death | |||||||||
|---|---|---|---|---|---|---|---|---|---|---|
| 0 (n = 49,042) | ½–3 (n = 27,803) | 4–7 (n = 8,619) | ≥8 (n = 3,018) | Spontaneous abortion* (n = 847) | Stillbirth (n = 255) | |||||
| Age (years) at conception | ||||||||||
| <25 | 16.0 | 9.4 | 7.4 | 9.2 | 12.3 | 10.6 | ||||
| 25–29 | 45.1 | 39.2 | 31.8 | 30.4 | 35.3 | 35.3 | ||||
| 30–34 | 30.5 | 37.7 | 40.7 | 38.7 | 37.9 | 34.5 | ||||
| ≥35 | 8.4 | 13.6 | 20.1 | 21.7 | 14.5 | 19.6 | ||||
| Parity | ||||||||||
| Primiparous | 51.8 | 45.3 | 33.4 | 27.4 | 43.7 | 51.8 | ||||
| Multiparous | 48.2 | 54.7 | 66.6 | 72.6 | 56.3 | 48.2 | ||||
| Prepregnancy body mass index† | ||||||||||
| <18.5 | 4.2 | 4.5 | 4.9 | 6.2 | 5.1 | 2.4 | ||||
| 18.5–24.9 | 64.9 | 69.7 | 67.2 | 61.8 | 61.4 | 52.6 | ||||
| 25–29.9 | 20.1 | 17.4 | 19.2 | 21.6 | 20.4 | 26.7 | ||||
| ≥30 | 9.1 | 6.9 | 7.2 | 8.2 | 10.4 | 14.5 | ||||
| Missing data | 1.7 | 1.6 | 1.6 | 2.3 | 2.7 | 3.9 | ||||
| Smoking | ||||||||||
| Nonsmoker | 89.8 | 83.3 | 63.0 | 39.4 | 80.4 | 77.7 | ||||
| Smoker (cigarettes/day) | ||||||||||
| 1–10 | 8.2 | 14.1 | 26.6 | 33.4 | 13.7 | 15.7 | ||||
| ≥11 | 2.0 | 2.6 | 10.2 | 27.1 | 5.9 | 6.7 | ||||
| Missing data | 0.1 | 0.1 | 0.2 | 0.1 | 0.0 | 0.0 | ||||
| Alcohol consumption | ||||||||||
| Non-alcohol-drinker | 64.6 | 44.1 | 41.9 | 47.9 | 56.1 | 57.7 | ||||
| Alcohol drinker (drinks/week) | ||||||||||
| ½–3 | 34.2 | 52.9 | 52.2 | 44.6 | 41.1 | 38.0 | ||||
| ≥4 | 1.1 | 3.0 | 5.7 | 7.4 | 2.8 | 4.3 | ||||
| Missing data | 0.1 | 0.1 | 0.1 | 0.1 | 0.0 | 0.0 | ||||
| Socio-occupational status‡ | ||||||||||
| High | 51.3 | 55.7 | 46.3 | 35.5 | 47.9 | 48.6 | ||||
| Middle | 38.4 | 35.5 | 40.8 | 43.6 | 38.4 | 38.0 | ||||
| Low | 9.7 | 8.2 | 12.3 | 19.8 | 12.8 | 12.2 | ||||
| Missing data | 0.6 | 0.7 | 0.7 | 1.2 | 0.9 | 1.2 | ||||
| Tea consumption | ||||||||||
| Non-tea-drinker | 34.8 | 33.9 | 52.9 | 63.7 | 40.6 | 36.9 | ||||
| Tea drinker (cups/day) | ||||||||||
| ½–3 | 45.5 | 50.8 | 29.3 | 22.3 | 41.0 | 43.5 | ||||
| 4–7 | 14.7 | 12.2 | 13.9 | 9.3 | 13.3 | 12.6 | ||||
| ≥8 | 4.9 | 3.2 | 3.9 | 4.6 | 5.0 | 7.1 | ||||
| Missing data | 0.0 | 0.0 | 0.1 | 0.1 | 0.1 | 0.0 | ||||
| Cola consumption | ||||||||||
| Non-cola-drinker | 34.3 | 33.9 | 33.7 | 35.1 | 38.0 | 32.2 | ||||
| Cola drinker (liters/week) | ||||||||||
| <1 | 46.7 | 52.7 | 50.7 | 46.2 | 43.2 | 51.8 | ||||
| ≥1 | 19.0 | 13.3 | 15.6 | 18.7 | 18.8 | 16.1 | ||||
| Missing data | 0.1 | 0.0 | 0.0 | 0.1 | 0.0 | 0.0 | ||||
Spontaneous abortion before 28 completed weeks' gestation.
Weight (kg)/height (m)2.
“High” = persons with higher education (4 years beyond high school) or in management; “middle” = skilled workers and persons with middle-range training; “low” = unskilled workers and the unemployed.
Women who drank eight or more cups of coffee per day had twice the risk of fetal death of women who did not drink coffee (table 2). After adjustment for potential confounders, the risk was attenuated but remained high (hazard ratio = 1.59, 95 percent confidence interval: 1.19, 2.13). The risk increased with increasing coffee intake (p = 0.001 for trend), with no statistically significant departure from linearity (p = 0.26). The association was most pronounced for late fetal deaths (deaths following 20 completed weeks' gestation). However, we found no statistically significant interaction between coffee consumption and fetal death during specific periods of gestation (test for interaction: p = 0.45). When we repeated the analysis with entry times of 2–28 days after interview, the coffee-related risk of fetal death was further attenuated in all exposure groups and was no longer statistically significant, although the estimates pointed in the same direction (figure 1). Moreover, when we applied delayed entry in the stratified analysis, we found that the risk especially decreased during the period of less than 140 days but not for fetal deaths following 140 days (data not shown).
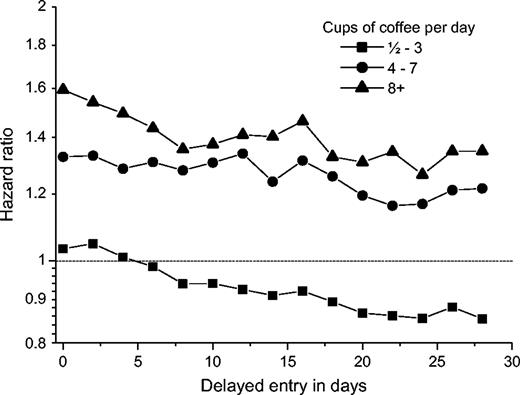
Adjusted hazard ratios for the relation between fetal death and maternal coffee consumption during pregnancy, according to time of delayed entry into the Cox regression model, Denmark, 1996–2002. Day 0 equals the time of interview.
Crude and adjusted hazard ratios for the relation between fetal death and maternal coffee consumption during pregnancy, Denmark, 1996–2002
Coffee consumption (cups/day) | All pregnancies (n = 88,482; 1,102 fetal deaths) | Pregnancies with complete information on covariates (n = 86,282; 1,058 fetal deaths) | ||||||||
|---|---|---|---|---|---|---|---|---|---|---|
| No. of fetal deaths | Crude HR* | No. of fetal deaths | Crude HR | Adjusted HR† | 95% confidence interval | |||||
| All fetal deaths | ||||||||||
| 0 | 577 | 1.00‡ | 561 | 1.00‡ | 1.00‡ | |||||
| ½–3 | 323 | 1.09 | 307 | 1.07 | 1.03 | 0.89, 1.19 | ||||
| 4–7 | 135 | 1.51 | 130 | 1.48 | 1.33 | 1.08, 1.63 | ||||
| ≥8 | 67 | 2.01 | 60 | 1.88 | 1.59 | 1.19, 2.13 | ||||
| Length of gestation | ||||||||||
| <140 days | ||||||||||
| 0 | 342 | 1.00‡ | 332 | 1.00‡ | 1.00‡ | |||||
| ½–3 | 193 | 1.17 | 184 | 1.15 | 1.11 | 0.93, 1.34 | ||||
| 4–7 | 69 | 1.38 | 67 | 1.36 | 1.22 | 0.93, 1.60 | ||||
| ≥8 | 39 | 1.99 | 33 | 1.75 | 1.48 | 1.01, 2.17 | ||||
| 140–195 days | ||||||||||
| 0 | 103 | 1.00‡ | 102 | 1.00‡ | 1.00‡ | |||||
| ½–3 | 54 | 0.96 | 53 | 0.95 | 0.92 | 0.66, 1.28 | ||||
| 4–7 | 30 | 1.74 | 29 | 1.70 | 1.53 | 1.00, 2.32 | ||||
| ≥8 | 17 | 2.78 | 16 | 2.68 | 2.29 | 1.33, 3.92 | ||||
| ≥196 days | ||||||||||
| 0 | 132 | 1.00‡ | 127 | 1.00‡ | 1.00‡ | |||||
| ½–3 | 76 | 1.03 | 70 | 0.98 | 0.95 | 0.71, 1.27 | ||||
| 4–7 | 36 | 1.61 | 34 | 1.58 | 1.42 | 0.96, 2.09 | ||||
| ≥8 | 11 | 1.45 | 11 | 1.53 | 1.30 | 0.70, 2.44 | ||||
HR, hazard ratio.
Adjusted for age, parity, smoking, prepregnancy body mass index, alcohol consumption, and socio-occupational status.
Reference category.
Including intrapartum deaths in the analysis as fetal deaths did not change the results; neither did excluding multiple births or women with prepregnancy diabetes. Including information on previous fetal death in the analysis did not change the results (data not shown). When we repeated the analyses with gestational age based on the last menstrual period or used only the woman's first pregnancy, adjusted hazard ratios were of similar magnitudes as those shown in table 2.
Using caffeine intake from both coffee and tea gave results identical to those for coffee alone. We found no association between consumption of tea or cola and fetal death (data not shown).
The effect of coffee consumption on fetal death was similar in smokers and nonsmokers (test for interaction: p = 0.55), alcohol drinkers and nondrinkers (test for interaction: p = 0.96), and nulliparous women and multiparous women (test for interaction: p = 0.96) (data not shown).
In the analysis of causes of stillbirth according to coffee consumption for women who entered the Danish National Birth Cohort between May 1, 1998, and April 30, 2001, we found that the risk of stillbirth due to placental dysfunction was increased among consumers of four or more cups or coffee per day (hazard ratio = 2.27, 95 percent confidence interval: 1.21, 4.28) (table 3).
Distribution of stillbirths by cause and adjusted hazard ratios for the relation between stillbirth and maternal coffee consumption in singleton pregnancies, Denmark, 1998–2001
Total no. of stillbirths* | Coffee consumption (cups/day) | |||||||||||
|---|---|---|---|---|---|---|---|---|---|---|---|---|
| ½–3 | ≥4 | |||||||||||
| No. of stillbirths* | Adjusted HR†,‡ | 95% CI† | No. of stillbirths* | Adjusted HR‡ | 95% CI | |||||||
| All stillbirths§ | 151 | 40 | 0.91 | 0.62, 1.35 | 28 | 1.21 | 0.77, 1.91 | |||||
| Cause of stillbirth | ||||||||||||
| Unexplained intrauterine death | 51 | 18 | 1.36 | 0.73, 2.53 | 8 | 1.34 | 0.56, 3.20 | |||||
| Placental dysfunction | 46 | 8 | 0.69 | 0.30, 1.62 | 15 | 2.27 | 1.21, 4.28 | |||||
| Umbilical cord complications | 21 | 7 | 0.89 | 0.34, 2.31 | 1 | 0.15 | 0.02, 1.35 | |||||
| Congenital malformation | 16 | 3 | 0.58 | 0.13, 2.49 | 3 | 1.24 | 0.23, 6.62 | |||||
| Other cause¶ | 11 | 4 | 1.12 | 0.34, 3.67 | 1 | 0.81 | 0.11, 6.07 | |||||
| Maternal disease | 6 | 0 | 0 | |||||||||
| Intrapartum deaths | 15 | 5 | 0.79 | 0.23, 2.69 | 0 | |||||||
No. of stillbirths with complete information on covariates used in the adjusted analysis.
HR, hazard ratio; CI, confidence interval.
Comparison of each specific type of stillbirth with all other births. Adjusted for age, parity, socio-occupational status, body mass index, smoking, and alcohol consumption. The reference group was nonusers of coffee.
Stillbirths were defined as fetal deaths occurring at ≥196 days' gestation. Intrapartum events, which were excluded from the stillbirth category, are presented separately in the last row.
Other causes included infections (n = 6), other specific conditions (n = 4), and unclassifiable causes (n = 1).
DISCUSSION
We found an elevated risk of fetal death according to coffee consumption in pregnancy, and the risk increased with increasing number of cups of coffee per day. The association was seen in all age groups.
Approximately 60 percent of eligible pregnant women joined the Danish National Birth Cohort. We expected the Danish National Birth Cohort not to be a representative sample of pregnant women but to be a large data source for internal comparisons. We would not expect nonparticipation to have been associated with both exposure and pregnancy outcome, since the participants were recruited before they knew the outcome.
A number of studies have reported similar associations between coffee or caffeine consumption and the risk of spontaneous abortion (2, 29–37), but not all (13, 38–40). This disparity may reflect differences in exposure ascertainment, since different caffeine conversion factors have been used in previous studies. The caffeine content in a cup of coffee or tea depends on cup size, brand, and brewing method. Bracken et al. (41) showed that there was considerable variability in the caffeine content of coffee and tea, even when the same respondent brewed coffee the same way on the same day. A biomarker measure of caffeine intake may provide a more precise estimate of exposure. The main metabolite of caffeine, serum paraxanthine, can be used to estimate caffeine intake (42). Klebanoff et al. (43) found that women with a paraxanthine level greater than 1,845 ng/ml (equivalent to six cups of coffee per day) had almost twice the risk of spontaneous abortion before 140 days' gestation of women with a serum paraxanthine level less than 50 ng/ml.
We had no information about brand of coffee or tea or brewing method, but the intake of decaffeinated coffee in Denmark is negligible. Furthermore, the use of instant coffee accounts for only 2 percent of total coffee consumption in Denmark (44). We had no information about the use of chocolate drinks or other drinks that contain caffeine, and our measure of cola consumption was too crude to be taken into account. However, one study showed that coffee accounted for 76 percent of caffeine intake and 23 percent of tea intake in Sweden (2), and we would expect that the contribution from cola in Scandinavia is minimal. We found no association with other caffeine-containing beverages like tea or cola, which may indicate that there is a threshold for the effect or that a component of coffee other than caffeine causes fetal death.
Some previous studies had very few participants with moderate-to-high consumption of caffeine (13, 31–34, 36, 38, 40, 45). In the present study, 13 percent of participants drank more than three cups of coffee per day, and 3.4 percent drank eight or more cups per day.
Information about coffee consumption and potential confounders was collected at approximately 16 weeks' gestation. We believe that the data are quite reliable, because coffee drinking during pregnancy is fully accepted in Denmark. In any case, misclassification was most likely small and nondifferential, which would have tended to attenuate associations. Coffee drinking is often closely linked to other lifestyle factors. Although we adjusted for a large number of factors, uncontrolled confounding cannot be ruled out. However, other confounders would need to be strong in order to explain our results. Information on coffee intake during pregnancy was missing for only 12 participants, and we were able to obtain information about pregnancy outcome for all but 34 participants, who left the country before giving birth. Thus, the association we observed was not caused by selection bias due to differential loss to follow-up.
The fetal deaths studied were those that we would expect to be related to caffeine intake, since caffeine is not known to cause chromosomal aberrations in humans. The proportion of losses with an abnormal karyotype decreases markedly with increasing gestational age (46, 47); thus, the associations we studied probably addressed chromosomally normal losses, since we mainly studied losses occurring late in gestation. Our results find support in previous studies that focused on caffeine consumption and risk of late fetal death (32, 34, 43).
The major limitation of this study was that we had incomplete information about early nausea and no data on coffee aversion. Nausea is significantly less common in pregnancies that end in miscarriage (48), and women with nausea may reduce their coffee intake more than women without nausea. It could be argued that the association we found between coffee and spontaneous abortion was due to reverse causation—that is, that coffee intake remains high in a high-risk pregnancy. However, Furneaux et al. (49) found no association between nausea or vomiting in pregnancy and coffee intake. Furthermore, we found no signs of changing risk over the course of gestation, which would be expected in this scenario, since pregnancy-induced nausea is a time-limited condition existing in early pregnancy.
Reverse causation could also happen if women with fetal death increase their coffee intake because their aversion towards coffee drinking disappears when the fetus dies, even if it still remains in the uterus. We would then expect to see associations' attenuating more the later follow-up is initiated after reporting of coffee intake, which we did. This was confined to early fetal deaths (prior to 20 completed weeks' gestation), suggesting that reverse causation may explain the increased risk for this group of fetal deaths. However, an attenuated effect would also be expected in such an analysis if the association is causal and the time between exposure and effect is short.
We found no statistically significant association between coffee consumption and the risk of stillbirth. Women consuming more than three cups of coffee per day had a twofold risk of stillbirth due to placental dysfunction in comparison with nonconsumers; this finding could possibly be due to chance. However, an animal study showed that the rate of apoptosis in the mouse placenta was higher when the pregnancy ended with intrauterine fetal death (50). Furthermore, fetal death and caffeine are associated with lower expression of the BCL-2 gene, which plays an important role in preventing apoptosis of the syncytiotrophoblast (51). Two previous studies have found an association between coffee consumption and stillbirth (22, 52). In a case-control study of 1,835 stillbirths, Little and Weinberg (22) found an elevated risk of stillbirth for women who consumed more than four cups of coffee per day. Wisborg et al. (52) found that women who consumed eight or more cups of coffee per day had nearly double the risk of stillbirth of nonconsumers, and this study was also based upon prospectively collected data.
If coffee causes fetal death, it is apparently not a sufficient cause, and the association could also be spurious. The lack of an association with other caffeine-containing products does not support a causal explanation if caffeine is the exposure of interest. However, coffee contains a number of other chemical compounds, and one or more of these could be physiologically active. Further studies might attempt to disentangle a caffeine effect from a noncaffeine effect by comparing different types of coffee drinkers. These studies should consider type of coffee (regular or decaffeinated), brand of coffee, and brewing methods. Brewing methods have a major impact on the content of caffeine and other substances in coffee.
Despite these uncertainties, it seems reasonable to apply the principle of precaution in this case. Coffee is not an essential beverage, and abstaining from drinking more than three cups of coffee per day during pregnancy is a minor intrusion in one's personal life.
The Danish National Research Foundation (Copenhagen, Denmark) established the Danish Epidemiology Science Centre, which initiated and created the Danish National Birth Cohort. The cohort study received a major grant from this foundation. Additional support for the Danish National Birth Cohort is obtained from the Pharmacy Foundation (Copenhagen), the Egmont Foundation (Copenhagen), the March of Dimes Birth Defects Foundation (New York, New York), and the Augustinus Foundation (Copenhagen).
Conflict of interest: none declared.
References
Danish Coffee Information. The ten most coffee drinking nations,
Cnattingius S, Signorello LB, Anneren G, et al. Caffeine intake and the risk of first-trimester spontaneous abortion.
Furuhashi N, Sato S, Suzuki M, et al. Effects of caffeine ingestion during pregnancy.
Vlajinac HD, Petrovic RR, Marinkovic JM, et al. Effect of caffeine intake during pregnancy on birth weight.
Fortier I, Marcoux S, Beaulac-Baillargeon L. Relation of caffeine intake during pregnancy to intrauterine growth retardation and preterm birth.
Goldstein A, Warren R. Passage of caffeine into human gonadal and fetal tissue.
Aldridge A, Bailey J, Neims AH. The disposition of caffeine during and after pregnancy.
Brazier JL, Ritter J, Berland M, et al. Pharmacokinetics of caffeine during and after pregnancy.
Knutti R, Rothweiler H, Schlatter C. The effect of pregnancy on the pharmacokinetics of caffeine.
Aldridge A, Aranda JV, Neims AH. Caffeine metabolism in the newborn.
Weathersbee PS, Lodge JR. Caffeine: its direct and indirect influence on reproduction.
Kirkinen P, Jouppila P, Koivula A, et al. The effect of caffeine on placental and fetal blood flow in human pregnancy.
Fenster L, Hubbard AE, Swan SH, et al. Caffeinated beverages, decaffeinated coffee, and spontaneous abortion.
Signorello LB, McLaughlin JK. Maternal caffeine consumption and spontaneous abortion: a review of the epidemiologic evidence.
Olsen J, Melbye M, Olsen SF, et al. The Danish National Birth Cohort—its background, structure and aim.
Kramer MS, Liu S, Luo Z, et al. Analysis of perinatal mortality and its components: time for a change?
Andersen KV, Helweg-Larsen K, Lange AP. Classification of perinatal and neonatal deaths: fetal, obstetrical and neonatal causes. (In Danish).
Cole SK, Hey EN, Thomson AM. Classifying perinatal death: an obstetric approach.
Hey EN, Lloyd DJ, Wigglesworth JS. Classifying perinatal death: fetal and neonatal factors.
Marsal K, Persson PH, Larsen T, et al. Intrauterine growth curves based on ultrasonically estimated foetal weights.
Little RE, Weinberg CR. Risk factors for antepartum and intrapartum stillbirth.
Wisborg K, Kesmodel U, Henriksen TB, et al. Exposure to tobacco smoke in utero and the risk of stillbirth and death in the first year of life.
Kesmodel U, Wisborg K, Olsen SF, et al. Moderate alcohol intake during pregnancy and the risk of stillbirth and death in the first year of life.
Cedergren MI. Maternal morbid obesity and the risk of adverse pregnancy outcome.
Stephansson O, Dickman PW, Johansson AL, et al. The influence of socioeconomic status on stillbirth risk in Sweden.
Simpson JL, Mills JL, Holmes LB, et al. Low fetal loss rates after ultrasound-proved viability in early pregnancy.
Stata Corporation. Stata statistical software, release 8.0. College Station, TX: Stata Corporation,
Giannelli M, Doyle P, Roman E, et al. The effect of caffeine consumption and nausea on the risk of miscarriage.
Rasch V. Cigarette, alcohol, and caffeine consumption: risk factors for spontaneous abortion.
Infante-Rivard C, Fernandez A, Gauthier R, et al. Fetal loss associated with caffeine intake before and during pregnancy.
Dlugosz L, Belanger K, Hellenbrand K, et al. Maternal caffeine consumption and spontaneous abortion: a prospective cohort study.
Fenster L, Eskenazi B, Windham GC, et al. Caffeine consumption during pregnancy and spontaneous abortion.
Srisuphan W, Bracken MB. Caffeine consumption during pregnancy and association with late spontaneous abortion.
Dominguez-Rojas V, Juanes-Pardo JR, Astasio-Arbiza P, et al. Spontaneous abortion in a hospital population: are tobacco and coffee intake risk factors?
Wen W, Shu XO, Jacobs DR, et al. The associations of maternal caffeine consumption and nausea with spontaneous abortion.
Tolstrup JS, Kjaer SK, Munk C, et al. Does caffeine and alcohol intake before pregnancy predict the occurrence of spontaneous abortion?
Mills JL, Holmes LB, Aarons JH, et al. Moderate caffeine use and the risk of spontaneous abortion and intrauterine growth retardation.
Parazzini F, Bocciolone L, Fedele L, et al. Risk factors for spontaneous abortion.
Kline J, Levin B, Silverman J, et al. Caffeine and spontaneous abortion of known karyotype.
Bracken MB, Triche E, Grosso L, et al. Heterogeneity in assessing self-reports of caffeine exposure: implications for studies of health effects.
Klebanoff MA, Levine RJ, DerSimonian R, et al. Serum caffeine and paraxanthine as markers for reported caffeine intake in pregnancy.
Klebanoff MA, Levine RJ, DerSimonian R, et al. Maternal serum paraxanthine, a caffeine metabolite, and the risk of spontaneous abortion.
Danish Coffee Information. The quantum of instant coffee in total coffee consumption,
Parazzini F, Chatenoud L, Di Cintio E, et al. Coffee consumption and risk of hospitalized miscarriage before 12 weeks of gestation.
Andrews T, Dunlop W, Roberts DF. Cytogenetic studies in spontaneous abortuses.
Hogge WA, Byrnes AL, Lanasa MC, et al. The clinical use of karyotyping spontaneous abortions.
Stein Z, Susser M. Miscarriage, caffeine, and the epiphenomena of pregnancy: the causal model. (Editorial).
Furneaux EC, Langley-Evans AJ, Langley-Evans SC. Nausea and vomiting of pregnancy: endocrine basis and contribution to pregnancy outcome.
Mu J, Kanzaki T, Si X, et al. Apoptosis and related proteins in placenta of intrauterine fetal death in prostaglandin F receptor-deficient mice.
Nomura K, Saito S, Ide K, et al. Caffeine suppresses the expression of the Bcl-2 mRNA in BeWo cell culture and rat placenta.

