

Abstract
Macromolecular biomaterials often require covalent crosslinking to achieve adequate stability for their given application. However, the use of auxiliary chemicals may be associated with long-term toxicity in the body. Oppositely-charged polyelectrolytes (PEs) have the advantage that they can self-crosslink electrostatically and those derived from marine organisms such as chitosan (CS) and carrageenan (CRG) are inexpensive non-toxic alternatives to glycosaminoglycans present in the extracellular matrix of human tissues. The aim of this study was to explore the properties of crosslinker-free PEC gels and freeze-dried PEC sponges based on CS and CRG precursors. We offer new insights into the optimisation of conditions and mechanisms involved in the process and offer a systematic study of property changes across a full range of pH values. Zeta-potential measurements indicated that the PECs produced at pH 2–6 had a high strength of electrostatic interaction with the highest being at pH 4–5. This resulted in strong intra-crosslinking in the PEC gels which led to the formation of higher yield, viscosity, fibre content and lower moisture content. The weaker interaction between CS and CRG at pH 7–12 resulted in higher levels of CS incorporated into the complex and the formation of more inter-crosslinking through entanglements and secondary interactions between PEC units. This resulted in the production of stable PEC sponge materials compared with the PEC materials produced at pH 6 and below. From the range of samples tested, the PECs produced at pH 7.4 appeared to show the optimum combination of yield, stability and homogeneity.
Export citation and abstract BibTeX RIS

Original content from this work may be used under the terms of the Creative Commons Attribution 3.0 licence. Any further distribution of this work must maintain attribution to the author(s) and the title of the work, journal citation and DOI.
Introduction
There is an increasing interest in the development of effective biomaterials that possess appropriate physicochemical and biological cues for their intended applications. Biomacromolecules such as polysaccharides have wide potential as biomaterials, but often require chemical crosslinking to confer appropriate stability and mechanical strength [1]. Some auxiliary crosslinker chemicals (such as glutaraldehyde) have been reported to be toxic and mutagenic, and their fate in the body is not always well understood [2]. 'Self-crosslinking' via electrostatic interactions (polyelectrolyte (PE) complexing) can avoid the use of cytotoxic crosslinkers whilst maintaining stability [3]. Unlike covalently crosslinked macromolecules, the advantage of polyelectrolyte complexes (PECs) is that no significant purification processes are required prior to administration [1]. The PECs are dynamic materials owing to their reversible electrostatic bonds and charged groups which make them highly sensitive to their surrounding environment (especially to pH, ionic strength and PE concentration). This dynamic structure can lead to controlled swelling and degradation, and may, therefore, be used for applications such as drug delivery and anti-fouling surfaces in changing physiological environments.
This research focuses on the preparation, and physicochemical characterisation of PECs based on chitosan (CS) and carrageenan (CRG) derived from shrimp shells and red seaweed, respectively. CS and CRG are less expensive than their glycosaminoglycan (GAG) counterparts found in the extracellular matrix of the body such as hyaluronic acid, chondroitin sulfate and heparin. The low costs are due to the abundance of waste shrimp shells and farmed red seaweed and their relatively simple extraction methods [4]. CS, a positively-charged polysaccharide is widely considered as the second most abundant organic material after cellulose [5]. CS possesses appealing intrinsic properties such as being biodegradable [6] and bacteriostatic [7]. CRG, a negatively-charged polysaccharide, can be an inexpensive alternative to heparin [8]. It contains highly sulfated charged groups which can provide non-thrombogenic properties to coatings.
Polysaccharides possess potential anti-adhesive characteristics due to their surface topography (roughness), physicochemistry (surface free energy, hydrophilic or hydrophobic, cationic or anionic behaviour) and molecular weights [9]. In addition, negatively-charged polysaccharides have been considered to be important for the electrostatic repulsion of cells due to the negatively-charged cell surface GAGs such as hyaluronic acid present around the cell membranes [10]. Hyaluronic acid coatings on glass slides have been successfully used to reduce the adhesion of S. epidermidis and E. coli by several orders of magnitude compared with unmodified glass slide [11]. Commercial products of hyaluronic acid coatings are currently used to minimise post-surgery adhesion (tissue attachments on implants). Heparin is another widely-used polysaccharide for the coating of coronary stents, however to date this has not been found to reduce thrombosis and restenosis over non-coated coronary stents [12]. Heparin has been blended with CS to form films with antithrombotic properties that prevent platelet adhesion and thrombosis [13]. Dermatan sulfate has been polymerised with polyurethane at different degrees of substitution and was found to reduce the in vitro adhesion of platelets, red blood cells, macrophages and bacterial cells (E. coli) on all copolymer films compared with the unmodified polyurethane [14]. A study carried out by Bratskaya et al (2007) [15] showed antibacterial and anti-adhesive responses from CS-CRG multi-layered coatings when tested with two Enterococcus faecalis strains isolated from infected biliary stents. The results showed that the multilayers were better at reducing bacterial deposition in comparison with the glass control and covalently grafted CS. The adhesion of negatively-charged bacteria was higher on CS terminated multilayers than CRG terminated multilayers. However, the CRG terminated multilayers showed no antibacterial activity. Both CS [16] and CRG [17] are commonly found to be non-toxic and it can be predicted that these materials would be suitable in anti-fouling applications. Examples can include coatings for urinary catheters or coronary stents.
The motivation for using CS-CRG PECs as opposed to CS and CRG alone is the potential for stable coatings, gels, films and sponges without further crosslinking, purification or modification. For example, once the PEC gel is produced, it can be solvent cast into non-porous films [18] or freeze-dried into porous sponges [19]. CS hydrogel alone can be too brittle for some applications [20] and control of drug delivery for such hydrogels can be poor [1]. CS is also highly soluble in acidic conditions due to its pKa value of 6.4 [21]. CRG is soluble in water and therefore cannot be used in its pure form without covalent crosslinking [22]. CRG is also known to be more hydrophilic than CS [23], and therefore the mechanical and hydration properties of CS-CRG PECs may be tailored by controlling the composition.
In this research, a rigorous approach to the synthesis and characterisation of PEC gels and sponges is presented. Previous research has shown that pH is a highly influential parameter on the charge density of PEs which could alter the physicochemical properties of PECs [24]. However, there are currently no detailed studies investigating the effect of pH on the physicochemical properties of CS-CRG PECs. This study will improve the understanding of the effect of electrostatic complexing and self-crosslinking type upon the stability of the material. It is hypothesised that varying the pH during PEC preparation will have a significant influence on the strength of the electrostatic interaction and ultimately on the viscosity of PEC gels and stability of PEC sponges produced.
Method
Materials
Low molecular mass CS (72 mPa s, 1% w/v in 1% v/v acetic acid at 25 °C) with 93.1% degree of deacetylation and κ-CRG (6.4 mPa s, 0.3% w/v in H2O at 25 °C) were purchased from Sigma-Aldrich, UK. The CS was sourced from Pandalus borealis (cold water shrimp) shell in Iceland. The CRG was sourced from Chondrus crispus (red seaweed) in the Philippines.
Zeta-potential
The ζ-potential of CS (0.1% w/v) and CRG (0.1% w/v) were determined with a Zetasizer Nano ZS (Malvern Instruments Ltd, Malvern, UK) at 25 °C. Experiments were performed at pH values ranging from 2 to 12 at one pH-unit intervals. A wide range of pH values was tested to assess the possible interaction window and the strength of the electrostatic interaction was calculated (ζCS × ζCRG = mV2) according to Weinbreck et al (2004) [25].
Preparation of PEC gels
For a unit molar ratio of 1:1 CS-CRG, approximately 1.53 g of CS (0.38% w/v) and 4.40 g of κ-CRG (0.63% w/v) were dissolved in 400 ml of 0.16 M HCl and 700 ml of ultra-pure type 1 water respectively for 24 h under vigorous magnetic stirring. The pH of the CS solution was increased from 2 to 4 using approximately 10 ml of 5 M NaOH. The κ-CRG solution was heated to 60 °C before the mixing reaction using a water bath. The CS solution was kept at 20 °C and added to the CRG solution in a drop-wise fashion at a rate of 14 ml min−1 (figure 1).

Figure 1. A schematic diagram showing the preparation of PEC gels and final products.
Download figure:
Standard image High-resolution imageThis process was repeated to obtain PEC mixtures prepared at pH 3–10 at 1-unit intervals. The PE mixture was then poured into 50 ml centrifuge tubes and centrifuged (Hermle LaborTechnik Z300, Germany) at 4500 rpm (3222 × g) for 2 min and washed twice with ultrapure type 1 water to remove the dissociated counter ions and unreacted CS and CRG by decanting the supernatant. Subsequently, the PEC gel was homogenised at 13.500 rpm for 1 min using a medium-sized homogenizer (VR, VDI 25, UK) while cooling using an ice box. The homogenised PECs were then centrifuged again to remove the excess water used during homogenising. All homogenised PECs were stored at 4 °C until further use.
Optical microscopy
Optical micrographs were taken using bright field illumination with an optical microscope equipped with dry lenses (GX Microscopes, L2000B HTG, UK) and a digital camera (Moticam, 3.0 MP, China). A drop of PEC gel suspension (non-homogenised) was placed on a microscope glass slide and covered with a glass coverslip (22 mm diameter × 0.17 mm thickness) by ensuring no air gap is trapped between the sample and the coverslip.
Yield and moisture content of PEC gels
After PEC gel preparation, the total PEC mass was measured using an analytical balance (Sartorius, BP61 model, Germany) with an accuracy of ±0.1 mg. Three samples of approximately 0.1–0.3 g were weighed before and after freeze-drying. The samples were freeze-dried at −20 °C and 80 mTorr for 17.5 h until completely dry, as was confirmed by TGA. The PEC yield was determined by mass using the following equation:

where mi is the total pure PE powder mass used to make the PE solutions i.e. 5 g, and md is the mass of the dried PEC. The moisture content of PECs was analysed using the following equation:

where mw is the mass of the wet PEC sample and md is the mass of the dry PEC sample after freeze-drying.
Nitrogen, carbon and sulphur (NCS) elemental analysis
The composition of the freeze-dried complexes and individual materials was determined by measuring the amount of nitrogen present in PECs. The elements were measured using NCS element analyser (FlashEA 1112, Thermo Fischer Scientific, Italy). The instrument was calibrated using a sulphanilamide standard. Approximately, 1–2 mg of lyophilised samples for 17.5 h at 80 mTorr were measured using a microbalance (Sartorius, Cubis-MSA, Germany) with a sensitivity to ±0.1 μg. The materials were placed inside tin container catalysts and heated to 980 °C. The materials were combusted, and the elements present were converted into simple gases (CO2, N2 and SO2). The machine identified the total N and C to the precision of 0.1 μg. The raw data of N measured by the machine was presented in mass% and were subsequently converted into mol%.
Fourier transform infrared spectroscopy
The PEC gels produced at different pHs were freeze-dried for 17.5 h at 80 mTorr before analysis. The PECs were analysed using an FTIR instrument (Spectrum 100 Perkin Elmer, USA) with attenuated total reflectance using a zinc selenide (ZnSe) crystal. The absorbance values of CS and CRG were analysed independently. The non-complexed mixture of CS and CRG were also analysed and compared with the PECs to confirm complex formation by electrostatic interaction. Electrostatic interaction of PECs was confirmed using the absorbance values at 1592 and 1216 cm−1.
Rheology
The viscosity of PECs was determined using a rheometer (Discovery Hybrid 2.0, TA Instruments, USA). The temperature during measurement was controlled at 20 °C using a Peltier element. A parallel plate (stainless steel) geometry (0°, 40 mm) was used with a gap of 500 μm between the flat surfaces of both elements. For each sample, approximately 1 ml of PEC gel sample was used. The flow curves were obtained at increasing shear rate (flow sweep or rate sweep) from 0.01 to 100 s−1.
Preparation of sponges
CS solutions were prepared by dissolving CS 1% w/v in 0.16 M HCl for 24 h. CRG solutions were prepared by dissolving CRG 1% w/v for 24 h followed by 1 h of heating at 60 °C until fully dissolved. CS and CRG solutions (1 ml) were cast in 48 well-plates (14 mm diameter and 20 mm depth) made of treated polystyrene (Corning® Costar®, Sigma-Aldrich, UK). The solutions were then freeze-dried in a VirTis AdVantage 2.0 benchtop freeze-dryer (Biopharma Process Systems, UK). In summary, the solutions were frozen to −20 °C at a constant cooling rate of 1 °C min−1. The temperature was then held constant at −20 °C for 8 h. The ice phase was sublimed under vacuum (0.08 Torr) at 0 °C for 24 h. The freeze-dried sponges were then immersed in 1 M NaOH and 1 M KCl solutions respectively for 24 h using a shaker at 100 rpm. The sponges were subsequently washed with ultrapure type 1 water for 1 h and 1 min respectively using a shaker at 100 rpm. The wet sponges were then freeze-dried again using the same freeze-drying protocol mentioned above. The homogenised PEC gel (1 g) was placed into 48-well plates and freeze-dried using the same protocol.
Swelling of sponges
Cylindrical sponges (14 mm diameter and varying heights) were submerged in 5 ml ultrapure type 1 water at RT for 14 h. The swollen weight of the sponges (water uptake of pores and struts) was found by gently blotting the wet samples with tissue paper to remove the excess water. The percentage water uptake by the sponges was calculated using the equation below:

where mw is the mass of the wet sponge at a specific time point, and m0 is the initial mass of the dry sponge. The percentage water uptake by the struts was obtained by compressing the sponges between tissue paper to remove all the water present within the pores of the sponges. It was calculated using the equation below:

where mws is the mass of the wet struts of the sponge. The percentage water uptake by the pores in the sponge was calculated using the equation below:

Results
In figure 2(a), the ζ-potential of CS and CRG are presented for pH values ranging from 2 to 12. The ζ-potential of CS is shown to be at a maximum (+30 mV) at pH 2–5. As the pH was increased to pH 8 (with the addition of NaOH), the ζ-potential decreased gradually towards neutrality (0 mV). The ζ-potential of CRG was found to be strongly negative and remained relatively constant throughout the pH range studied from pH 3 (−60.6 mV) to pH 10 (−68.9 mV). The PECs at 1:1 molar ratio displayed a negative ζ-potential across the full range of pHs tested. The strength of electrostatic interaction (SEI) of PECs at a particular pH was predicted by multiplying the CS charge with the CRG charge measured at the same pH (figure 2(b)).

Figure 2. (a) ζ-potential of CS, CRG and CS-CRG 1:1 molar ratio at different pH value. (b) The strength of the electrostatic interaction (SEI) for CS-CRG and the solid content of PEC gels. Mean ± SD, n = 3.
Download figure:
Standard image High-resolution imageThis suggested that the interaction between CS and CRG is greatest at pH 4 and 5. The SEI is corroborated by the maximum PEC yield of 85% which occurred at pH 5.
The prepared PE complex gels after the washing and centrifuging protocol are shown in figure 3(a). The pH strongly influenced the appearance and consistency of the PE complex gels. A dense white precipitate was formed at 3 ≤ pH ≤ 7 and a translucent watery complex coacervate at 7.4 ≤ pH ≤ 12. The optical micrographs in figure 3(b) show that the PEC gels contained fibrous structures. The PECs at low pH range displayed more fibres with shorther chain lenths. These fibres were formed through the coagulation and entanglement of the reacting PEs. However, at higher pH, only large bundled fibres were observed. At low pH, the fibres were tightly packed and difficult to resolve under the OM.

Figure 3. (a) Visual assessment of CS-CRG PECs at pH 3–12 after washing and centrifugation protocol (non-homogenised). (b) Optical micrographs of PEC gels prepared at different pH conditions.
Download figure:
Standard image High-resolution imageIn figure 4(a), the % nitrogen and % sulfur of all candidate materials is shown in molar %. The nitrogen content, which depicts the amount of CS in the PEC, increases at higher pH. Although the interaction strength reduces with increasing pH up to pH 6 (figure 2(b)), the composition was unchanged over this range (figure 4(a)). The PECs produced at the higher pH range (pH 9–12), contained approximately 30% more CS than PECs produced at the lower pH range (pH 3–8). The moisture contents of PECs prepared at higher pHs (range 9–12) were approximately eight times larger than the moisture contents present in PECs prepared at lower pH range (3–7). The FTIR spectra were used to confirm the electrostatic interaction during PEC formation (figure 4(b)).

Figure 4. (a) The effect of pH on the molar composition of PECs. The result is based on the % nitrogen. Mean ± SD, n = 3. (b) FTIR data of CS, CRG, CS and CRG non-complexed mixture and CS-CRG complexes (pH 3–12). Red ellipses are highlighting the wavenumbers for the confirmation of electrostatic interaction within PECs.
Download figure:
Standard image High-resolution imageThe characteristic absorption bands for CS were at 1650 and 1587 cm−1 and for CRG at 1230, 914, 844 cm−1. During PEC formation, the sulfate group (1230 cm−1) in CRG shifted to 1216 cm−1 and the band in CRG at 1630 cm−1 and band in CS at 1650 cm−1 were shifted and combined to form a stronger peak at 1634 cm−1. At pH 8 and above no PEC formation could be confirmed, as there was no trough present at 1529 and 1216 cm−1. The absence of complex formation was also confirmed by mixing unreacted CS with CRG powder (dark blue curve), which appeared to have the same fingerprint region as the non-complexed PECs produced at pH 8–12.
In figure 5, the PECs prepared at pH 3–5 showed viscosities two orders of magnitude higher than those found in PECs prepared at higher pH values (6, 7, 7.4, 8 and 9). The appearances of the sponges before and after swelling are shown in figure 6(a).

Figure 5. The viscosity of PEC gels prepared at different pH range (3–9) and measured at a shear rate of 0.01 s−1.
Download figure:
Standard image High-resolution image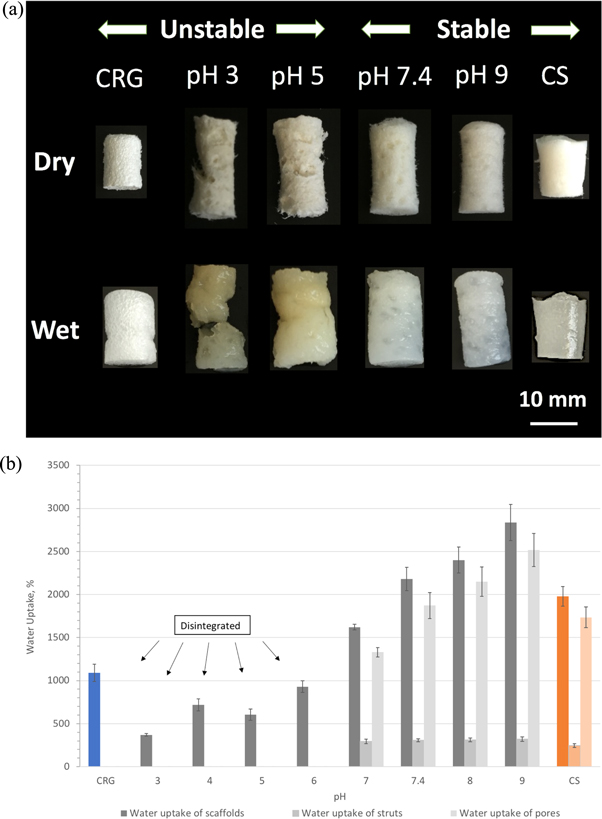
Figure 6. (a) Appearance of CRG, CS and PEC sponges prepared at pH 3, 5, 7.4 and 9 before and after swelling. Sponges were submerged in PBS at RT for 14 h. Unstable sponges: CRG, PEC pH 3 and PEC pH 5. Stable sponges: PEC pH 7.4, PEC pH 9 and CS. (b) Water uptake of the sponges when submerged in ultra-pure type 1 water at RT for 14 h.
Download figure:
Standard image High-resolution imageThe CRG and the PECs prepared at pH 3 and 5 were more prone to disintegration, whereas the CS and PECs prepared at pH 7.4 and 9 remained intact and stable when submerged in water for 14 h. The water uptake is greater for the materials prepared at higher pH (figure 6(b)). The maximum water uptake was observed for pH 9 PEC which could hold 28 times its original weight. The PECs prepared at pH 3, pH 5 and CRG disintegrated in the swollen state during handling. For that reason, the water uptake of the struts and pores could not be determined for the low pH PECs and CRG samples.
Discussion
The effect of pH on PE charge density and Interaction
The pH is considered to be one of the strongest factors that affect the charge density of PEs [26]. When the charge density changes, the three-dimensional configuration and flexibility of PE also changes. It is widely accepted that when the ζ-potential is ≤−30 mV or ≥+30 mV, then the PE solution is stable (dispersed) due to the high repulsion of like-charged PEs. This creates an extended polymer chain that is stiff. However, when the temperature increases, the chains of the PEs are still charged but conform to a random coil-like structure [27]. PEs that are being neutralised will turn into a random-like conformation because the charge repulsions on polymer backbones are cancelled.
The acid dissociation constant (pKa) of CS has been reported to be around 6.5 [28]. When CS powder was dissolved in acid, NH2 groups were protonated by the hydrogen ions in the acid giving rise to positively-charged – groups (equation (6)). This was the state when CS was dissolved in acid. In contrast, the addition of a base e.g. NaOH deprotonates the –
 groups back to NH2 groups which result in the precipitation of CS (equation (7)) and therefore CS exhibits a weak PE behaviour. This was the state when CS was precipitated in alkali. CS was found to be 17% positively-charged at pH 7.4, which was found to closely match with the results previously obtained by Denuziere et al (1996) [29], exhibiting a positive charge of 16% at pH 7.4. In CS, the switchover to negative values in the pH range 8–13 is likely due to the screening of NH2 groups of CS by the excess hydroxide ions from the added alkali (equation (8)).


In contrast, the negative ζ-potential values of CRG are the result of dissociation of –OSO3K giving rise to – in CRG molecules (equation (9)). This was the state when CRG was dissolved in water. The sulfate groups of CRG can also exist in conjugated form with calcium and sodium ions. Even though the pKa value of CRG was reported to be at pH 2 [30], the ζ-potential for CRG was unexpectedly still very high at pH 2 (−28 mV). Therefore, CRG exhibits a strong PE behaviour. Similar ζ-potential values were previously found in CRG from pH 2–7 at a concentration of 0.5 wt% [31]. However, the ζ-potential values of CRG at pH 8–12 were not reported before. The significant increase in Na+ and OH− ions may have also led to the disruption of the CRG gel helices and thereby further exposing the negatively-charged groups leading to strong negative ζ-potential as found for pH 11 (figure 2(a)) [32, 33].

Equation (10) shows the electrostatic reaction between CS and CRG and the release of counter ions in the form of salt. Formation of PE complexes is the result of interactions between the amino groups and the sulfate groups present in CS and CRG, respectively [34]. The PEC complex in this study displayed a negative ζ-potential across all pH range. This may have been caused by the dissolution of the CRG molecules into the solvent mixture and the higher opposite charge density.

The SEI is an empirical estimate of the electrostatic strength between the PEs at different pH conditions. The ζ-potential measurements showed that the attraction between PEs (SEI) is strongest at pH 3–5 and weakest at pH 8–12 as was presented in figure 2(b). Similar results were found previously, where the interaction between CS and gum-arabic (GA) was the highest between pH 3.5–5 and lower at pH 2 and 6 due to the protonation of GA below pH 3 and the deprotonation of CS above pH 5 [24].
The effect of pH on PEC yield
The PEC yield was used to determine the effect of pH on the efficiency of PEC formation between CS and CRG. At pH 5 the interaction between CS and CRG produced the highest complex yield of 85%. Espinosa-Andrews et al (2007) [35] previously found a similar result, where the maximum complex yield (92%) between GA and CS appeared to be at pH 5 regardless of the CS concentration used (0.25, 05 and 1% w/w). Similarly Huang et al (2014) [36] showed the highest complex yield between GA and CS at pH 4.5. The reasons stated for the high complex yield at pH 5 was that the charge densities of the PEs were stoichiometrically balanced, allowing for greater complexation to occur with higher complex yield. The low yield and high moisture content of PEC gels produced at high pH are the product of the neutralised CS and strongly negatively-charged CRG, respectively.
The effect of pH on PEC gel composition and viscosity
Overall, it can be concluded that the viscosities of the PEC gels were dominated by the electrostatic interactions rather than the composition and moisture contents of the PECs. The increase in pH from 5 to 8 led to a lower SEI and consequently a lower viscosity. Although the interaction strength was reduced by increasing pH, the composition was unchanged over the pH range of 3–8. Unexpectedly, the moisture content appeared not to be dependent on the composition of the PECs prepared at pH 3–8. Nor did the moisture content show a significant effect on the viscosity. This can be confirmed at pH 5 and 6, where the viscosity of the PEC gel at pH 5 was about two orders of magnitude higher than the gel at pH 6, and the moisture contents and compositions were approximately the same. The PECs prepared at pH 9–12 exhibited an increase in the fraction of CS and the moisture content but changed the viscosity only very little when compared to the substantial viscosity change caused by the electrostatic interactions from pH 5 to 6. However, the SEI at pH 6 did not match with the viscosity measurement, and therefore it is important to note that the SEI results from the ζ-potential measurements can only provide an approximate prediction of the strength of PEC interactions.
Confirmation of electrostatic Interaction
FTIR measurements were carried out to confirm the presence of electrostatic interactions as this was not possible with the NCS elemental analysis technique. The absorbance band at 1529 cm−1 in figure 4(b) was only visible after PEC formation and was thought to be due to  –
– that is responsible for the electrostatic complexing. Electrostatic PEC formation was confirmed for the PECs prepared at pH 3–7.4.
Desired PEC viscosity for producing freeze-dried sponges
Florczyk et al (2011) [37] recommended that the viscosity of the CS-alginate PEC slurry should be below 300 Pa s to produce uniform pores in sponges because the migration of growing ice crystals becomes difficult at high viscosity leading to large and irregular pores. The PE complexes produced at pH 3–7 showed the highest yield but did not have suitable viscosities for the production of uniform freeze-dried PEC sponges. According to the measured viscosities, the most appropriate pH candidates for uniform sponge production of CS-CRG PEC gels would be those prepared at pH 7.4 and above. Hence, the best results to control porosity in freeze-dried sponges is to have the lowest viscosity possible without compromising on the mechanical properties of the final freeze-dried structure.
Swelling and stability of PEC sponges
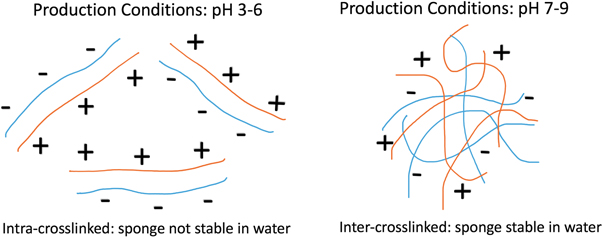
The amount of water taken up by the sponge depends on the material hydrophilicity and on the capability of pores to retain fluid. In fact, on average the pores in the sponge were taking up six times more water than the PEC strut materials. The reason for the lower stability of PEC sponges prepared at low pH was because the PEC gels were mainly intra-crosslinked while PECs prepared at high pH were mainly inter-crosslinked which provided the higher stability (figure 7). The stability is formed by the entanglements and secondary forces such as van der Waals, hydrogen bonds and hydrophobic interactions between adjacent PEC particles.
Figure 7. Schematic representation of the CS-CRG PEC molecules can be divided into two main crosslinking types: intra-crosslinked PECs prepared at lower pH conditions which results in unstable sponge structures and inter-crosslinked PECs prepared at higher pH conditions which results in stable sponge structures.
Download figure:
Standard image High-resolution image
Conclusion
Although complexing can be encouraged at low pH conditions, the structure formed when freeze-dried does not create interconnecting networks that are sufficiently strong to resist immersion in water. Water removed structure gives the opportunity to bond further as molecules are brought into closer proximity. At low pH it is likely that chains are bound in pairs with few networking links. At high pH production conditions, CS dominates but the addition of some CRG enhances stability which suggests relatively small number of charge interactions with a more restricted structure which is more resistant to water after freeze-drying. Therefore, to stabilise the structure it is not reliant on the number of interactions, (too many lead to more binary binding between chains) but on sufficiently little to allow broader network formation. Overall, the level of bonding can be optimised to create self-crosslinked structures by using high pH conditions. Too much bonding in pair wise structures does not lead to formation of sufficiently connected networks with freeze-dried structure not stabilised.
Acknowledgments
The authors would like to thank the Cambridge Home Scholarship Scheme (CHSS) for providing financial support to NAZ and the ERC Advanced Grant 320598 3D-E for funding this project. The underlying open data for this article may be found at https://doi.org/10.17863/CAM.30969.