


Abstract
The study involves preparing starch nanocrystals by acid hydrolysis of starch and to produce a new chemical crosslinking starch nanocrystals/gum Arabic blend in the presence of potassium persulfate (K2S2O8) as an initiator. The new materials were characterized and its potential utilization in controlled drug delivery and cancer therapy were investigated. Crosslinked starch nanocrystals/gum Arabic blends were loaded with hydroxyurea drug. The properties of starch nanocrystal was characterized by x-ray diffraction (XRD), atomic force microscopy (AFM), Fourier transform infrared spectroscopy (FTIR) and scanning electron microscopy (SEM). The starch nanocrystal /gum Arabic blends were analyzed in vitro drug release studies by using UV–vis spectroscopy. The swelling test and MTT assay were also investigated. The drug release and the swelling test were monitored at pH7.4 and pH4. XRD result showed that starch nanocrystal was the crystalline A-type. Starch nanocrystal showed a high degree of crystallinity compared with the native starch. The experimental results proved that starch nanocrystal/gum Arabic/hydroxyurea blends reduced the swell ability of blends which lead to slow release of hydroxyurea, and the rate of hydroxyurea release was significantly higher at pH7.4 than pH4, at constant incubation time. The swelling ratio and drug release were decreased by using starch nanocrystal/hydroxyurea while the swelling ratio and drug release using starch nanocrystal/gum Arabic/hydroxyurea blend were lowest. The results of vitro cytotoxicity study showed that the 100 μg ml−1 hydroxyurea concentration killed ∼39% colorectal cancer cells while ∼27% of cells were killed by using starch nanocrystal/gum Arabic/hydroxyurea blends at the same concentration for 24 h of incubation. It was concluded that the hydroxyurea loaded starch nanocrystal/gum Arabic blend enhanced the controlled drug release system thereby, revealing a novelsvehicle for cancer therapy.
Export citation and abstract BibTeX RIS
1. Introduction
Drug delivery is one of the major rapidly advancing areas of science in which chemical engineers and chemists are contributing to human health care. Such delivery systems present several benefits in comparison with conventional dosage types due to less toxicity, enhanced efficacy, patient convenience and compliance [1]. Drug delivery utilization for managed release technology is considered to target the drug into particular cells or organs within the body, to manage the time and the level of drug within the body in a controlled therapeutic time, and to overcome cellular barriers and assured reaching the target tissue [2].
Starch (ST) is the most abundant organic compounds in nature. It consists of glucose units (C6H10O5)n with n ranging from 3 × 10² to 103 [3]. Chemically, starch is composed of a combination of 2 polymers called amylopectin and amylose. Amylopectins are much larger and highly branched polymer with a molecular weight (Mw) of 5 × 10-102 million Dalton. The molecules contain α-(l → 4) linear bounds and are branched at α-(l → 6) linkages, while a linear polymer, known as amylose, has Mw of <5 × 10⁻¹ million Dalton. Amylose macromolecules consist of α-D-glucopyranose units connected through α-(1 → 4) acetal linkages [3]. Starch nanocrystals (SNC) are crystalline platelets that result from the disruption of the semicrystalline structure of starch granules by acid hydrolysis [4]. When native starch is subject to acid hydrolysis, regions of amorphous phases and low lateral order in the starch granules begin to disintegrate, whereas the largely crystalline water unsolvable lamellae remained undissolved [5]. An aqueous suspension of nanocrystals starch from sulfuric acid hydrolysis of waxy maize starch was prepared by Angellier et al [6].
Gum Arabic (GA) is the dried gummy, natural biopolymer, highly branched polysaccharide formulated from the tree sap of Acacia Seyal and Senegal trees which grow principally in the African region of Sahe in Sudan [7]; it is well known as a stabilizing, thickening, emulsifying agent in the food industry [8]. GA has been recognized as an acidic polysaccharide containing D-glucuronic acid, L-rhamnose, D-galactose, and L-arabinose [7].
The blending of GA with starch open the possibility to improve the variety properties and applications of the blended outcome. Due to noble physio-chemical properties, gum Arabic is generally utilized for forming a gel or thickens in an aqueous system to manage water inside a mixture. GA also functions as a crystallization inhibitor, emulsion stabilizer, emulsion agent, encapsulating agent, foam stabilizer, or syneresis inhibitor. GA has the ability to delay the release of amylose in starch due to the forming of stable polymeric network that entrap the granules of starch [9]. Shalviri et al [3] characterized the properties of the new crosslinking gelatinized starch/xanthan gum hydrogel system with sodium trimetaphosphate as a crosslinker, and investigated its potential uses in controlled drug delivery.
Hydroxyurea (HU) is a simple organic antimetabolite compound that has been used clinically for many years as an anticancer chemotherapeutic agent in the treatment of essential thrombocythemia, sickle cell anemia, HIV infection, leukemia, hematologic malignancies, and other diseases [10]. It is freely soluble in water but nearly dissoluble in alcohol and greatly hygroscopic in nature, therefore must be stowed in a sealed container or with a desiccant [11].
The aim of this study was preparation of a new chemical crosslinking SNC/GA blend with various ratios of SNC and GA in the presence of K2S2O8 as initiator. FTIR and SEM tests were used to characterize the structure for new polymer material. The drug release and cytotoxicity assay were used to estimate the controlled drug delivery and cancer therapy using HU as a drug. The swelling ratio and drug release of SNC/GA blends were studied at different pH values. In the vitro anticancer activity of this new drug using human colorectal cancers cell, LS-174 cell lines was evaluated in terms of cell viability percentage or cytotoxic effect using MTT assay. To the best of our knowledge, no systematic investigation on the influence of SNC/GA/HU blend on the human colorectal cancers cell has been conducted.
2. Experimental procedure
2.1. Materials
Maize starch (C6H10O5)n containing amylopectin 72%, amylose 28%, was purchased from Alpha Chemika, India; sulfuric acid (H2SO4) (98%) (Hi Media Co., India); gum Arabic from Elnasr, Sudan; potassium persulfate (K2S2O8) was obtained from Maknur Co., Canada; polyvinylalcohol (PVA) (Mw ∼ 18000–12000) from Panreac Co., Spain; hydroxyurea purchased from Apotex Inc. Canada; dimethylsulfoxide DMSO (Central drug house Co., India), isopropanol purchased from GCC, UK and buffer saline tablets were purchased from Flow Laboratories, UK. All other reagents of an analytical grade for in vitro studies were used.
2.2. Preparation of starch nanocrystals (SNC)
Acid hydrolysis process was prepared according to the procedure reported by Angellier et al [9], and Brenda et al [12] with slight modification. A 150 g weight (15 wt%) of starch granules were blended in 1000 ml of 3.16 M sulfuric acid solution at room temperature under constant stirring at 200 rpm for 3 weeks. They were shaken with an orbital action at a speed for 1 min four times a day to ensure a more homogeneous hydrolysis. After repeated centrifugation, the SNCs were washed in deionized water until the pH reached approximately 7. Droplets of chloroform were added to the suspensions and stored at 4 °C until use.
2.3. Preparation of SNC/GA blends
The product was furnace dried (DZ-2BC vacuum dry box, Tianjin, China) at 40 °C to get the SNC powder. New polymer materials were prepared with different ratios, which are 4:0, 3:1, 2:2, 1:3, 0:4 of SNC:GA [13], by using K2S2O8 as an initiator. Briefly, a known weight of starch was dissolved in 100 ml of deionized water followed by the addition of different quantities of GA under continuous mechanical stirring (Labinco L-81, Netherlands) for 15 min. The cross-linking was then initiated by adding K2S2O8 accelerator 12.5% (depending on the dry weight of polymer) to the mixture at 65 °C. After 3 h the reaction was stopped as it was reported [14]. The mixture of a polymer was then isolated by centrifugation (Sigma 2-16PK, Germany) at 4000 rpm for 20 min, then washed with deionized water and dried in a furnace at 55 °C [3].
2.4. Preparations of HU/SNC/GA blends
The prepared SNC/GA polymer (4 g) was dissolved in 40 ml deionized water. HU was used as a drug model. The concentrations of HU were 25% (w/w) with respect to the polymer amount. A selective weight of HU (1 g) was blended with the minimum volume of deionized water. The mixture of HU/Polymer was suitably blended in deionized water by a magnetic stirrer, and an aqueous solution containing polyvinyl alcohol as stabilizer and emulsifier was added dropwise. Polyvinyl alcohol concentration was 3% (w/v) aqueous solution as reported earlier [15]. The prepared emulsion was scattered by applying sonication and homogenization via ultrasonic dispersion machine (sonifier150, Branson, USA) for ten min at room temperature. The last dried blends were stored until use. Table1 represented the composition of HU/SNC/GA blends.
Table 1. The composition of polymer /HU blends.
| Materials | C0 | A00 | C1 | C2 | C3 |
|---|---|---|---|---|---|
| SNC(g) | 4 | — | 3 | 2 | 1 |
| GA(g) | — | 4 | 1 | 2 | 3 |
| K2S2O8 (SNC + GA)*0.125 | — | — | 0.5 | 0.5 | 0.5 |
| PVA % (w/v) | 3 | 3 | 3 | 3 | 3 |
| HU %(from the dry polymer) | 25 | 25 | 25 | 25 | 25 |
2.5. Characterization of SNC, SNC/GA blend and HU/SNC/GA blend
2.5.1. Fourier transforms infrared spectroscopy (FTIR)
Chemical structures of pure SNC, pure GA, SNC/GA blend, HU/SNC/GA blend were examined by FTIR spectroscopy (Alpha-Bruker, Germany). FTIR spectra of each sample were recorded at 4 consecutive scans, resolution of 40 cm−1, and a frequency range of 600 cm−1 to 4000 cm−1 in the transmittance mode. Before analysis, the samples were dried at 40 °C for 24 h to avoid interference of moisture. Small quantities of the powder were placed on the lens and pressed prior to measurement.
2.5.2. X-ray diffraction analysis (XRD)
Wide angle XRD analysis (XRD-6000, Shimadzu, Japan) was performed on powders obtained from both ST and SNC. The XRD showed the crystalline nature of the SNC and their corresponding unmodified starch. The samples were sited in a 2.5 mm deep cell. The operating divergence slit, tube current, and generator voltage were 0.3 mm, 30 mA, and 40 kv, respectively. The performing conditions for the diffractometer were: Cu Kalfa radiation (λ = 1.54060 A), the diffraction angle (2θ) range from 4°–80° at a step length of 0.02° and counting time 0.15 s.
The degree of crystanallity was calculated using equation (1)

where: Ac is the crystalline area, Aa is the amorphous area and At is the total area [16].
2.5.3. Scanning electron microscopy (SEM)
The size, shape, and surface features of the SNC, SNC/GA blend and HU/SNC/GA blend were examined by SEM (Quanta FEG 250, USA). Nanocrystal starch was ultrasonically homogenized for 10 min to ensure the good dispersion of the nanocrystal in deionized water. SEM was operated at 20 kV. Before the examination, the starch powder was dried in a hot air oven at 40 °C for 12 h and mounted on a stub with carbon tape. Then, prior to experiment, the sample to be examined was coated with gold to prevent charging of surface under electron beam [17].
2.5.4. Atomic force microscopy (AFM)
AFM was performed using a nano compact (NCLR-50, phywe, Germany) operated in tapping mode. A drop from starch was extended onto a mica substrate and desiccated at ambient temperature overnight. Tapping mode was utilized with single beam cantilever with a resonant frequency of 190 kHz, the tip fixed on 225  m long, and the corresponding spring constant was 48 N m−1. Nano Scope measurements were utilized for offline data measurements.
2.6. The swelling ratio (SR)
The SR of the samples were performed by immersing dried samples (polymer/HU) 10 mg in 1.5 ml of buffer solution at different pH (4 and 7.4) at 37 °C. These solutions correspond to the pH environments of the stomach and colon, respectively. At specific time intervals, buffer solution medium was removed by centrifuge (Centrifuges3k30, Sigma, USA) at 4000 rev/min for ten min. The sample was then weighed on a CPA2P analytical balance (Sartorius, Germany). The SR of samples was calculated using equation (2):

where W wet:- is the weights of swollen powder, W dry:- is the dried sample as described before [18].
2.7. Drug release
Prior to the release tests, the mixture of HU/polymer was trimmed in order to obtain disc shape (D = 12 mm, t = 1 mm) [19]. In vitro drug release characteristics from polymer/drug blends were carried out in a buffer solution at pH4, pH7.4 at a temperature of 37 ◦C. The concentration of HU release was measured at a variety of duration interval by UV–vis spectrophotometer (UV-1650 pc, Shimadzu, Japan) after drawing suitable calibration curve. A known weight of polymer/HU mixture was kept in individual vials containing buffer solution of pH4, pH7.4 (1 mg ml−1). The mixture was heated at 37 ˚C. At a certain time interval, 1 ml of aliquots was taken out to measure the amount of HU released [15]. The concentration of HU release was determined with UV–vis spectroscopy by interaction with urea kit at definite intervals of time.
2.8. MTT assay
The MTT (3-[4,5-Dimethylthiazol-2-yl]-2,5-diphenyl tetrazolium bromide) assay is a colorimetric assay used to evaluate the cytotoxic potential of new drug on cancer cells. LS-174 is a human colon cancer cell line gained from the American Type Culture Collection that is commonly used to study cancer biology. Cells were seeded in 96wеll p1аtes (Lab-Tek and Nunc, USA) at a concentration of 1.0 × 10⁵ cells/ml and incubated (MC-20A CO2 incubator, SNT, Korea) at 37˚C for 24 to 48 h. Afterward, culture media (minimum essential media, Roswell Park Memorial Institute medium (RPMI)) with L-glutamine) was replaced and different concentrations (1, 10, 100, 500 and1000 μg ml−1) of free polymer, free HU, control and polymer/HU were added to cultured wells at a volume of 102 μl in per wells except for control cells. All samples were cultured in triplicate. The plates were incubated for 24 h at 37 °C in a humidified atmosphere containing 5% CO2. To avoid any contamination, the microtiter-plates were moved to level 2 biohazard safety cabinets with sterilized environment, and the media in all wells were discarded. To avoid any residual amounts of composites or a standard anticancer drug used that may interact with MTT reagents, the LS-174 cell monolayers were washed three times with phosphate buffer saline solution. Then the cell culture was treated with 20 μl/well MTT (Bioworld Co., USA), plates were incubated at 5% CO2, 37 °C for 2 h, the formazan particles were formed as a mitochondrial enzymatic process of the unaffected viable LS-174 cells, the dead or viral affected cells were not forming formazan particles because its mitochondria organelles were disrupted. Formazan crystals were dissolved in diluted DMSO (1:1) in isopropanol in each well including blank wells and absorbance was taken at optical density of 490 nm using microplate reader (ELx800 absorbance microplate readers, Biotek, USA) and the cell viability percentage was measured using equation (3) [20, 21] :

where At, Ab and Ac were the absorbance value of test compound, blank and control, respectively.
3. Results and discussion
3.1. FT-IR analysis of sample
Figure 1(a) shows FTIR result using pure SNC, pure GA, and SNC/GA blend. For SNC, a typical spectrum of enclosed absorption bands at 3299.06 cm−1 revealed the O–H groups stretching vibration in the glucose units [4], and the peaks at 2924.20 cm−1 and 1340.13 cm−1 ascribed to the C–H stretching and –OH bending, respectively [4, 22]. The peak at 1638.98 cm−1 was presumably attributed to C–O vibrations present in the starch [23]. The characteristic peak occurred at 1146.95 cm−1 was ascribed to O–C stretching of the C–O–C linkages in the glucosidic rings, which made up the spectra of starch backbone [23]. The peak at 854.80 cm−1 was assigned to a methene vibration [24]. The FTIR spectra of pure GA are dominated by OH stretching vibrations at 3272.57 cm−1 [25]. The C–H stretching modes are riding over the broad peak at 2913.77 cm−1 [26]. The carbonyl symmetric stretching modes (C=O) are observed at 1602.08 cm−1 and 1406.48 cm−1. The characteristic from 900–1200 cm−1 was the fingerprint of carbohydrates [27]. O–H bending peaks were detected at 1015.60 cm−1 [28].
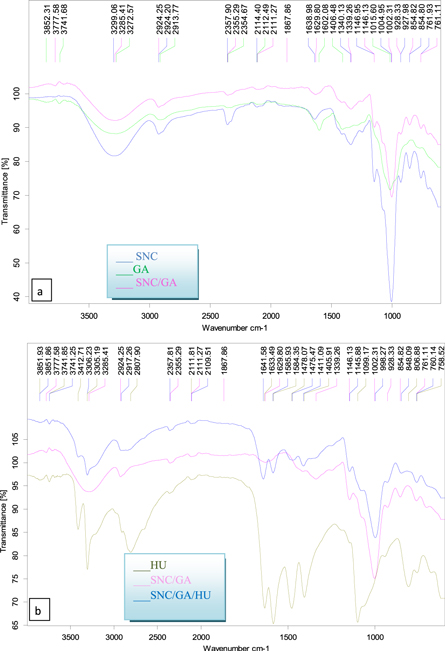
Figure 1. FT-IR spectra for (a) SNC, GA, and (2:2) SNC/GA blend, (b) pure HU, C2 blend.
Download figure:
Standard image High-resolution imageFor SNC/GA, a small shift in the wave number for hydroxyl group stretching vibration peaks from 3299.06 to 3285.41 cm−1 was found due to the increase in the hydrogen bonding between the SNC and GA [29]. Also, the intensity of OH stretching band in the SNC/GA blend was decreased after blending, possibly due to the occurrence of reaction between SNC and GA [3].
Figure 1(b) demonstrated FTIR results for pure HU, and these results indicated that the two strong peaks of N–H stretching was observed at 3412.71 and 3305.19 cm−1 [30]. The peak at 1633.49 cm−1 was corresponding to C=O [30], and the peak of N–H bending appeared at 1584.35 cm−1 while the peak of C–N showed at 1478.07 and 1099.17 cm−1 [31]. The FT-IR of HU-loaded SNC/GA blend was presented in figure 1(b). The position of the peaks band of HU in HU-loaded SNC/GA blends was changed, where the peaks of –OH group are present at 3306.23 cm−1, the N–H stretching appears at 3741.85 cm−1 while the peak at 2917.26 cm−1 is identical to the C–H stretching [32]. Moreover, the peak at 1641.58 cm−1 was referred to C=O group [30], and the peaks at 1585.93 cm−1 and 1411.09 cm−1 are corresponding to C–O vibrations and –OH bending, respectively and the unsymmetrical vibrations of C–O–C bond appeared at 1145.88 cm−1 [31].
3.2. Microscopy
SEM photograph of SNC is shown in figure 2(a). The degraded and destructured granules have been observed for SNC [16] and its surface was deformed by acid treatment. The adhesion between some of the granules strongly affected the granule morphology [33], which showed densely agglomerated broken crystals [12]. The hydrolysis acid causes an increase of the surface roughness [33].
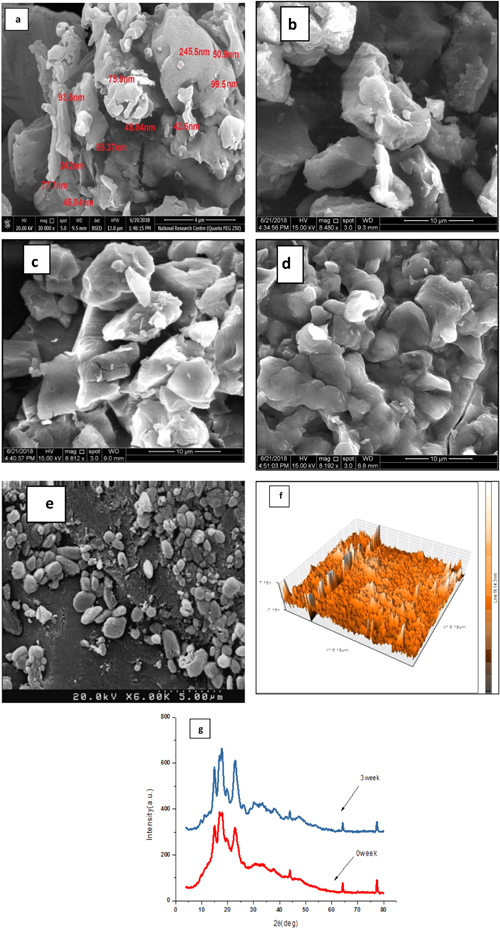
Figure 2. (a) SEM of SNC produced after three week hydrolysis time, (b) SEM of SNC:GA (3:1) blend, (c) SEM of SNC:GA (2:2) blend, (d) SEM of SNC:GA (1:3) blend, (e) SEM of C3 blend, (f) AFM image (3D) of SNC produced after three week hydrolysis time, (g) x-ray diffraction patterns of starch before and after acid hydrolysis.
Download figure:
Standard image High-resolution imageThe sizes of SNC were determined using SEM and AFM. Starch aggregation has been showed for nanocrystal as shown in figure 2(a). This aggregation was due to the formation of a hydrogen bond resulting from the interaction of hydroxyl groups on the surface of SNC [34]. After three weeks, acid hydrolysis starch produced nanocrystals. The nanocrystal starch diameter was ranged between 42.6–244.264 nm as shown in figure 2(a). Figure 2(f) was used to present the surface topography as a 3D image and illustrated the thickness of SNC, which is 14.3 nm.
The homogeneity and microscopic surface structure of the SNC/GA blend were examined using SEM as shown in figures 2 (b)–(d). When GA was added to SNC, the irregular particles with obvious aggregation were observed [35]. GA SNC blends displayed solid shape with a larger average size than neat starch size. The introduction of SNC/GA blends contributed substantially to a reduction in roughness. Exclusion of cracks and porosity was observed on the surface of GA/SNC blends, which lead to reduce water absorption. Moreover, the reduction in roughness was increased with increasing GA proportion [36]. It was observed that the interfacial adhesion and interaction among SNC and GA facilitated the enhancement in the maintenance of integrity and strength of particles [37]. HU-loaded nanocrystal starch/GA blends display a spherical form and have a smooth surface with more regularities structure as illustrated in figure 2(e). The sphere-shaped particles are appropriate for drug delivery utilization and high possibility for cell entry [38].
3.3. XRD results
In figure 2(g), the XRD pattern for native ST and SNC. Native ST the A-type crystallinity pattern is being displayed. The crystallinity pattern does not change after treatment. However, SNC displayed an increase in the reflection peak intensity compared to their native ST. It was expected due to selective hydrolysis of the amorphous regions of starch via acid that lead to a more distinct crystalline region. Similar observations were previously described by Mukurumbira for production of SNC from amadumbe ST [34]. Increasing the intensity of the peaks at 2θ = 19.9° was the most noticeable. This peak is related to individual helices with a crystalline arrangement; these results are in agreement with the previous report by de la Concha [12]. Increasing the intensity of the peaks at 2θ of 15°, 17°, 18°, and 23° was also observed in SNC which was produced by acid hydrolysis, with an unresolved large doublet between 17°−20°. The proportion of crystallinity in ST increases with acid hydrolysis. This meant that the amorphous parts degraded by acid preferentially as reported by Chen et al [39].
3.4. Results of swelling
The results of the swelling ratio increased with time. The swelling increased rapidly during the first hours of reaction followed by slow increase later, which appeared almost flattened as shown in figure 3 because the porous network of SNC became saturated with water molecules with no more room for further accommodation, which is similar to the results reported by Kaith et al [40]. It is clear that the swelling of C0 blend improved with raising of the pH value of the medium as shown in figure 3. This may be attributed to electrostatic interaction and hydrogen bonding as reported by Nizam El-Din et al [41]. The increase in pH value leads to increase in swelling of anionic SNC because of 2 significant phenomena that happen concurrently. First, the increase in the charge density due to ionized acidic groups lead to increase in cationic concentration differences between the inner and outer surface of SNC that resulted to increase osmotic pressure between SNC and external solution as previously reported [42]. These changes ultimately caused easier penetration of external solution in the SNC network resulted in higher swelling. A second possible phenomenon is electrostatic repulsion amongst anions on SNC surface which also increased the expansion rate of SNC chains leading to higher swelling as reported by Solanki et al [42]. At pH4, there was very little chance of electrostatic repulsion amongst anions on SNC surface which suggest the expansion of SNC chains lead to slower swelling than swelling at pH7.4 as previously reported [42].
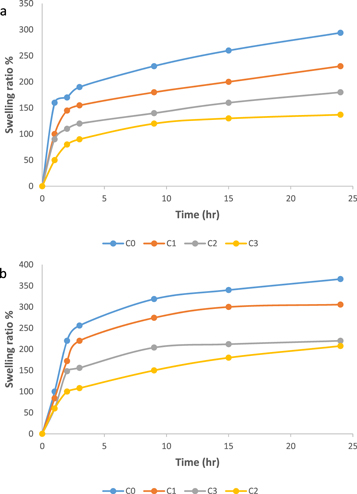
Figure 3. Swelling behavior of C0, C1, C2, C3 blends in (a) pH4, (b) pH7.4.
Download figure:
Standard image High-resolution imageThe swelling ratio of C1, C2 and C3 blends were determined and are shown in figure 3 at pH4 and pH7.4, respectively. The GA with SNC blend may lead to a decrease the water sensitivity of the blends. This phenomenon can be attributed to the formation of a rigid SNC network due to strong hydrogen bonding between SNC, strong interactions between SNC and GA chains as reported earlier [5] and increase crystallinity with SNC as previously reported [43], resulting in decreasing the swelling and water absorbance of the blends as reported by Ghasemlou et al [5].
The swelling behavior of C1, C2, and C3 blends showed a predominant pH-dependence. It was swelled markedly at pH4 but swells rapidly with time at pH7.4 until collapse, which is similar to the results reported by Qi et al [44]. The hydrophilic natures of SNC and GA (mainly because of D-glucopyranosuronic acid moieties) along with the ionic groups (OH–) were the main causes for the absorbency. At pH7.4, the electrostatic repulsion between OH groups caused an improvement of the swelling ratio as reported by Gils et al [45]. The lower swelling ratio can be observed at C2 blend. On the other hand, the swelling behavior was restricted at pH4 because of strong hydrogen-bond interactions and the maintenance of the network structure, which resulted from cross-linking between SNC and GA blends, which is similar to the results reported by Lin et al [37]. It was also observed that the lowest swelling ratio occurred at C3 blends, and the reason may be due to the nature of starch and gum Arabic in different pH.
3.5. In vitro release assay
The release in figure 4 increased with the increase in time. Short release time of pure HU is due to a simple diffusion process. When HU is loaded with polymers (C0, C1, C2, C3), the small burst release of the HU from HU/polymers was recognized due to the HU molecules entrapped at or near the surface of SNC as reported earlier [46].
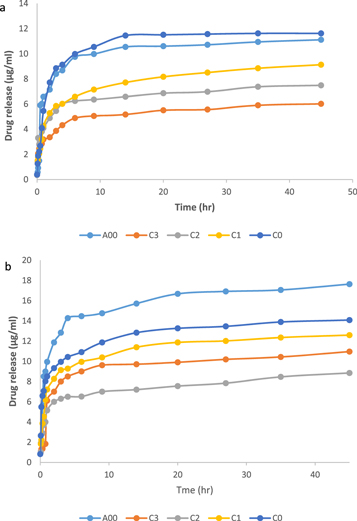
Figure 4. Release of drug for A00, C0, C1, C2, C3 blends at (a) pH4, (b) pH7.4.
Download figure:
Standard image High-resolution imageThe C0 blend has a slow release of HU as shown in figure 4 [46]. It may be due to the high intensity of OH group for SNC as shown in FTIR results which the interaction of OH with –NH2 group of HU formed rigid nanocrystal structure, which leads to hinder the escape route of drug molecules to reduce swelling and exhibited noticeable sustained release profiles as previously reported [47]. The HU release of C0 blend was studied in two different buffered solutions (pH4 and pH7.4) as shown in figure 4. The HU release from loaded SNC was sensitive to the pH. The release of drug from C0 blend was maximum at pH7.4 while the minimum release was observed at pH4. At pH4, the response with respect to pH was due to the reduced swelling ability of SNC as shown in swelling test, leading to reduction in the release of HU as illustrated in figure 4(a) and reported by Wang et al [18]. On the other hand, when the pH increases to 7.4, a great number of anionic groups on the starch are present, as previously reported [42, 48]. This makes the starch chains repel one-another leading to expanding dimension or high swelling of the C0 blend as reported by Solanki et al [42]. Thus the release of HU increases as shown in figure 4 (b).
For C1, C2, C3 blends shown in figure 4, the reduction in release behavior of HU increased in comparison with C0. The good dispersion of SNC in GA leads to increase physical cross-linking through hydrogen bonding between them as reported by Lin et al [49]. This indicated that the addition of GA could significantly enhance the capacity of SNC for controlling HU release. Similar results were shown by Li et al [35]. At pH4, the reduction in HU release of C1, C2, C3 blends was increased compared to C0, as shown in figure 4(a). This may be due to the reduction in swelling for these blends as shown in swelling results. Moreover, the HU release from C0 is greater than A00, thus it was concluded that the reduction in HU release was increased with the increasing GA proportion observed at C3. At pH7.4, the amount of HU release from C1, C2, C3 blends tended to swell and disturbed the structure of particles, which lead to a higher porosity in the particle structure, and enhanced the drug release rate as previously reported [50] in comparison with pH4 for the same blends, as shown in figure 4(b). In addition, the HU release from A00 is greater than C0. It was determined that the slowest HU release from C1, C2, C3 was observed in C2.
3.6. MTT assay results
The cell viability assays were performed to evaluate the anticancer activity of pure SNC, pure GA, Pure HU, HU/SNC, HU/GA, and HU/SNC/GA at different ratio. Pure SNC, GA and their mixture showed little or no significant effect on the cell viability percentage as shown in figure 5, possibly due to it is biocompatibility as reported by Pandey et al [15, 51], while the treatment with pure HU and HU-loaded biocompatible materials significantly decreased the viability of LS-174 cells with the increase in HU concentration. On the other hand, the formulated A00, C0, C1, C2, C3 blends showed a significant decrease in viability of LS-174 cells.

Figure 5. Cells viability % of LS-174 cell after treated with SNC, GA, SNC/GA, HU, A00, C0, C1, C2, and C3 blends.
Download figure:
Standard image High-resolution imageFigure 5 demonstrated the reduction of cell viability of the C1, C2, C3 blends as compared with pure HU. The results showed that for C1, C2, C3 blends, C3 showed higher cell viability. On the other hand, it was observed that the increase in cell viability was as the following order: C3 > C2 > C1 > C0 > A00 > HU. This may be attributed to the low concentrations of HU release from these blends as shown in drug release results. The toxicity of pure HU, which is higher than C1, C2, C3 blends, can be described through the fact that pure HU molecules are imported to cells by passive diffusion mechanism, while C1, C2, C3 blends should first be captured by cells through a possible endocytosis mechanism and thus HU molecules are released gradually into cells Zohreh et al [52].
At 1 μg ml−1 concentration, C3 blends decrease cell viability up to 90% after 24 h, whereas at high concentration (1000 μg ml−1), cell viability decreases up to 37% after 24 h. On the other hand, HU at 1 μg ml−1 decreases cell viability up to 78% after 24 h, and 25% cell viability were observed at 1000 μg ml−1 concentration in a similar time frame, as shown in figure 5. Hence, cytotoxicity of C1, C2, and C3 is found to be less as compared to pure HU due to sustained and slow release of drug as reported by Pandey et al [53]. It was determined that C3 blend are better than pure HU and other blends for controlled drug delivery as a novel vehicle for cancer therapy.
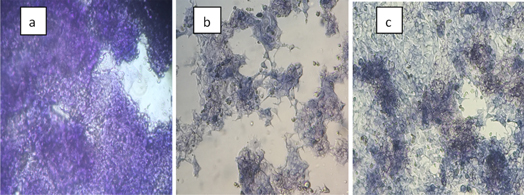
Figure 6 displays the image of cells after treatment with pure starch nanocrystal, pure HU and C3 blend. The colored formazan indicates good cells health which appears in pure starch nanocrystal (biocompatible materials). On the other hand, most dead cells were observed in pure HU. Moreover, C3 shows the sluggish rate of cells death. The sluggish rate of cells death was indicated to the sustained release of HU from C3 blends produced at a concentration of 100 μg ml−1.
Figure 6. Morphology of LS-174 cells density after treatment with (a) pure starch nanocrystal (b) pure HU, (c) C3 blend at concentration of 100 μg ml−1.
Download figure:
Standard image High-resolution image
4. Conclusions
On the basis of the experimental study conducted on starch and gum Arabic as a carrier for a drug, the following findings were noted.
- 1.The chemical modification of natural polysaccharides starch using H2SO4 acid hydrolysis for 3 weeks was produced. The three weeks hydrolysis of starch gives a high percentage of crystallinity and nanocrystal starch was obtained to be 14.3 nm thickness.
- 2.Cross-linked between two natural polysaccharides SNC/GA blends were successfully synthesized for drug delivery process. The decreasing in the intensity of FT-IR spectra results for SNC/GA blend confirms that there is a reaction between SNC and GA.
- 3.SEM of HU-loaded SNC/GA displayed spherical shape, smooth surface with a more regular structure which leads to conclude that SNC/GA blends are best suited for drug delivery.
- 4.The slow release rate of HU has been demonstrated with SNC. The SNC/GA blends delayed the release of HU. On the other hand, the extent of release was found to be dependent on the pH medium and the ratio of SNC to GA in the blends. The swelling ratio decreased with SNC and its blends were lowest. The drug release and swelling ratio of the SNC/GA/HU blends decreased with increasing GA content, especially at C2, C3 blends.
- 5.All blends used showed that the swelling ratio and release rate were high at pH7.4 and low at pH4, therefore it can control the release of HU.
- 6.In vitro anticancer activity of SNC/GA/HU blends using human colorectal cancer cell line LS-174 submitted that the rate of cells death depends on the rate of release of HU from SNC/GA/HU blends. The results showed that C3 appeared to have the highest cell viability. Pure SNC, GA and their blend showed little or no significant effect on the cell viability percentage.
- 7.Finally, the results showed that the SNC/GA blends could possibly be used in pharmaceutical applications since these particles have excellent drug carrier properties and a promising material for the design of novel drug delivery system that tends to control the release formulations of HU in comparison with free HU by reducing the adverse side effects.
Acknowledgments
Authors would like to thank the Materials Engineering Department, Faculty of Engineering, University of Kufa to facilitate the process of research and writing this paper.