

Abstract
Solution-phase nanoparticles are widely used in surface-enhanced Raman scattering (SERS) but provide limited quantitative information because of their dynamic optical properties. To overcome this problem, silica membrane stabilized solution-phase nanoparticles composed of silver cores and gold shells (Ag@Au@SiO2) are synthesized, characterized, and used for predictable and quantitative detection of 4-aminothiophenol using SERS. Two key parameters including local effective refractive index and void volume near the metal cores are correlated to SERS activity. First, the effective local refractive index and void volumes formed near the metal surface are characterized using the localized surface plasmon resonance of the Ag@Au nanoparticles and semi-empirical dielectric modeling for the porous silica membrane. The characteristic electromagnetic field decay length is estimated at 11 nm while both linear and nonlinear refractive index sensitivities are found to be 170 and 360 nm/RIU, respectively. The internally etched silica membrane stabilized Ag@Au@SiO2 nanoparticles can be engineered to exhibit effective local refractive indices ranging from 1.366 to 1.458. Second, SERS signals associated with these nanomaterials and 4-aminothiophenol are shown to indirectly depend on the effective local refractive index, which directly correlates to increasing void volume in the silica near the metal particle. This effect is attributed to well-controlled molecule-accessible volumes near the metal surface where the local electric field strength is largest. Finally, small variations in the effective refractive index (±0.01), nanoparticle concentration, and nanoparticle to molecule concentrations influence the magnitude of the SERS signal. As such, these findings are expected to improve the design and surface modification of solution-phase SERS-active substrates for quantitative and reproducible SERS detection.
Export citation and abstract BibTeX RIS
1. Introduction
Metal nanoparticles exhibit localized surface plasmon resonance (LSPR) spectra, which can be exploited for molecular detection using surface-enhanced Raman scattering (SERS) [1–4]. SERS can be performed with either bottom-up or top-down synthetic strategies. While top-down prepared SERS substrates can exhibit a high degree of spatial reproducibility, limitations of mass transport during an assay for trace molecules can increase detection time additionally beyond those required for building up a detectable molecular concentration. In contrast, bottom-up prepared nanomaterials can be synthesized in large scales at a relatively low cost and exhibit ∼1000x greater mass transport of small molecules vs. top-down SERS materials. As such, bottom-up prepared SERS-active nanomaterials, which are widely availability, easy to synthesize, and easy to structurally tune provide ideal platforms for studying impacts of surface chemistry on the magnitude of SERS signals.
Both bottom-up and top down SERS substrates induce the SERS phenomenon, which relies on at least two mechanisms for molecular detection [5–15]. The largest SERS enhancement factor depends on the LSPR spectra of the nanostructured substrate, which gives rise to strong electromagnetic fields that extend several nanometers away from its surface [6, 8–16]. The second contribution is a short range chemical effect, which arises from the electronic coupling of, charge transfer between, and adsorption of a molecule on a nanostructure [17–19]. Both mechanisms are hypothesized to broaden the molecular orbitals, which subsequently can overlap with the LSPR of the nanostructures [20–22].
For these mechanisms to result in detectable average SERS signals, molecules must diffuse toward the plasmonic nanostructured surface and interact at short metal to molecule separation distances. Surface functionalization can be used to promote selective interactions between molecules and the nanostructured surface at these length scales. For instance, molecular adsorption can be promoted using specific surface chemistry, which facilitates binding and detection [23]. Silica, for instance, is a structurally versatile, biocompatible, and optically transparent protective material which can be subsequently modified with a variety of different chemical functionalities. If these layers are porous, target molecules can interact with the metal through the porous regions of this layer and be detected using SERS [2].
Previously, bottom-up synthesized internally etched silica coated gold nanoparticles were used as SERS substrates for the direct and quantitative detection of molecules [1, 4, 24]. Modest signal enhancements were observed from these materials and were facilitated by the formation of internal voids in the silica membrane near the metal nanoparticle core, which facilitated molecular diffusion [1]. Furthermore, the silica membranes were shown to also maintain the electromagnetic properties of the nanoparticle even when nanoparticle aggregation occurred. In a separate study, SERS substrates were prepared so that controlled three-dimensional volumes where SERS activity was maximized were designed [25]. The three-dimensional SERS volumes were defined as the focal volumes associated with optimal optical scattering. Maximizing the number of scattered photons generated in these volumes was shown to increase SERS signals [25, 26] and lower limits of detection for small molecules [25, 27–29].
Herein, internally etched silica membrane stabilized gold coated silver (Ag@Au@SiO2) nanospheres with well characterized morphologies and silica properties are synthesized to better understand how internal void volumes and effective local refractive index impact the reproducibility of SERS signals for 4-aminothiophenol. Transmission electron microscopy (TEM), LSPR spectroscopy and dielectric modeling are used to estimate effective local refractive indices. The resulting silica membranes are used to systematically vary the three-dimensional SERS volumes near the surface of Ag@Au nanoparticles, and 4-aminothiophenol is used to evaluate how SERS signals vary as a function of effective refractive index as well as molecular and nanoparticle concentrations. By exploiting the effective refractive index surrounding internally etched Ag@Au@SiO2 nanoparticles, quantitative and reproducible SERS detection is achieved.
2. Materials and methods
2.1. Materials
Gold(III) chloride trihydrate, sodium citrate dihydrate, Amberlite MB-150 mixed bed exchange resin, (3-aminopropyl) trimethoxysilane (APTMS), sodium chloride (NaCl), sodium trisilicate (27%), tetraethyl orthosilicate (TEOS), silver perchlorate, sodium borohydride, and hydroxylamine hydrochloride were purchased from Sigma. Ethanol, ammonium hydroxide (NH4OH), hydrochloric acid (HCl), and nitric acid (HNO3) were purchased from Fisher Scientific (Pittsburgh, PA). Ultrapure water (18.2 MΩ cm−1) was obtained from a Barnstead Nanopure System and used for all experiments. All glassware items were cleaned with aqua regia (3:1 HCl:HNO3) and rinsed thoroughly with water and oven (glass) or air (plastic) dried overnight before use.
2.2. Nanoparticle synthesis
Ag@Au nanoparticles were synthesized using a seeded growth method previously described in the literature [30, 31]. Briefly, 100 mL of a 0.3 mM sodium citrate solution prepared in nitrogen-purged water was stirred on an ice bath in the dark. Freshly prepared sodium borohydride (final concentration = 1 mM) was added to the citrate solution. Next, 1 mL of 10 mM silver perchlorate was added to the solution within 2 min, and the resulting silver nanoparticle solution was stirred for 3 min. Stirring was stopped, and silver nanoparticles with average diameters of 11.5 ± 3.2 nm formed within 3 h. Next, 20 mL of water was added to 25 mL of as-synthesized Ag seeds and stirred for ∼2 min (4 °C). Fifteen mL of both 6.25 mM hydroxylamine hydrochloride and 0.465 mM gold salt were added slowly (3 mL min−1) using a syringe pump. This Ag@Au nanoparticle solution was stirred for 1 h to ensure nanoparticle formation and stored at 2–4 °C until use. The concentration of these materials was estimated using a standard estimation model for the silver seeds [32], and an average diameter of 18.5 ± 2.3 nm was determined using TEM.
Silica shells on Ag@Au (Ag@Au@SiO2) nanoparticles were synthesized via a modified Stöber method [24, 33–35]. Briefly, the pH and conductivity of 25 mL of the as synthesized Ag@Au nanoparticles were adjusted to 5 and ∼110 μS cm−1 using NH4OH and Amberlite resin, respectively. After resin removal via filtration, 129.2 μL of 1 mM APTMS was added drop-wise to the nanoparticle solution (with stirring). After 30 min, 201 μL of 2.7% sodium silicate was added slowly to the solution and stirred for 24 h. The silica shell thickness was further increased by adding ethanol (final ratio of 1 part water to 4.4 parts ethanol). After 6 h, 20 μL of 1 mM APTMS and 20 μL TEOS were added. The pH of the solution was increased to ∼11 using concentrated ammonium hydroxide. After 16 h, the Ag@Au@SiO2 nanoparticles were centrifuged (45 min, 9383xg) three times with ethanol then three times with water. The Ag@Au@SiO2 nanoparticles were then passed through Sephadex-50 column to remove Ag@Au nanoparticles that did not contain complete silica shells [2] and stored in ethanol until use. These samples exhibited average diameters of 48.7 ± 6.4 nm with an average silica shell thickness of 15.1 ± 6.8 nm.
Silica shells were converted into silica membranes via an internal silica etching process induced at basic pH values. Because the Ag@Au@SiO2 nanoparticles were stored in ethanol, the samples were triply centrifuged and redispersed in water to a concentration of 3 nM. Concentrated NH4OH was added to the solution to induce internal etching [1, 24]. The reaction was quenched by adding 100 mM HNO3 until the solution pH was ∼6. Finally, the nanoparticles were washed 3 times in water and passed through a Sephadex-G50 column to remove defect particles. These samples exhibited average diameters of 46.1 ± 6.0 nm with an average silica shell thickness of 13.8 ± 6.5 nm.
2.3. TEM
TEM was performed using a JEOL JEM-1230 microscope equipped with a Gatan CCD camera. Samples were prepared on 400 mesh copper grids that were coated with a thin film of Formvar and carbon (Ted Pella). The nanoparticle solution was diluted in a 50% water−ethanol mixture, and ∼10 μL of the solutions were pipetted onto grids and dried. At least 200 nanoparticles were analyzed (Image Pro Analyzer) to estimate average nanoparticle diameters, and average silica shell thicknesses were determined by calculating the differences between Ag@Au and Ag@Au@SiO2 nanoparticle diameters (error is from propagated error in these measurements).
2.4. Extinction and SERS spectroscopies
LSPR spectra were collected using disposable methacrylate cuvettes (pathlength = 1 cm) and an ultraviolet–visible (UV–vis) spectrometer (Ocean Optics USB4000). Either deuterium or halogen lamps were used for UV and visible excitation, respectively. LSPR spectra were collected in transmission geometry every minute for 2 h (integration time = 60 msec, average = 25 scans, and boxcar = 10), and extinction maximum wavelengths (λmax) were determined from the zero-point crossing of the first derivative. SERS spectra were collected simultaneous to the LSPR measurements at a 90° angle from the UV–vis light sources. SERS measurements were performed using 6 nM Ag@Au@SiO2 nanoparticle solutions prepared in 10 mM phosphate buffer (pH 7.4) and 4-aminothiophenol. Prior to SERS measurements, samples were mixed and incubated for at least 1 h. SERS data were collected using a BW Tek iRaman spectrometer with an excitation wavelength (λex) of 785 nm. Blank spectra were collected using cuvettes containing everything but analyte. All SERS spectra shown represent sample data minus these blank spectra.
3. Results and discussion
3.1. Evaluating the optical and dielectric properties of Ag@Au and Ag@Au@SiO2 nanoparticles
Improvements in the direct SERS detection of target molecules using various silver or gold nanoparticles is well-established in the literature [36–45], and plasmonic solution-phase nanomaterials are widely used as SERS substrates because of their tunable LSPR and inherent structural properties (i.e., radius of curvature, shape and size tunability, etc) [25, 46, 47]. Ag@Au nanoparticles are selected as SERS substrates given their increased SERS activity relative to Au nanoparticles, greater dielectric sensitivity versus Au nanoparticles (vide infra), and superior chemical stability versus Ag nanoparticles [48]. Example TEM images of some Ag@Au solution-phase SERS substrates is shown in figure 1(a). For instance, Ag nanoparticles (diameter, d = 11.5 ± 3.2 nm) are coated in a thin Au shell (thickness = 3.5 ± 3.9 nm) to promote larger SERS intensities versus yet promote improved chemical stability in basic conditions from the Ag cores. These materials can be stabilized in silica shells to provide controlled electromagnetic coupling between nanostructures. The sample shown in figure 1(a2) represents Ag@Au@SiO2 nanoparticles (total diameter = 48.7 ± 6.8 nm, silica shell thickness = 15.1 ± 6.8 nm). These samples can be converted into internally etched Ag@Au@SiO2 nanoparticles (figure 1(a3), total diameter = 46.1 ± 6.0 nm with an average silica thickness of 13.8 ± 6.5 nm).

Figure 1. Ag@Au nanoparticles stabilized by (1) citrate, (2) silica shells, and (3) silica membranes. (a) Representative TEM images, (b) SERS spectra with the largest signal for 30 μM 4-aminothiophenol incubated with 6 nM nanoparticles, and (c) time-dependent SERS intensities. SERS parameters: λex = 785 nm, tint = 30 s, and P = 64 mW. Vibrational assignments: CC and CS stretch: 1587 cm−1, CC stretch and CH bend: 1485 cm−1, CC stretch and CH bend: 1173 cm−1, CC and CS stretch: 1079 cm−1, ring deformation: 1003 cm−1, and ethanol: 876 cm−1.
Download figure:
Standard image High-resolution imageImportantly, satisfying both the chemical and electromagnetic enhancement mechanism and their distance dependencies are critical for achieving large SERS signals [49]. For this reason, SERS is used to improve detection; however, molecules must diffuse toward the plasmonic nanostructured surface and interact at short separation distances. Surface functionalization can be used to promote selective interactions between molecules and the nanostructured surface. For instance, molecular adsorption can be promoted using specific surface chemistry, which facilitates binding and detection [23]. Silica, for instance, is a structurally versatile, biocompatible, and optically transparent protective material which can be subsequently modified with a variety of different chemical functionalities. If these layers are porous, target molecules can interact with the metal through the porous regions of this layer and be detected using SERS [2].
An example of SERS detection of 4-aminothiophenol on Ag@Au nanoparticles stabilized by (1) ions, (2) microporous silica shells, and (3) internally etched silica membranes is shown in figures 1(b) and (c). Ion stabilized nanoparticles reveal the largest SERS signals (figure 1(b1)); however, these signals vary rapidly with time. This occurs as molecules bind to the metal surface and destabilize the materials and impacts the LSPR and SERS spectral properties (figure 1(c1)). In contrast, silica shell-stabilized Ag@Au nanoparticles (figures 1(a)/(b)/(c2)) are stable yet exhibit no SERS activity because the analytes do not interact with the large electric fields near the metal surface [2, 49]. Finally, silica membrane stabilized Ag@Au nanoparticles (figures 1(a)/(b)/(c3)) exhibit time dependent SERS signals, which are smaller than those observed with ion stabilized nanoparticles because the silica membranes prevent the formation of hot-spots between nanostructures, but the signals stabilize with time once the nanoparticle surfaces are saturated by molecules [1].
While membrane-stabilized nanoparticles result in predictable SERS signals as a function of time once surface saturation occurs, silica membrane formation depends on silica cross-linking and density [4]. Conditions such as pH, temperature, storage conditions, and storage time impact the formation of the silica membranes, which are important requirements for SERS [1, 4]. As previously reported for silica membrane stabilized Au nanoparticles, considerations of synthesis and storage parameters are important to achieve silica coated nanoparticles with similar silica cross-linking. Although attempts are made to achieve consistent silica with uniform refractive indices, some variations in silica cross-linking can still exist because of the amorphous nature of the silica shell.
As a result, the optical properties of the Ag@Au nanoparticle cores can be used to characterize the dielectric properties of the silica shells and membranes. To do this, well-established dielectric models can be utilized [4, 50, 51] using the LSPR properties of these materials. First, LSPR spectra are collected for Ag@Au and Ag@Au@SiO2 nanoparticle samples are collected in water and varying bulk refractive index. Example LSPR spectra for these two samples are shown in figure 2(a). As expected, the presence of the silica shell induces a 14 nm red shift in the extinction maximum wavelength (λmax) upon shell formation.

Figure 2. Evaluation of the dielectric properties of silica shells on Ag@Au nanoparticles. (a) LSPR spectra of (1) Ag@Au (λmax = 539 nm) and (2) Ag@Au@SiO2 (λmax = 553 nm, silica shell thickness = 15.1 ± 6.8 nm) nanoparticles in water. (b) Shifts in the maximum LSPR wavelength as a function of bulk refractive index. Bulk refractive index was varied using 0–80% (w/v) sucrose solutions. Linear and nonlinear refractive index sensitivities are 170 and 360 nm/RIU for the Ag@Au nanoparticles. The intersection point of the two curves represents the effective refractive index on Ag@Au@SiO2 nanoparticles. Furthermore, the LSPR decay length (ld) is calculated to be ∼11 nm according to the model. Error bars represent standard deviations from a minimum of three measurements.
Download figure:
Standard image High-resolution imageThese samples can be rinsed and redispersed in solvents with known bulk refractive indices. This is shown in figure 2(b). To achieve varying bulk refractive indices, sucrose solutions varying from 0 to 85% (w/v) and 2 nM nanoparticle solutions are used. After a 30 min incubation period, an increase in bulk refractive index causes the extinction maximum wavelengths for both samples to red shift. Equation (1), which describes the LSPR wavelength shift response (Δλmax), can be used to describe these data as follows:

where m1 and m2 are the linear and nonlinear refractive index sensitivity terms that account for linear and nonlinear changes in the local electric fields near the Ag@Au nanoparticle surfaces, neff is the effective local refractive index, and nwater is the refractive index of the water 1.333.
Both qualitative and quantitative differences are observed between LSPR spectra collected at various sucrose concentrations. For instance, figure 2(b) shows that increasing bulk refractive index from 1.33 to 1.475 of ion stabilized Ag@Au and Ag@Au@SiO2 nanoparticles (silica shell thickness = 15.1 ± 6.8 nm) red-shifts the maximum LSPR wavelengths nonlinearly relative to initial λmax of Ag@Au nanoparticles in water. From these data, the refractive index sensitivity is easily estimated using equation (1). Second, the linear and nonlinear refractive index sensitivities for Ag@Au nanoparticles are estimated as 170 and 360 nm/RIU, respectively. Third, the effective refractive index of the local condensed silica (including voids) around Ag@Au nanoparticles can be estimated using the intersection of the refractive index sensitivity responses as shown in figure 2(b). As such, the silica refractive index is found to be 1.458, a value that is consistent with silica condensed on Au nanoparticles synthesized using a similar synthetic protocol [4]. Finally, the characteristic LSPR decay length (ld) [51] for Ag@Au nanoparticles can be estimated as follows [4, 50]:
where a is the silica shell thickness, nsilica is the refractive index of silica, and nwater is the refractive index of water. As such, the LSPR decay length is estimated at ∼11 nm and can be subsequently used to quantify the dielectric characteristics of the silica membrane on Ag@Au@SiO2 nanoparticles.
In addition, the effective refractive index (neff) of the silica-containing layer surrounding Ag@Au@SiO2 nanoparticles can be estimated so that the LSPR properties of the metal cores can be correlated to effective silica density. First, 3 nM silica shell stabilized Ag@Au nanoparticles are immersed in 1.5 M NH4OH for varying periods of time to induce membrane formation. The reaction is quenched by the addition of acid, and the samples are rinsed and redispersed in water. Example TEM images and LSPR spectra for three internally etched Ag@Au@SiO2 nanoparticle samples are shown in figures 3(a) and (b), respectively. As expected, membrane formation is visible from varying silica contrast near the metal surfaces in the TEM images and results in systematic blue-shifts in the LSPR spectra.

Figure 3. Determination of local effective refractive index for membrane stabilized Ag@Au@SiO2 nanoparticles. (a) TEM images and (b) LSPR spectra of Ag@Au@SiO2 nanoparticles after (1) 10 (λmax = 551.9 nm, Δλmax = −1.1 nm), (2) 30 (λmax = 547.9 nm, Δλmax = −5.1 nm), and (3) 40 (λmax = 541.9 nm, Δλmax = −11.1 nm) minutes. (c) LSPR wavelength maximum shifts as a function of effective refractive index of silica membrane stabilized nanoparticles. The effective refractive index is estimated using the previously determined dielectric properties of the materials.
Download figure:
Standard image High-resolution imageNext, equation (3) can be used to relate nanoparticle morphology to the optical properties of the internally etched Ag@Au@SiO2 nanoparticles. The relationship between neff and the void near the surface of the metal nanoparticles is related as follows:
where nvoid is the refractive index of the void volumes in the silica shell, V is the void thickness, and S is the silica membrane thickness (i.e., total silica shell thickness—void thickness). The observed LSPR wavelength shift data in figure 3(b) are then related to effective refractive index around the Ag@Au cores. This result is shown in figure 3(c). As expected, shifts in the λmax increase in magnitude as etching progresses and voids around the nanoparticle cores form. As the effective refractive index decreases from 1.458 (silica) to 1.333 (water), an 18 nm blue-shift is clearly observed for internally etched Ag@Au@SiO2 nanoparticles. By combining these straight-forward LSPR measurements, TEM images, and dielectric model, the effective refractive index for the porous silica in figures 3(a1)–(a3) are estimated at 1.448, 1.408, and 1.362, respectively. The impact of the effective refractive index and as a result, effective silica density are expected to impact the diffusion of molecules near the metal nanoparticle core [1], which should influence the size of the SERS-active volume near the metal surface and as a consequence, the magnitude of the SERS signal of small molecules (vide infra).
3.2. SERS signals as a function of effective refractive index
SERS signals arise from molecules occupying the volume nearest to the metal substrate [25] and is often approximated in terms of distance dependence [3]. For internally etched Ag@Au@SiO2 nanoparticles, the silica membrane and interior void is the matter that occupies the SERS-active volume and facilitates molecular diffusion through the silica shells for SERS detection. As such, SERS intensities are expected to increase as the effective refractive index decreases. To evaluate this hypothesis, nine internally etched Ag@Au@SiO2 nanoparticle samples are prepared so that the effective refractive index varies from 1.36 to 1.46. The nanoparticle samples are diluted to final concentrations of 6 nM and incubated with 30 μM 4-aminothiophenol for at least 1 h. SERS signals were collected, and the CS/CC stretching frequency centered at 1079 cm−1 is plotted as a function of effective refractive index. These data are summarized in figure 4 and reveal that SERS intensity increases with decreasing effective refractive index (i.e., increasing void volume). As the effective refractive index decreases from 1.458 to 1.333 nm, Si–O–Si bonds in the polymer matrix are broken thereby generating silica voids near the metal surface, which can then be occupied by molecules or solvent. Of note, decreasing the effective refractive index from 1.44 to 1.38 shows significant changes in SERS intensities. As more molecules occupy the internal silica volume, SERS signals increase. Above an effective refractive index of 1.48, insufficient internal volume is available thereby hindering molecular diffusion and as a result, reduces SERS intensities. When the effective local refractive index is less than 1.38, SERS intensities saturate and are limited by monolayer formation of 4-aminothiophenol on the Ag@Au nanoparticle surfaces. Because small changes in effective refractive index near the metal core impact SERS intensities, these data suggest that SERS signals are reproducible if effective refractive index of the local environment of the local SERS-active volume surrounding the SERS substrate is considered.

Figure 4. SERS signals for 6 nM silica membrane stabilized Ag@Au nanoparticles incubated with 30 μM 4-aminothiophenol for at least 1 h. Effective refractive index was varied from 1.366 to 1.458 and SERS intensity was plotted using the 1079 cm−1 CS CC stretching frequency. At lower effective refractive indices, SERS intensities are limited by saturation of the metal surface area and volume near the metal surface whereas at high effective refractive indices, the volume near the metal surface is blocked by silica thereby reducing the overall SERS intensity. Averages and standard deviations are reported using at least three measurements. Same SERS parameters as in figure 1.
Download figure:
Standard image High-resolution image3.3. SERS signal dependencies on nanoparticle and molecule concentrations
If SERS signals from analytes depend on the silica-free surface area and volume near the Ag@Au nanoparticles, SERS signals should vary as a function of analyte to molecule concentration. To understand how molecular concentration impacts SERS signals, 6 nM internally etched Ag@Au@SiO2 nanoparticles were incubated with 4-aminothiophenol concentrations ranging from 1 to 30 μM for at least 1 h in 10 mM phosphate buffer (pH 7.4). The effective refractive index is maintained at 1.38 to ensure consistent internal void volumes. Representative SERS spectra are shown in figure 5(a) and reveal that the unique molecular vibrational modes for 4-aminothiophenol centered at 1173 cm−1 (CH bend, CC stretch), 1079 cm−1 (CC and CS stretches), and 393 cm−1 (CS bend) [52–55] are consistent with the a1 vibrational modes for 4-aminothiophenol and the formation of a monolayer of 4-aminothiophenol on the metal surface.
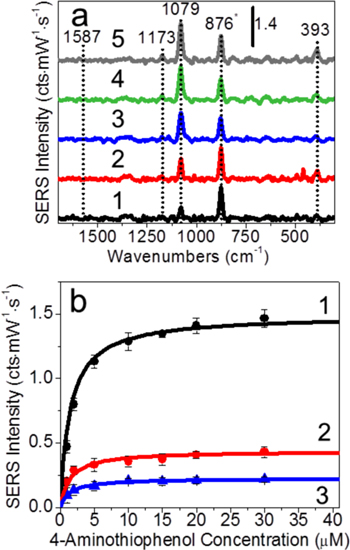
Figure 5. SERS data for 6 nM IE Ag@Au@SiO2 nanoparticles with effective silica refractive index of 1.38 as a function of molecular concentration. (a) Maximum SERS spectra for (1) 1, (2) 2, (3) 5, (4) 20, and (5) 30 μM 4-aminothiophenol and (b) SERS intensity for the vibrational modes centered at (1) 1079 cm−1 (CC and CS stretches), (2) 393 cm−1 (CS bend), and (3) 1173 cm−1 (CC stretch and CH bend) as a function of 4-aminothiophenol concentration. Averages and standard deviations are reported using at least three measurements. Same SERS parameters as in figure 1.
Download figure:
Standard image High-resolution imageThe largest SERS intensity in each spectrum is observed for the CC/CS stretching transitions, which is consistent with molecules attached to the metal surface through sulfur atom and enhanced by the strong electromagnetic fields near the metal surface [52–54]. Of note, only a1 symmetric vibrational modes are observed for 4-aminothiophenol, which suggests that the molecules are oriented on the metal surface as a loosely packed monolayer with an average tilt angle of ∼30° [56, 57].
Previously, silica membranes were shown to prevent plasmon coupling between gold nanoparticle cores [1, 2, 4], and similar observations are observed here for internally etched Ag@Au@SiO2 nanoparticles. Thus, SERS signal changes are a consequence of local 4-aminothiophenol concentration inside the silica membrane and are expected to provide quantitative molecular detection. Because SERS signals are directly proportional to the number of molecules within the localized SERS-active volume near the metal surface, saturated SERS signals should be limited by 4-aminothiophenol monolayer formation. To evaluate these trends, SERS intensities for CC stretch/CH bend, CS/CC stretch, and CS bend modes are plotted as a function of 4-aminothiophenol concentration and 6 nM internally etched Ag@Au@SiO2 nanoparticles with an effective refractive index of 1.38 (1 + hour incubation).
As shown in figure 5(b), the SERS intensities for each vibrational frequency systematically increase then saturate after the addition of ∼20 μM 4-aminothiophenol. First, the CC/CS stretching and CC stretching/CH bending modes, which are orientation independent, represent SERS signals from all molecules that occupy SERS-active volume inside each silica membrane. Second, the CS bending mode centered at 393 cm−1 is consistent with molecules bound to the metal surface [58–60]. Finally, because of the absence of b2 vibrational modes, 4-aminothiophenol signals are limited to molecules inside the silica shells in the absence of strong electric fields induced by hot-spots [55, 61], and the effective molecular footprint of molecules are estimated at 0.535 nm2/molecule [57]. As such, a monolayer of 4-aminothiophenol would be achieved if ~2000 molecules/nanoparticle were added to solution (assuming an average Ag@Au nanoparticle diameter = 18.5 nm). For a 6 nM nanoparticle solution, this equates to a 12 μM 4-aminothiophenol concentration. As a result, any molecular concentration below 12 μM should provide a concentration dependent response while concentrations above this value should be concentration independent. This is observed in figure 5(b). These results demonstrate that quantitative and reproducible SERS detection is possible once the effective refractive index surrounding internally etched Ag@Au@SiO2 nanoparticles as well as metal surface area are considered.
Finally, SERS signals are evaluated as a function of internally etched Ag@Au nanoparticle concentration. The concentration of internally etched silica coated Ag@Au nanoparticles with an effective refractive index of 1.38 were varied from 0 to 10 nM and incubated with 30 μM 4-aminothiophenol for at least 1 h to ensure that a molecular excess was added to solution. Representative SERS spectra are shown in figure 6(a) and show a systematic increase in SERS intensity with increasing nanoparticle concentration. The SERS intensity for the CS\CC stretch at 1079 cm−1 is plotted as a function of internally etched Ag@Au@SiO2 nanoparticle concentration and increases linearly over the concentration range studied (figure 6(b)). Above this concentration, signals and background vary significantly from measurement to measurement and are attributed to detector limitations and/or light throughput. This suggests that nanoparticle concentration directly impacts SERS signals, and can be used to lower detection limits as well as to expand the dynamic range for quantitative SERS detection of small molecules.

Figure 6. Nanoparticle concentration dependent (a) SERS spectra and (b) intensities for 30 μM 4-aminothiophenol. Nanoparticle concentration was varied from (1) 2, (2) 4, (3) 6, (4) 8, and (5) 10 nM 4-aminothiophenol. The samples were spiked with 1% ethanol, and the ethanol signal at 876 cm−1 was used to account for sample to sample focus variations. Vibrational assignments: CC and CS stretch: 1587 cm−1, CC stretch and CH bending: 1173 cm−1, CC and CS stretches: 1079 cm−1, ethanol: 876 cm−1, and CS bending: 393 cm−1. Averages and standard deviations are reported using at least three measurements. Same SERS parameters as in figure 1.
Download figure:
Standard image High-resolution image
4. Conclusions
In summary, the optical properties of Ag@Au nanoparticles were estimated using a semi-empirical approach to estimate the refractive index sensitivity and characteristic electromagnetic field decay length of Ag@Au nanoparticles as well as the dielectric properties of the silica membrane. Using the local effective refractive index surrounding the Ag@Au nanoparticles, internally etched Ag@Au@SiO2 nanoparticles were synthesized and used as SERS substrates. Several trends were observed. First, by maintaining nanoparticle morphology (including silica thickness and effective refractive index), systematic changes in SERS signals were observed and attributed to silica-limited SERS-active volumes near the metal core. Second, when low molecule concentrations were added to internally etched Ag@Au@SiO2 nanoparticles, SERS signals were limited by the number of molecules on the metal surface, and SERS signals saturated when a monolayer of 4-aminothiophenol formed. Finally, when an excess of 4-aminothiophenol was added relative to the SERS-active volume/surface area, SERS signals depended on the nanoparticle concentration. All in all, these findings show that using dielectric modeling to gain insight into effective refractive index around internally etched Ag@Au@SiO2 nanoparticles is important for quantitative and reproducible SERS. Future studies could be carried out to use these materials for quantitative SERS detection with tunable linear dynamic ranges and detection limits.
Acknowledgments
We thank the National Science Foundation (CHE-1150135) for financial support. The manuscript was written through contributions of all authors. All authors have given approval to the final version of the manuscript.