

Abstract
As the global population increases and the climate changes, ensuring a secure food supply is increasingly important. One strategy is irrigation, which allows for crops to be grown outside their optimal climate growing regions and which buffers against climate variability. Although irrigation is a positive climate adaptation mechanism for agriculture, it has a potentially negative effect on water resources as it can lead to groundwater depletion and diminished surface water supplies. This study quantifies how crop yields are affected by climate variability and extremes and the impact of irrigation on crop yield increases under various growing-season climate conditions. To do this, we use historical climate data and county-level rainfed and irrigated crop yields for maize, soybean, winter and spring wheat over the US to analyze the relationship between climate, crop yields, and irrigation. We find that there are optimal climates, specific to each crop, where irrigation provides a benefit and other conditions where irrigation proves to have marginal, if any, benefits. Furthermore, the relationship between crop yields and climate has changed over the last decades, with a changing sensitivity in the relationship of soybean and winter wheat yields to certain climate variables, like crop reference evapotranspiration. These two conclusions have important implications for agricultural and water resource system planning, as it implies there are more optimal climate conditions where irrigation is particularly productive and regions where irrigation should be reconsidered as there is not a significant agricultural benefit and the water could be used more productively.
Export citation and abstract BibTeX RIS
1. Introduction
In the coming decades, a growing population may push the agricultural sector to continue to increase production. Under the pressure of feeding 9 billion people by 2050, scientists and engineers are focusing on increasing the potential yield and decreasing the yield gap by developing a robust structure and interactions of genetics, environment and management (Hatfield and Walthall 2015). Within this context, climate variability may impact crop yields, through changes in mean climate or its inter-annual and intra-annual variability (Rowhani et al 2011) as well as through climate extremes, such as drought and floods (Lesk et al 2016, Klomp and Hoogezand 2018). One of the ways agriculture buffers against climate is through irrigation, which has potentially negative effects on water resources. Therefore, understanding the benefits of irrigation in terms of crop yield increases is a crucial piece of the puzzle in understanding the climate-water-food nexus.
Average growing season air temperatures have increased for nearly all major growing regions of maize, wheat, soybean and rice (Lobell and Field 2007, Ortiz et al 2008, Lobell et al 2011a), leading to decreasing crop yields of some commodity crops (Anwar et al 2007, Challinor et al 2014). For example, from 1980–2008 in most of the cropping regions and growing seasons except the US, the air temperature trend exceeded one standard deviation of historical records, and the median estimated decrease in global maize and wheat production is 3.8% and 5.5% under the global impacts of air temperature and precipitation trends (Lobell et al 2011a). Changes in climate variability could reduce productivity in regions that currently have optimal air temperatures, although it may be beneficial for some (Luo et al 2003, Ortiz et al 2008). Although precipitation does not have consistent trends across most growing regions like the positive trend of air temperature, (Lobell et al 2014) showed that there is increasing sensitivity for some crops, such as maize, to drought. On the other hand, crop production may decrease with excess precipitation due to waterlogging and pest disasters (Rosenzweig et al 2001), while greater precipitation can alleviate the loss from extreme high air temperature (Schlenker and Roberts 2009). To predict the future impact of climate on crop yields, crop growth simulation models have been used (Aggarwal et al 2006). Based on crop model results, losses of maize and spring wheat yields are predicted to double by the 2080s due to increases in heat stress (Deryng et al 2014). Changes and extremes of Climate variability were found to increase the disparities in cereal production between developed and developing countries (Rosenzweig and Parry 1994).
As a climate adaptation tool, irrigation stabilizes crop production under climate variability (Warrick and Gardner 1983, Leng 2017b). Irrigated agriculture produces a significant portion to global grain yield: irrigated lands comprise 17% of total cropped land, yet provide 40% of global cereals (Kuylenstierna et al 1998, Doll and Siebert 2002, Rosengrant et al 2002, Molden et al 2010, Siebert and Doll 2010). In arid and semi-arid areas, irrigation increases crop yields and stabilizes food production and prices (Rosegrant and Cline 2003, Hanjra et al 2009a, 2009b, Tack et al 2017). In humid regions, irrigated crop yields can surpass rainfed crop yields, possibly because of sub-seasonal variability in precipitation (Grassini et al 2009, Bockhold et al 2011). Irrigation buffers the impacts of many climate extremes by either decoupling irrigated crop yields from climate or shifting the threshold beyond which crop yields decline (Grassini et al 2009, Troy et al 2015, Zipper et al 2016, Schauberger et al 2017).
Irrigation may help crop production meet the global demand for food, which is projected to increase by 70% compared to current demand to feed 9 billion people by 2050 (Tomlinson 2013). Crops convert water into food, and irrigation enables us to grow crops in regions we would not otherwise be able to. However, it comes at a cost to water supplies. Irrigation consistently is the largest water user: about 67% of the current global water withdrawal and 87% of the consumptive water use is by irrigation (Shiklomanov 1998). Although there are some technologies to reduce water use, such as scheduling (Bockhold et al 2011), the ratio of consumption against extraction is highest for agriculture than domestic and industrial water use (Shiklomanov and Rodda 2004). Irrigation generally increases crop yields and decouples productivity from drought (Zipper et al 2016). Quantifying the difference in how irrigated and rainfed crop yields respond to climate will lead to a better understanding of the benefits of irrigation on agricultural production. This in turn can help inform research on of the water-food nexus.
There is little research focusing on how irrigated crop production changes with climate conditions and how irrigated crop yields compare to rainfed under different climate conditions. Quantifying the increase in crop yields due to irrigation can demonstrate the benefits, or lack thereof, of consumptive agricultural water use. Furthermore, quantifying the impact of irrigation on crop yields under varying climate conditions and how the relationship between crop yields and climate conditions are varying in time can help better inform changes and extremes of climate variability impact assessments for agriculture. In this study, we pose two hypotheses. First, the increases in crop yields due to irrigation vary with climate. Second, the sensitivity of crop yield to climate variables is not stable throughout the time. To test these two hypotheses, we calculate the relationship between climate and irrigated crop yield gains using historical datasets. Specifically, the impact of growing season precipitation, air temperature, crop reference evapotranspiration, vapor pressure deficit, and growing degree days are evaluated. The goal is to understand the impact of growing-season climate conditions on rainfed and irrigated crop yields, particularly how the crop yield gains due to irrigation vary with climate. We then analyze the temporal trends in irrigated crop yield gains, particularly if the response of rainfed and irrigated crops to climate is changing as this is a measure of the vulnerability of crops to climate variability and change. This study quantifies the impacts of irrigation on crop production at a large spatial scale across four decades.
2. Data and methods
Historical observed data is used to quantify the impact of climate on the crop yield gains due to irrigation over the continental US. For the crop yield data, four crops are analyzed: winter wheat, spring wheat, soybean and maize. The USDA National Agriculture Statistics Survey's Quick Stats database (http://quickstats.nass.usda.gov/) provides average annual crop yields on a county basis for wheat, soybean, rice, and maize as well as many other crops. The USDA database contains separate estimates of irrigated and rainfed crop yields from 1970–the present at the county level, although the data only exists for a subset of US counties. Growing seasons for each crop are obtained from the Crop Calendar Dataset (Sacks et al 2010) which provides the start and end dates of growing seasons globally (figure S1). To quantify the growing season, the grid from the Crop Calendar dataset that is the closest to the center of the county is identified, and then that grid cell's planting date and harvesting date define the growing season for that county.

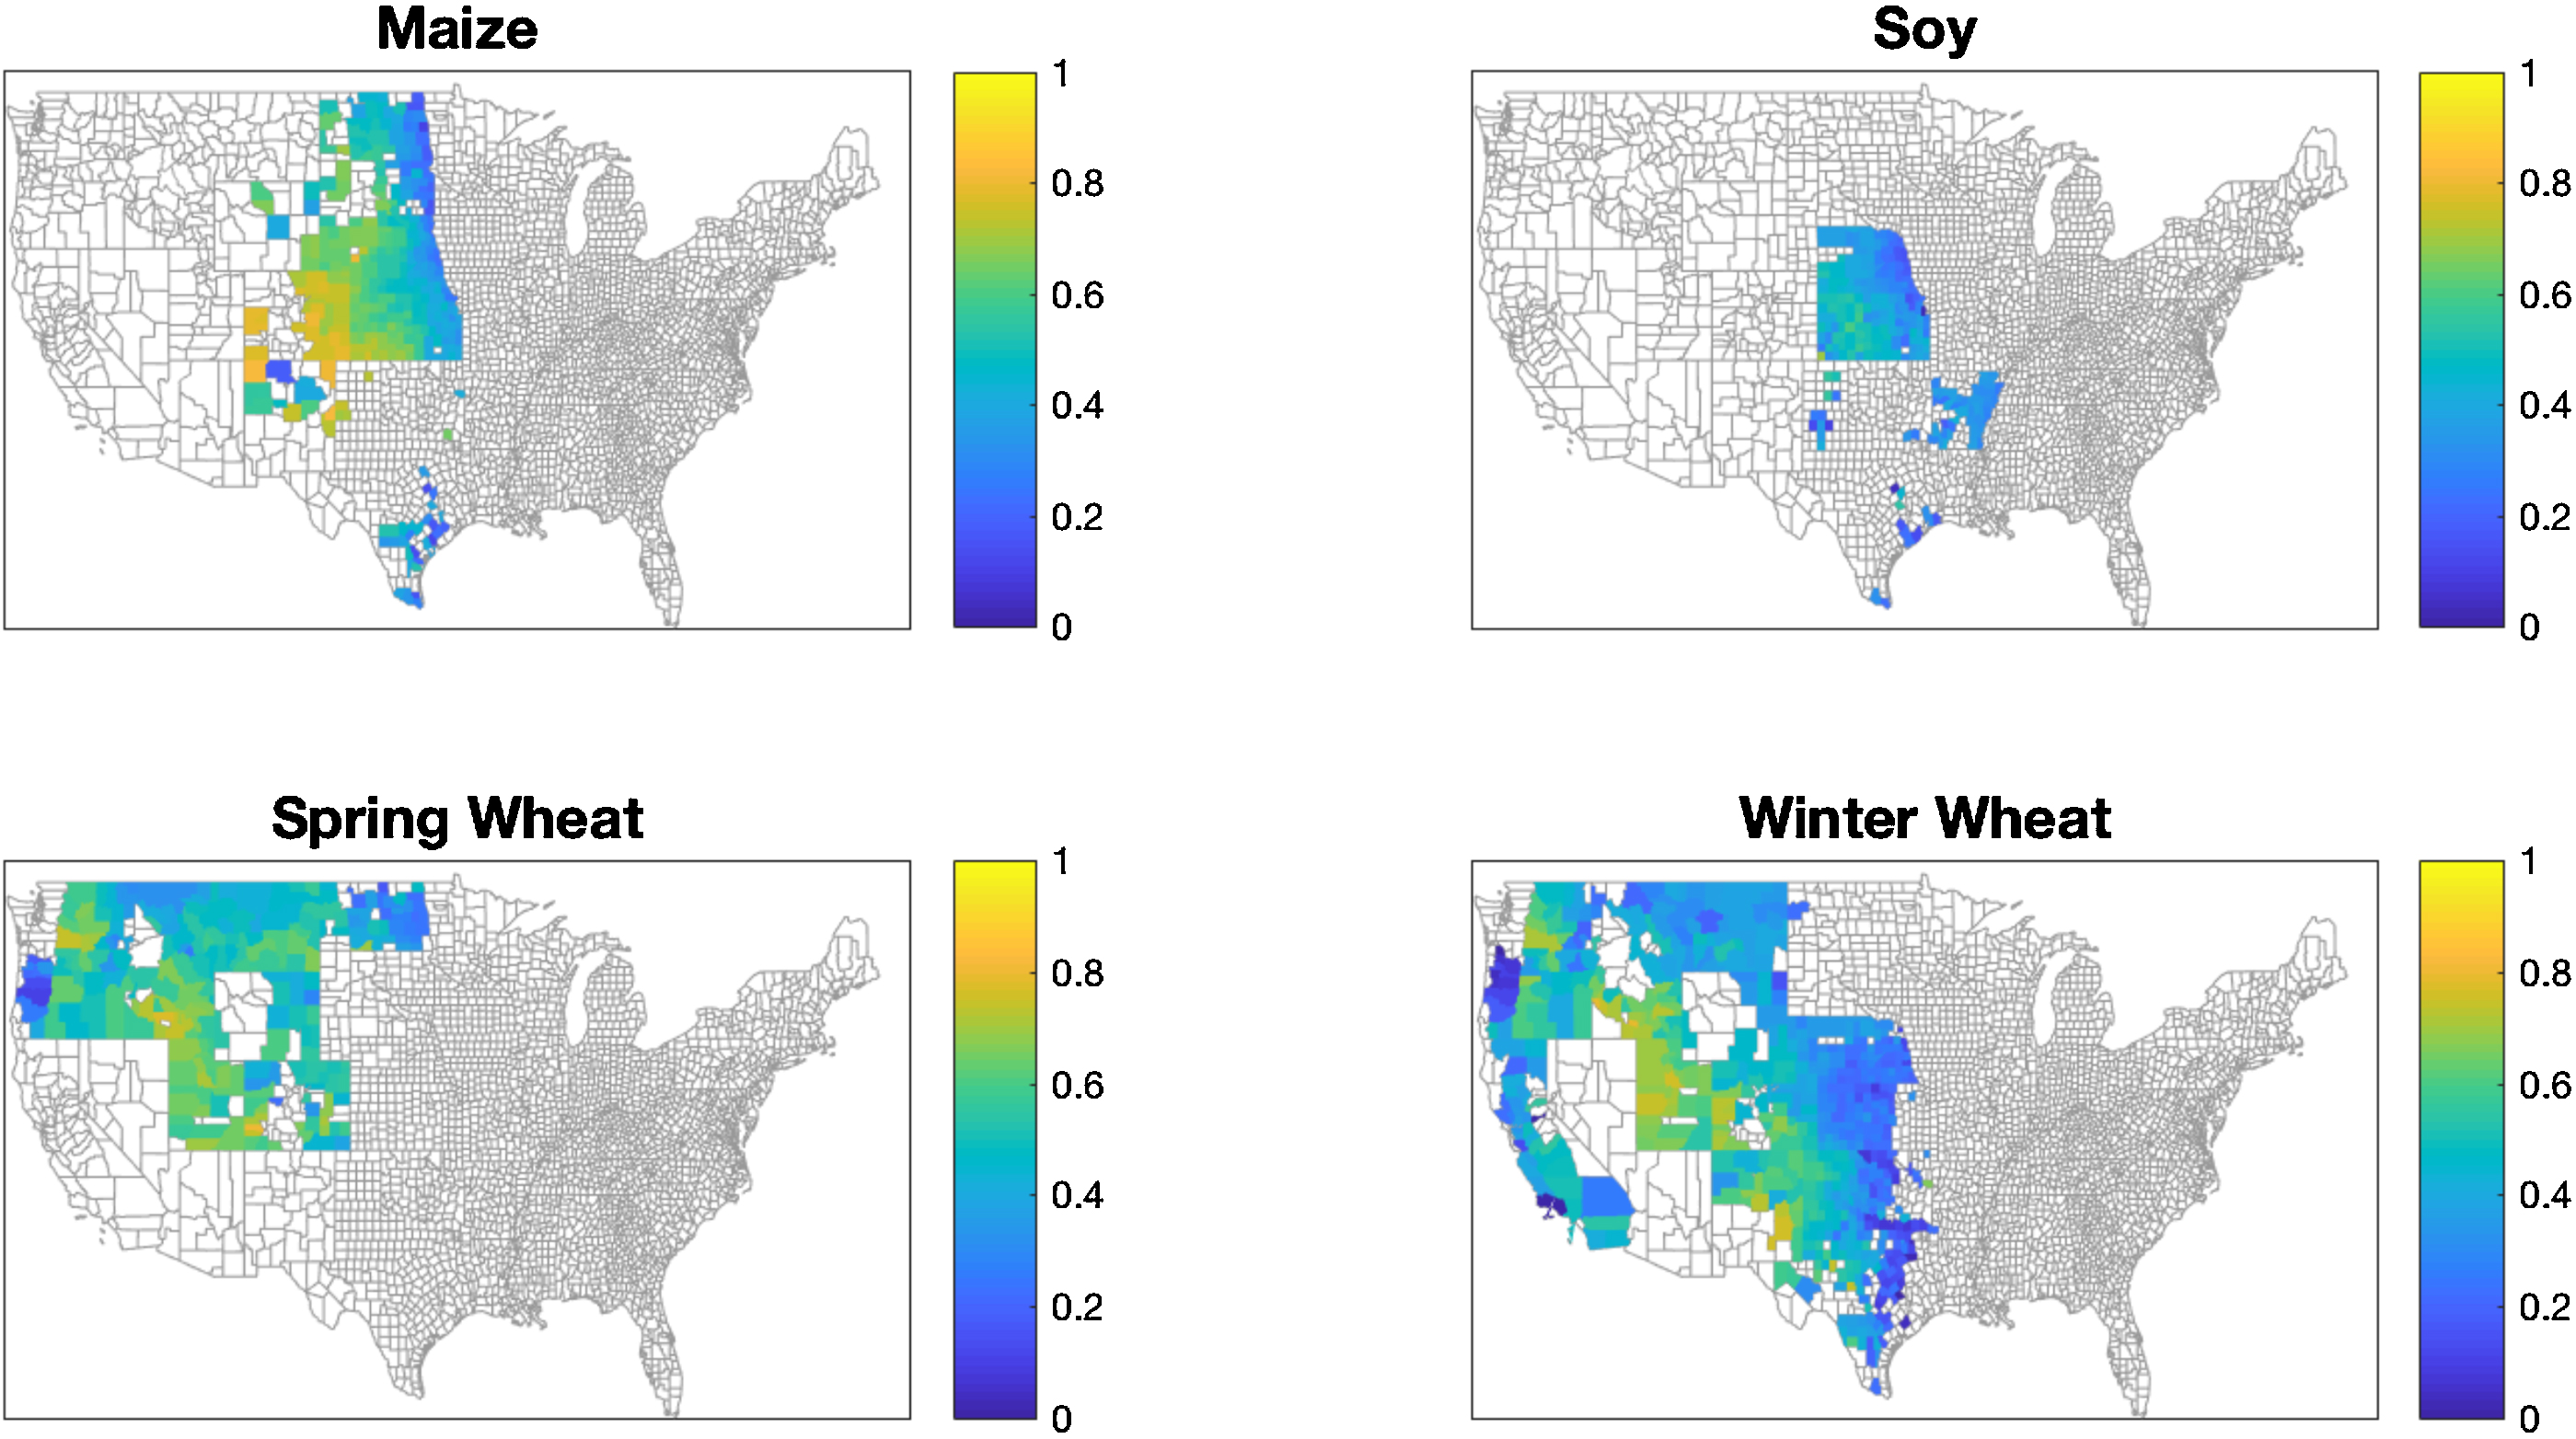
Figure 1. Mean irrigated crop yield gain (IYG, unitless) for the four crops. IYG is calculated as the difference between irrigated and rainfed crop yields, divided by the irrigated crop yield. This is calculated for each year; the long-term average IYG is plotted.
Download figure:
Standard image High-resolution imageFor the climate, a gridded dataset was used (Maurer et al 2013), which contains daily precipitation and maximum and minimum air temperature at 1/8° latitude by longitude resolution across the continental US. The dataset extends from 1949–2010; the analysis in this study is confined to 1970–2010 to match the data availability of both the climate and crop yield datasets. Because crop yields are at the county level, the Maurer dataset was interpolated from a regular latitude-longitude grid to individual counties following Devineni et al (2015). The mean growing-season climate is shown in figure S2, and the details of how the other variables—such as vapor pressure deficit (VPD), growing degree days (GDD), cumulative dry days (CDD), precipitation intensity (SDII) and antecedent soil moisture (ASM)—are calculated in the supplementary materials available at stacks.iop.org/ERL/13/064031/mmedia. We selected which of the eight variables to further analyze based on stepwise regression (results in table S1). They are precipitation (P), average air temperature (Tavg), crop reference evapotranspiration (ETref), growing degree days (GDD) and vapor pressure deficit (VPD).
To calculate the change in crop yields due to irrigation, we calculate the fractional irrigated crop yield gains (IYG) as
where Yi is the county-level irrigated crop yield [metric ton ha−1] and Yr is the county-level rainfed crop yield [metric ton ha−1]. The IYG is calculated for each county for each year, providing a standardized comparison between counties. This statistic largely removes the positive temporal trends in crop yields due to technology gains in farming, including improved seeds and management practices, as most of these technology gains occurred for both rainfed and irrigated crops. The mean IYG is show in figure 1. Only those counties that report both irrigated and rainfed crop yields are included, leading to a western bias in available data. This western bias of the study area is due to less irrigation use in humid regions (Tanner and Sinclair 1983). This is clearly seen in maize's study region: maize is extensively grown in the eastern half of the country, but it is primarily rainfed and therefore not included in the USDA data.
3. Results
To evaluate the relationship between irrigated crop yield gains (IYG) and growing-season climate conditions, the IYG is plotted against P, ETref and GDD in figure 2. Across all years and counties, the growing-season climate variable and IYG were pooled (binned) by growing-season climate (e.g. anytime a county's growing season had 200–250 mm, it is placed in that precipitation bin, and only those bins with at least 10 data points are included). The red line indicates the median value and the blue shaded areas encompass the 25th and 75th percentiles. For further information about 5th and 95th percentiles of IYG as well as the relationship with other climate variables, see figure S3. The slopes between median IYG and P, Tavg, ETref, GDD, VPD are shown in table 1.

Figure 2. The relationship between irrigated crop yield gains (IYG) and growing season precipitation (1st column), crop reference evapotranspiration (2nd column), and growing degree days (3rd column). The red solid line is the median IYG value, the blue dashed areas are the 25% and 75% IYG percentiles. Each row represents a different crop: maize (top), soybean (second), spring wheat (third) and winter wheat (bottom). Note the x-axis varies across plots.
Download figure:
Standard image High-resolution imageTable 1. The slopes between IYG and precipitation, average temperature, crop reference evapotranspiration, growing degree days and vapor pressure deficit.
| IYG/P [−/100 mm] | IYG/Tavg [−/°C] | IYG/ETref [−/−] | IYG/GDD [−/100 °C] | IYG/VPD [−/1 kPa] | |
|---|---|---|---|---|---|
| Maize | −0.06 | −0.03 | 0.03 | 0.05 | 0.34 |
| Soybean | −0.05 | 0.01 | 0.01 | 0.02 | 0.24 |
| Spring Wheat | −0.12 | 0.04 | 0.06 | 0.06 | 0.40 |
| Winter Wheat | −0.03 | −0.03 | 0.01 | 0.06 | 0.37 |
Overall, the relationship between median IYG and rainfall is negative (decreasing IYG with larger growing season rainfall); the slope of median IYG with respect to rainfall is statistically significant at the 95% level for all four crops. However, once the growing season rainfall exceeds a certain threshold for maize and soybean, the slope of IYG with rainfall is effectively flat. For maize, the median IYG decreases from 0.8 to 0.3 when rainfall increases from 180–600 mm growing−1 season; for soybean, the median IYG decreases from 0.55 to 0.25 when rainfall increases from 220–500 mm. Above 600 and 500 mm for maize and soybean, respectively, crop yield gains due to irrigation are insensitive to growing season rainfall. Spring wheat shows a climate response in IYG throughout the rainfall regime, although this may be due to having lower growing season rainfall than the other crops. Winter wheat IYG shows little sensitivity to growing season rainfall. For all crops and all rainfall conditions, there is large spread in the IYG, as shown by the spread of various percentiles (figure 2 and figure S3).

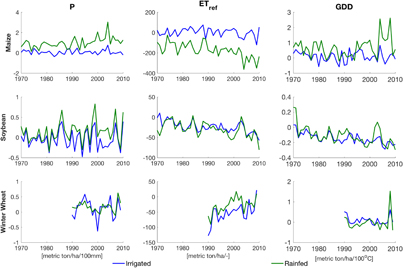
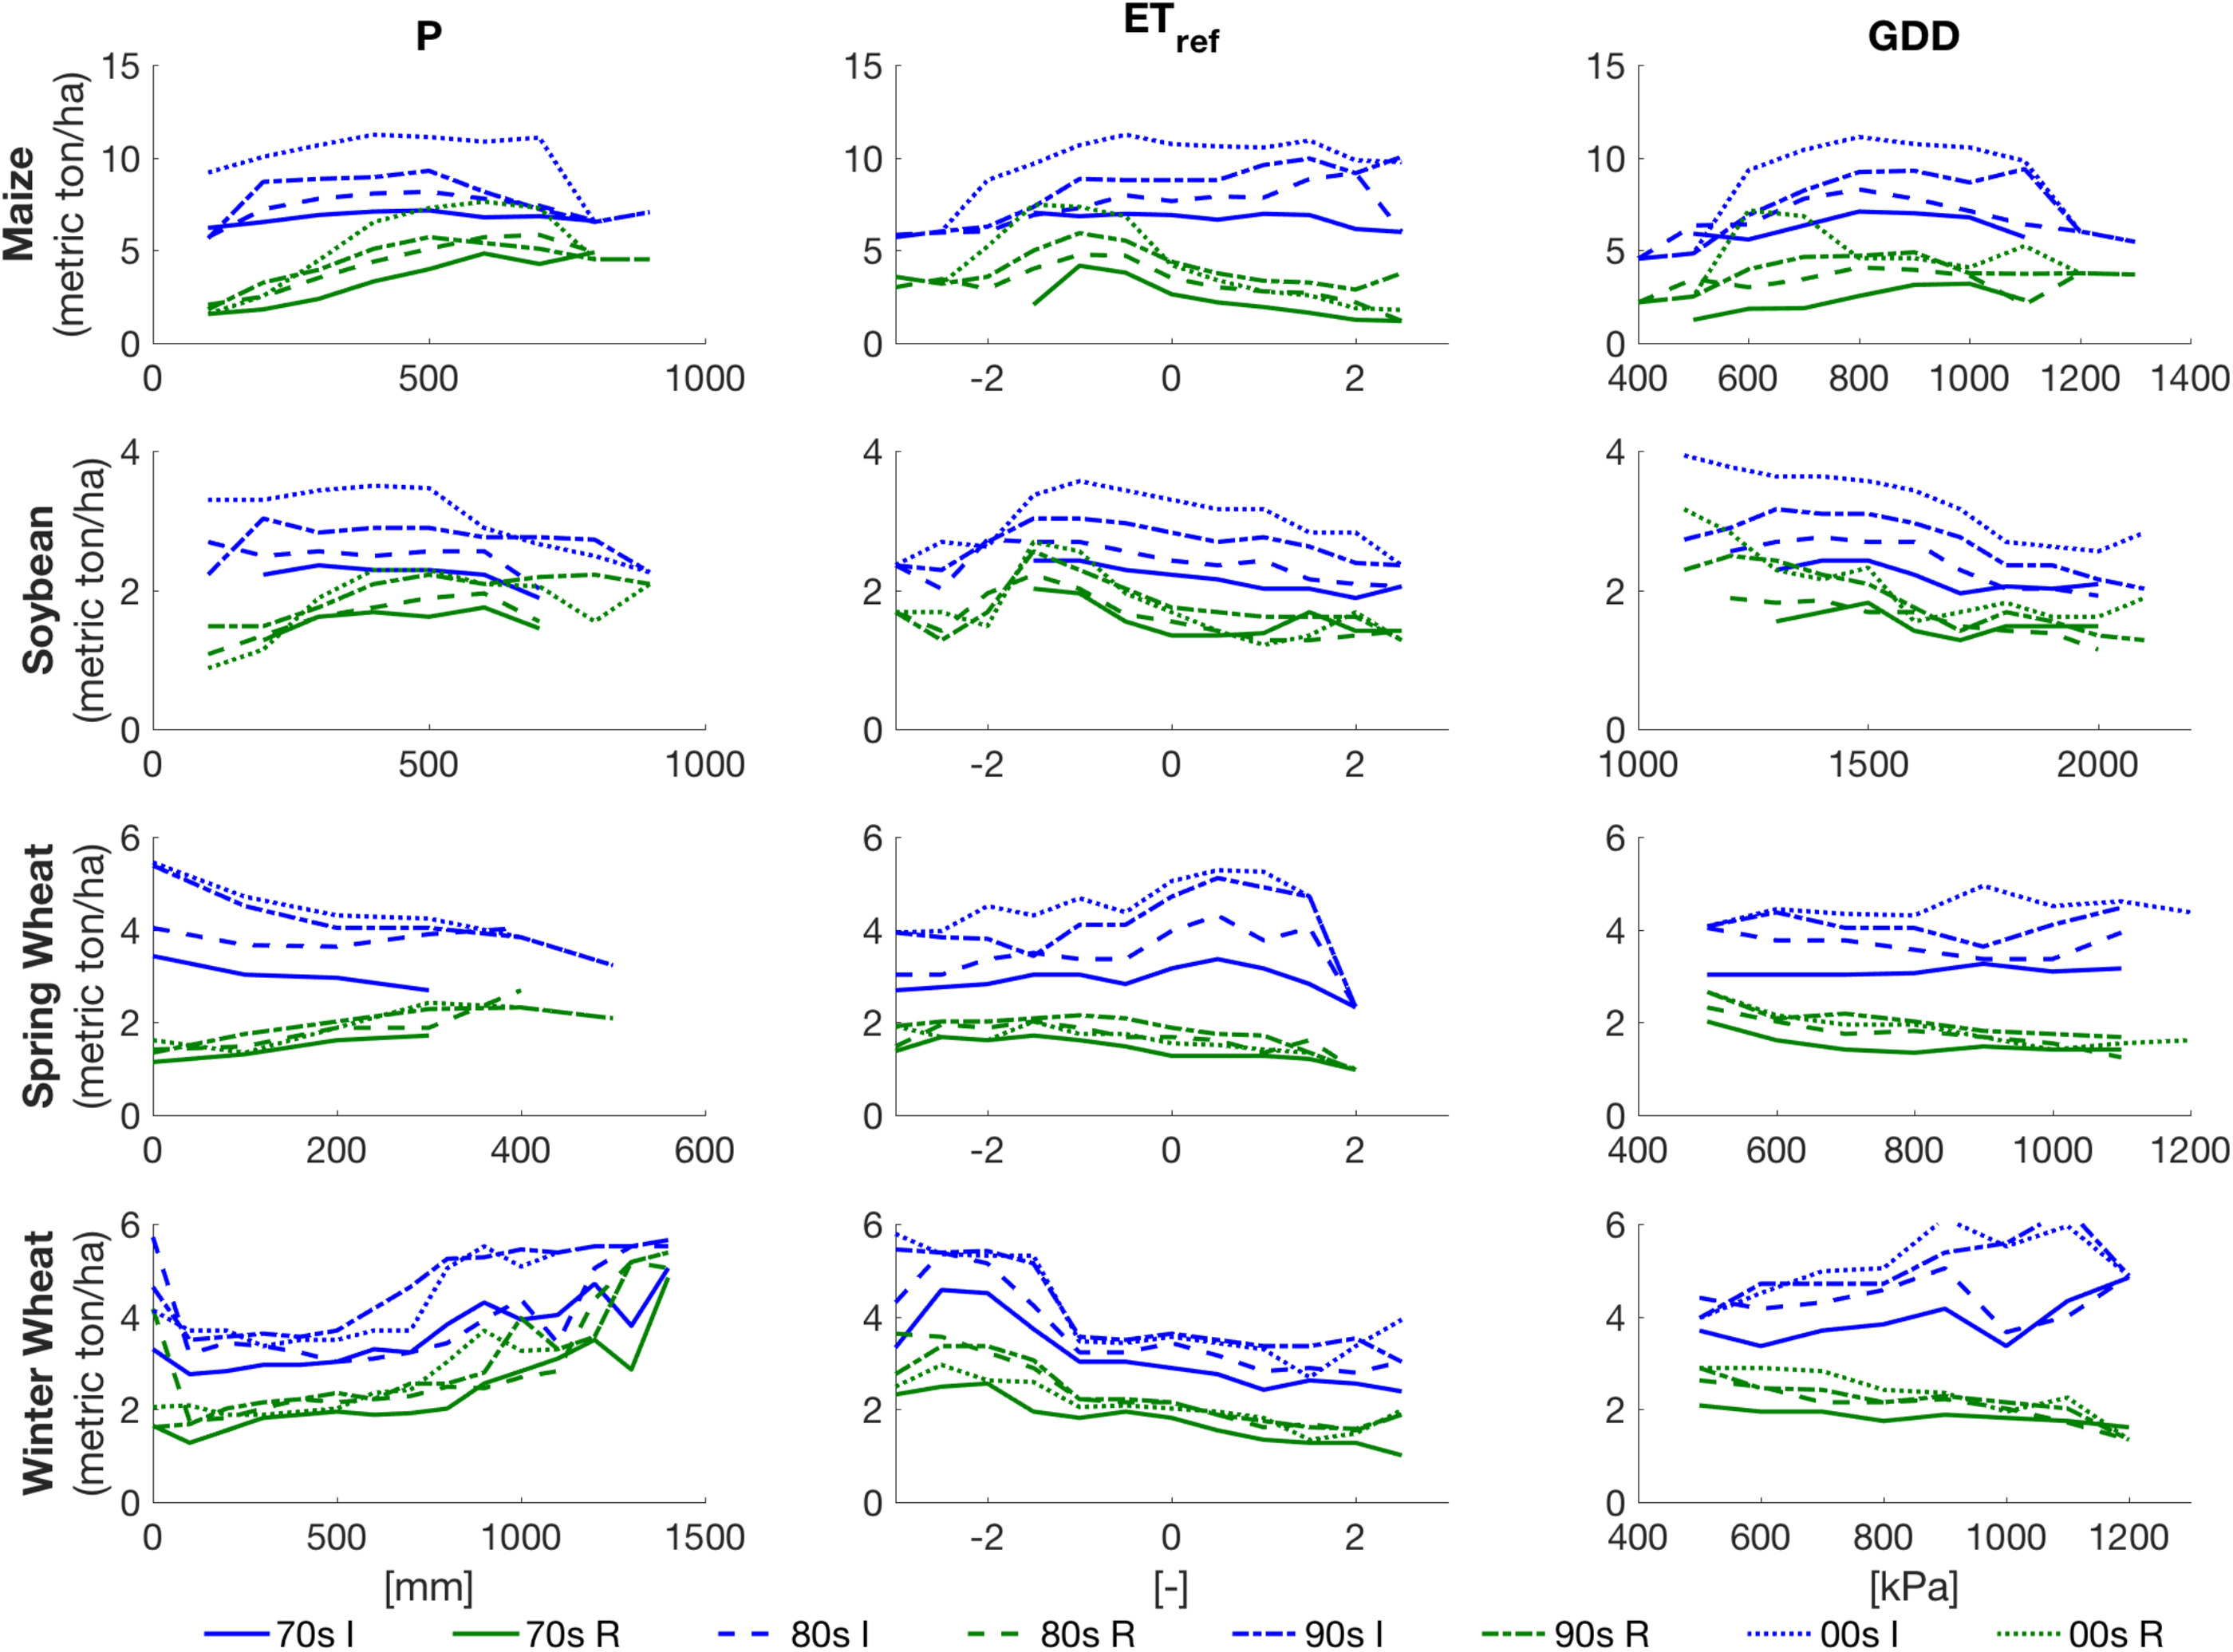
Figure 3. The impact of growing season precipitation, crop reference evapotranspiration, growing degree days, on irrigated (blue) and rainfed (green) crop yield for maize (top row), soybean (2nd row), spring wheat (3rd row) and winter wheat (4th row) from 1970–2010. The different line types represent different decades. Note the y-axis for each crop type is constant, but varies between crops. The x-axis range varies by crop.
Download figure:
Standard image High-resolution imageIn contrast to precipitation, air temperature has a less definitive impact on IYG. For maize and spring wheat, there is a modest increase in median IYG with air temperature. Soybean's median IYG increases from 0.2–0.4 as air temperature increases from 18 °C–22 °C; winter wheat is slightly decreasing. For ETref, winter wheat has a gradual increase in IYG with higher ETref. Soybean and spring wheat in particular have a large increase in IYG with ETref. Maize is the most sensitive to increases in vapor pressure deficit; winter wheat is the least sensitive but this may be a function of the growing-season climate as it is growing in areas with smaller vapor pressure deficits (figure S3). Winter wheat IYG shows the clearest response to growing degree days (GDD), whereas maize and soybean IYG have a less definitive response to GDD. Figure S4 evaluates the joint IYG response to seasonal precipitation and air temperature. In general, the pattern of IYG response as a function of precipitation and air temperature remains the same as seen in figure 2, for example, IYG becomes higher under the drier precipitation and hotter air temperature conditions. However, winter wheat is sensitive to the combination of air temperature and precipitation, with higher IYG shown in lower air temperature situations. The IYG responses are only a function of growing season conditions in a given year, rather than a function of the mean climatology (figure S7).
To quantify if the IYG-climate response is driven by irrigated or rainfed crop yields, the median response of irrigated (blue lines) and rainfed (green lines) crop yield to growing-season climate variable, P, ETref and GDD, are plotted in figure 3, and the results for VPD and Tavg are in figure S5. Because crop yields increase in time, the analysis is repeated by decade. As in figure 2, each county and year's crop yield data are pooled by growing-season climate conditions, with each bin containing at least five data points. Irrigated crop yields are always larger than rainfed yields across climate conditions, as expected. In some cases, crop yields are relatively insensitive to climate conditions, such as with spring wheat and GDD. In other cases, both rainfed and irrigated crop yields respond to climate, as is shown with winter wheat and vapor pressure deficit, where both yields decline as vapor pressure deficit increase. Figure 3 demonstrates the heterogeneity in crop yield response that drives IYG. In some cases, an increase in IYG occurs because rainfed crop yields drop, as is the case with maize and low growing season precipitation. However, declines in IYG at higher precipitation values are due to a drop in irrigated crop yields for maize. The general conclusions remain constant across decades. For maize, the decadal analysis shows that irrigated crop yield increases appear to be occurring primarily under ideal air temperature conditions, both in terms of average growing season air temperature and growing degree days. At either end of the air temperature ranges, the crop yields have not increased in time. To a lesser extent, the same is true for soybean and Tavg, VPD, and ETref.
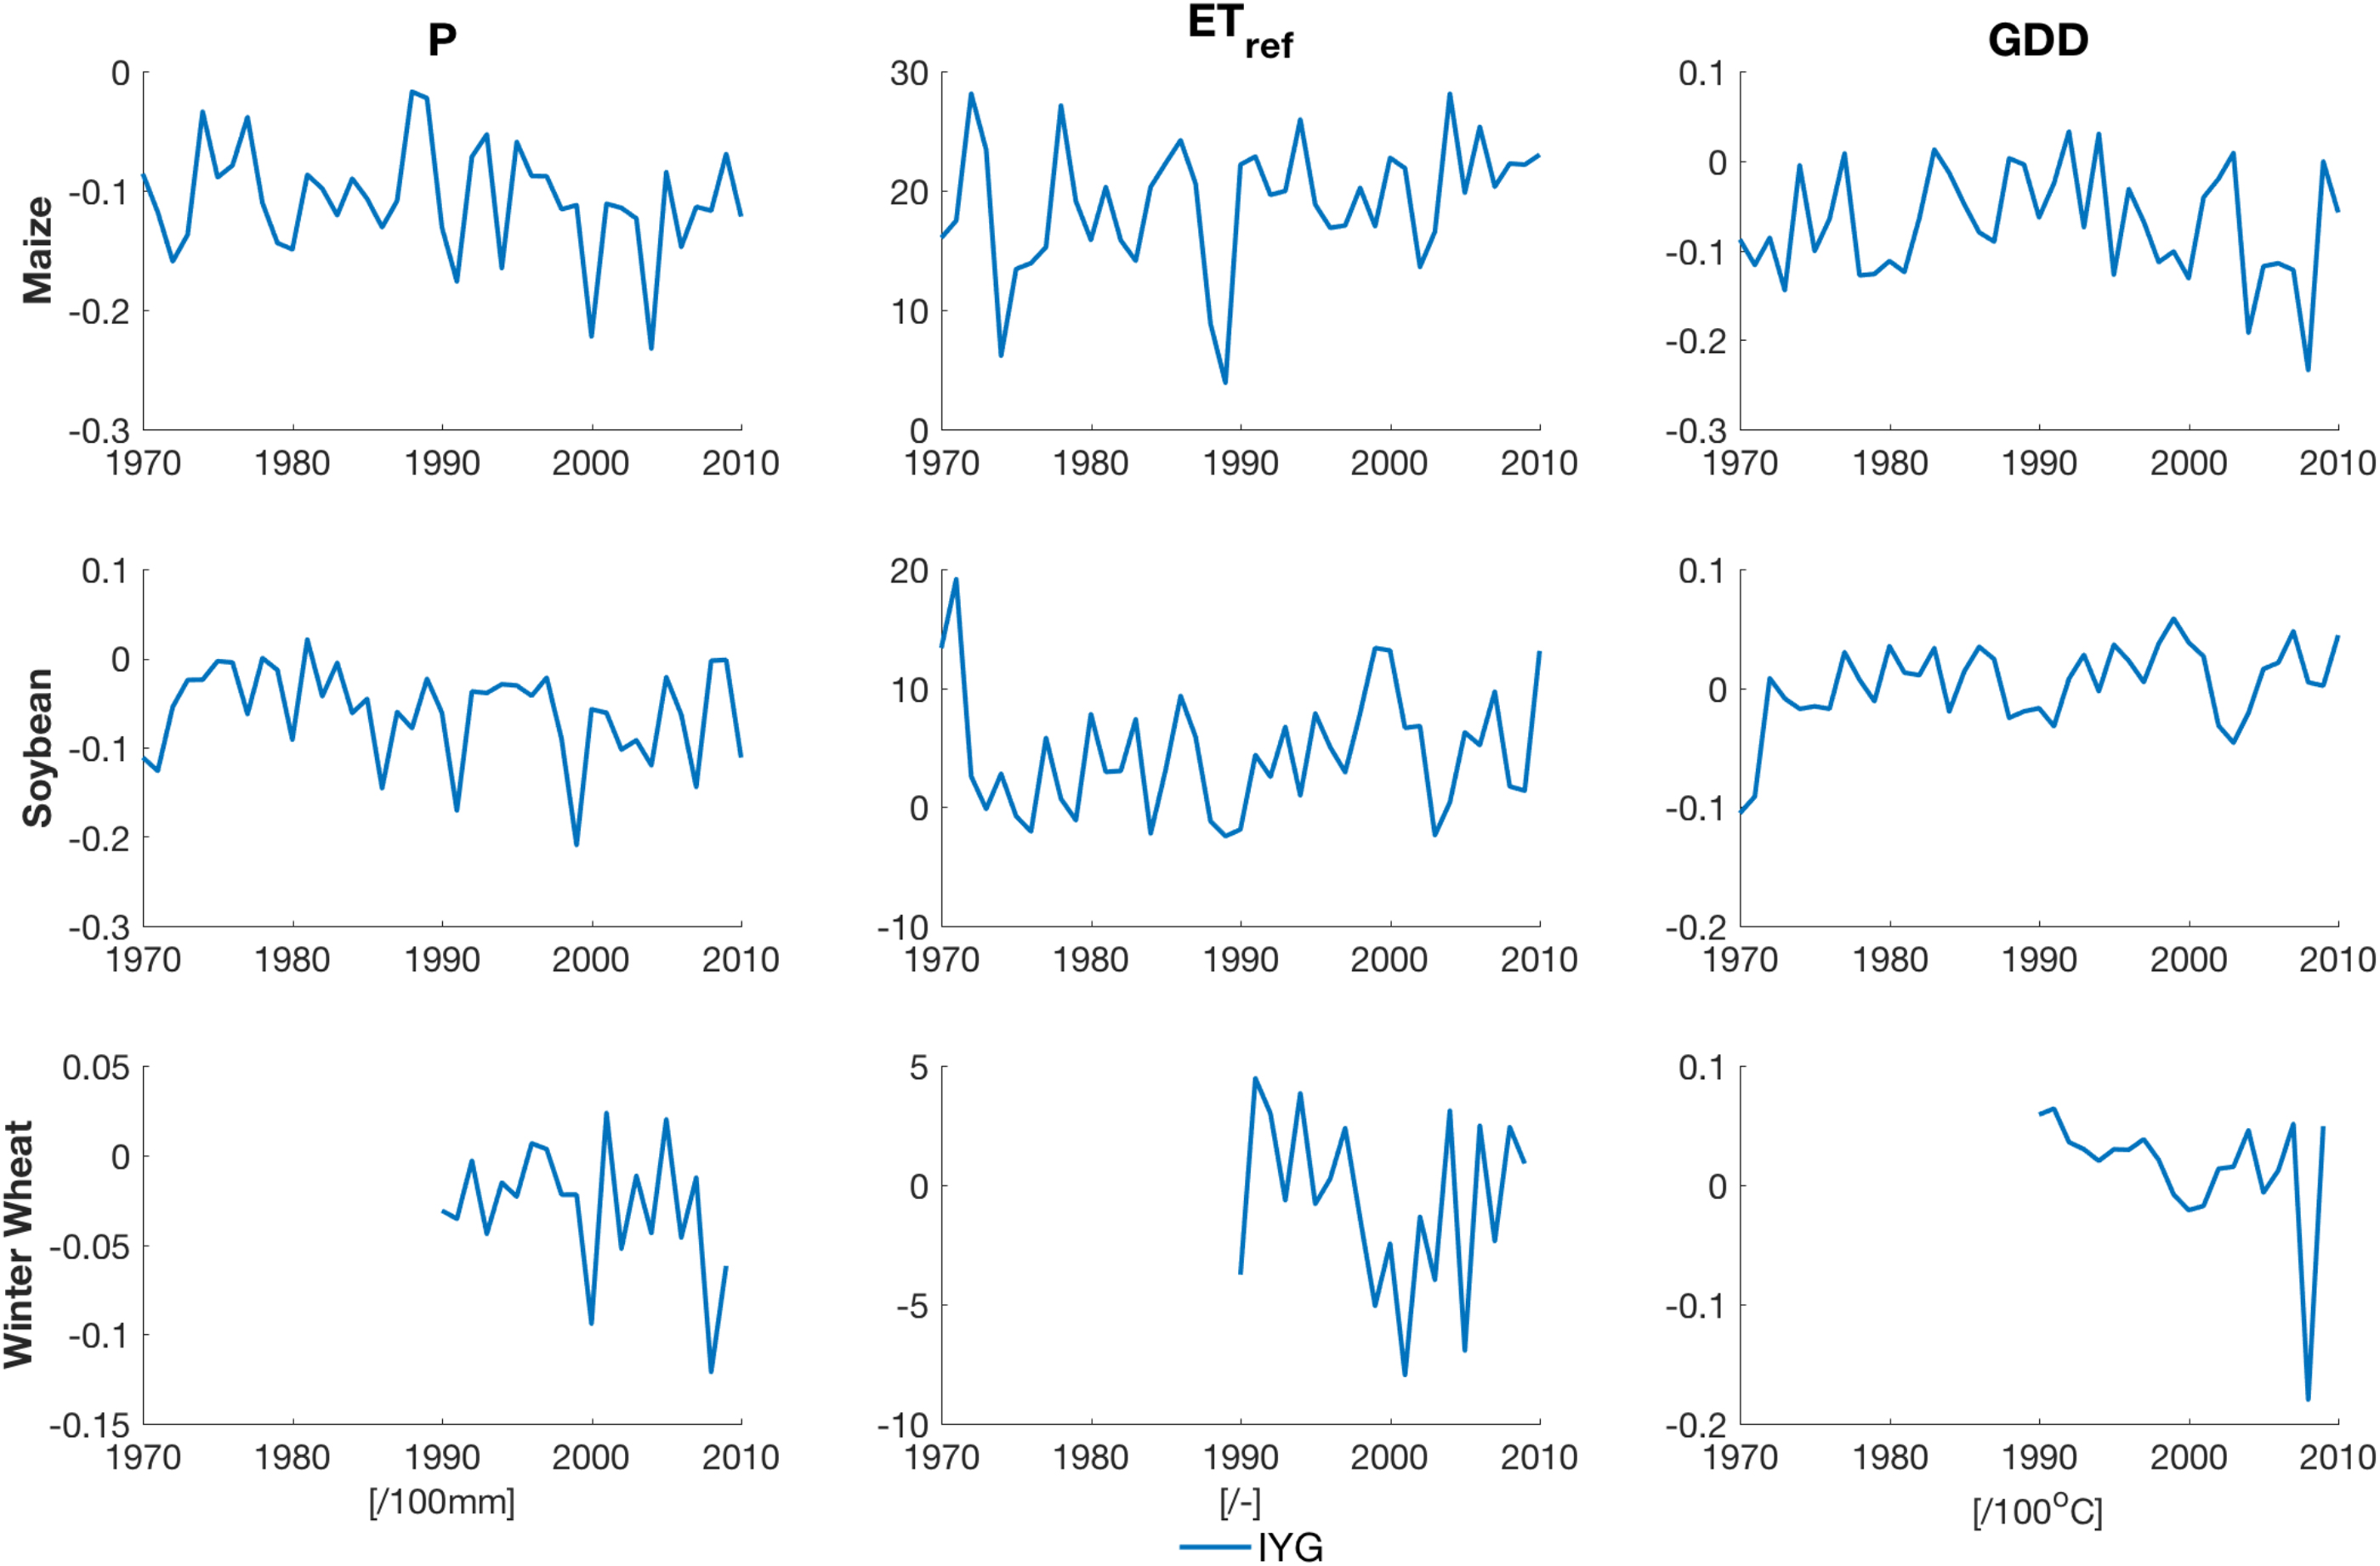
The previous analysis assumes the relationships between climate conditions and crop yields are stationary in time. However, recent studies have pointed to a changing relationship with vapor pressure deficit (VPD) and crop yields in the Midwest (Lobell et al 2014, Zipper et al 2016). To explore if there is a changing relationship with irrigated and rainfed crop yields and the climate factors used in this study, we fit a linear regression in space for each year between crop yield and a climate variable, and the slope of the regression is a measure of the crop yield response to climate, following the study of Lobell et al (2014). The equation is as follows:

where regression coefficients, α and β, are the intercept and slope, respectively; X is the climate variable, and Y is the crop yield. The superscript j indicates the county, the superscript t indicates the year; and the superscript c indicates the crop. The regression is performed for each crop and climate variable pair, resulting in regression coefficients for each year and each crop. The regression slope, β, is an estimate of the crop yield sensitivity to climate and how the slope changes is an estimate of changing sensitivity, which may be due to crop technological changes or due to a shift to an unfavorable climate regime. To estimate trends in the sensitivity, the Mann-Kendall test and Sen slope estimator (Kang et al 2009) were used to identify statistical significance and the trend of the slopes of IYG to climate factors respectively. Figure 4 plots the sensitivity estimate (spatial regression slope) in IYG for each crop except spring wheat, which is excluded from the analysis as there is insufficient data to run the spatial regression. Table 2 contains the results of the trend analysis. The only statistically significant changes in sensitivity in IYG are for soybean and GDD, Tavg, and VPD (figure S8).
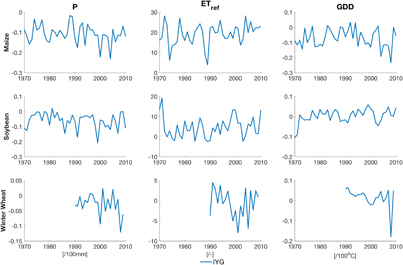
Figure 4. The sensitivity of IYG of maize (top row), soybean (middle row) and winter wheat (bottom row) to precipitation (left column), crop reference evapotranspiration (2nd column) and growing degree days (3rd column) for the growing season. The sensitivity is estimated by fitting a linear regression across counties for each year; the slope of the regression is the sensitivity.
Download figure:
Standard image High-resolution imageThe analysis was repeated for rainfed and irrigated crop yields for the growing-season climate (figure 5 and figure S9) and repeated at the monthly time step as crop sensitivity to climate varies during different stages of growth (Al-Kaisi and Broner 2009) (tables S2–4). For the irrigated crops, many of the climate-crop yield sensitivity values are around zero, indicating a decoupling of crop yields with climate. In general, the rainfed crop yields are more sensitive, as indicated by larger absolute values of the magnitude of the sensitivity. The exception to this statement is the winter wheat and average air temperature relationships: irrigated crop yields decline more with higher air temperatures than rainfed crop yields. The interannual variability in the regression slope coefficient is essentially the same for rainfed and irrigated soybean yields and ETref. This is the only pairing that shows such similarity between rainfed and irrigated crop yield respond to climate; this could have to do with the soybean irrigation schedule and crop growth period sensitive to ETref.
Figure 5. The sensitivity of irrigated (blue) and rainfed (green) crop yields to growing-season climate conditions. Crops are arranged by row; climate variables by column.
Download figure:
Standard image High-resolution image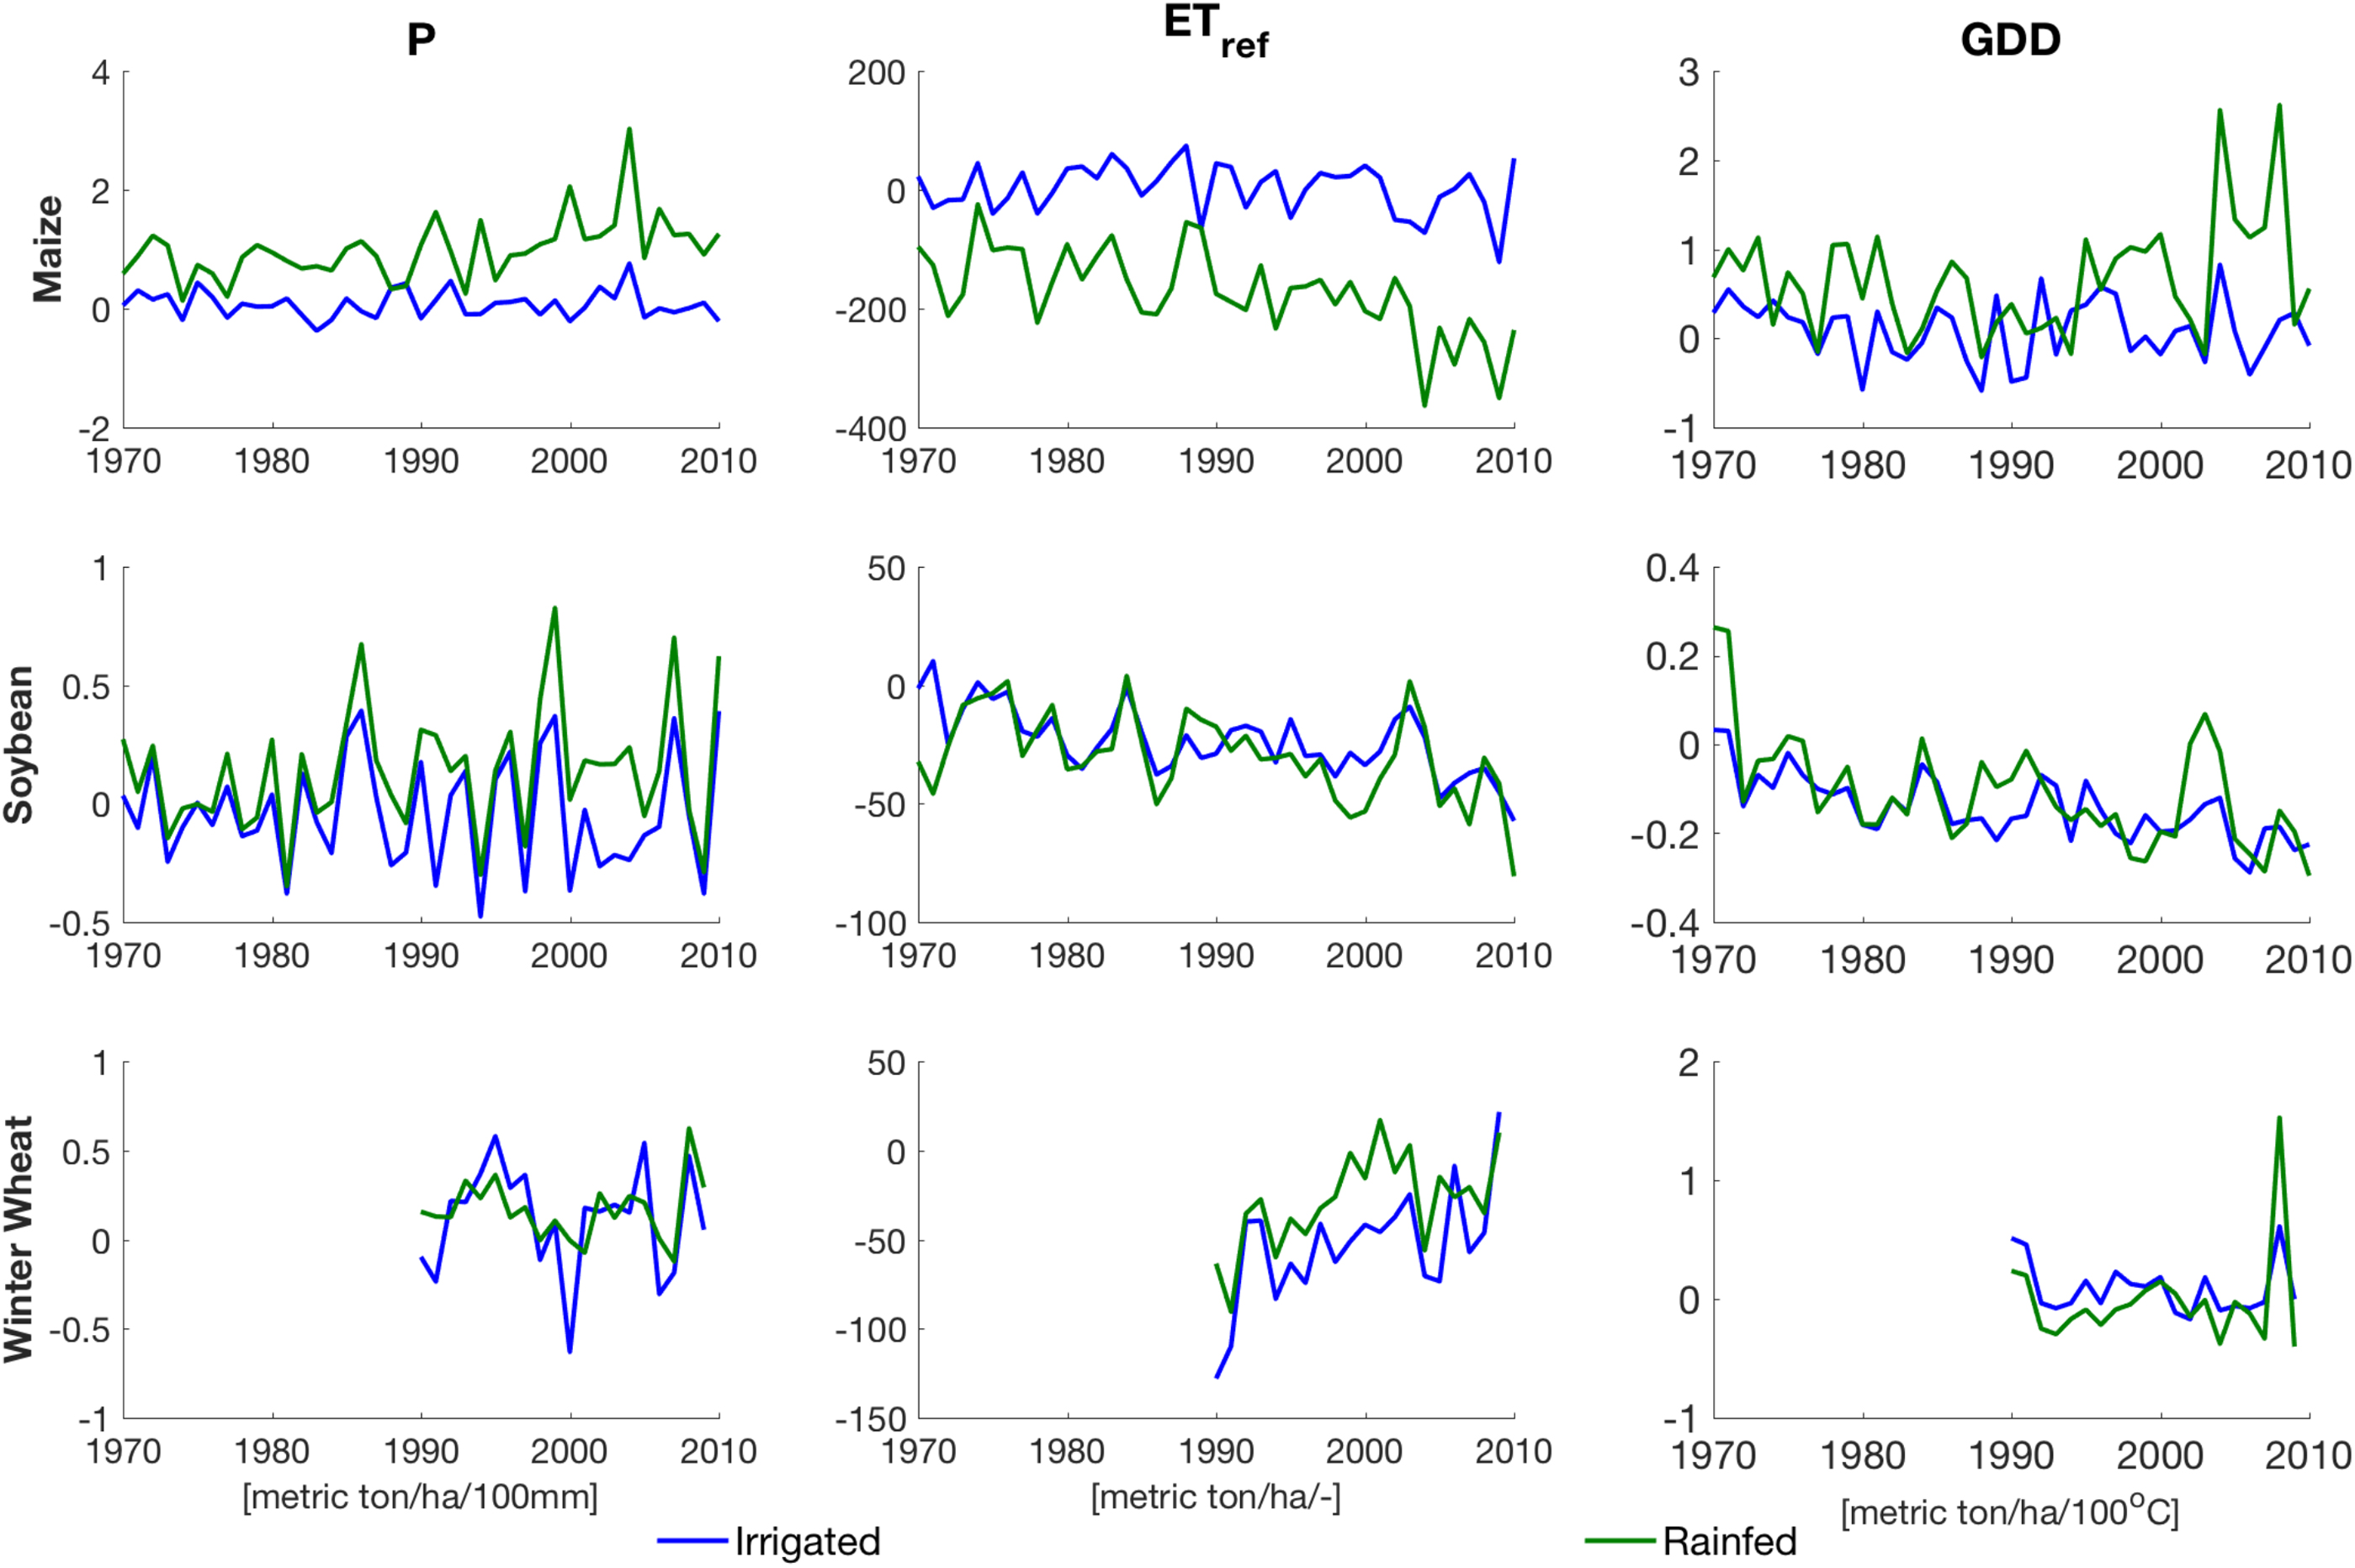
With few exceptions, all changes in sensitivity to climate are increasing with time. In general, increasing sensitivity is occurring with air temperature-related indices, specifically Tavg, ETref, GDD and VPD. Rainfed maize yields have statistically significant negative crop yield changes to VPD and ETref for the whole growing season and in all months (tables 2 and S2). For rainfed maize, there is a decreasing sensitivity to growing season precipitation, and an increasing sensitivity to ETref and VPD. Irrigated maize yields and IYG have remained largely unchanged in their crop yield-climate sensitivity response. Irrigated and rainfed winter wheat is becoming less sensitive to ETref, while irrigated winter wheat is increasingly sensitive to Tavg. The trend analysis for rainfed winter wheat also found negative trends (strengthening sensitivity) across all time periods, but the trend was weak and not statistically significant. Irrigated winter wheat also has an increasing negative relationship between average air temperature and crop yields.
Table 2. For maize, soybean and winter wheat, the trend in sensitivity of the relationship between climate and crop yields (italics if 90% significant, bold 95%).
| P [100 mm] | Tavg [°C] | ETref [−] | GDD [100 °C] | VPD [100 hPa] | ||
|---|---|---|---|---|---|---|
| Maize | IYG | −0.001 | 0.000 | 0.122 | 0.000 | 0.000 |
| Irrigate | −0.002 | −0.001 | −0.423 | −0.004 | −0.003 | |
| Rainfed | 0.016 | 0.008 | −3.66 | 0.006 | −0.015 | |
| Soybean | IYG | −0.001 | 0.001 | 0.077 | 0.001 | 0.001 |
| Irrigate | 0.000 | −0.005 | −0.801 | −0.004 | −0.001 | |
| Rainfed | 0.003 | −0.006 | −0.782 | −0.005 | −0.004 | |
| Winter Wheat | IYG | −0.001 | −0.001 | −0.124 | −0.002 | 0.000 |
| Irrigate | −0.004 | −0.010 | 3.749 | −0.007 | −0.006 | |
| Rainfed | −0.002 | 0.001 | 2.722 | −0.008 | −0.004 |
The Pettitt test (Pettitt 1979) was used to identify if and when abrupt change points exist for the sensitivity, and those cases having statistically significant change points are in table S5 for maize and soybean, which have longer time series to analyze. Table S5 shows that there are some statistically significant change points. For maize, 1989 is identified as a change point in the sensitivity of rainfed crop yields to P, ETref, and VPD. For irrigated soybean yields, 1985 is a change point for the sensitivity to three variables and the early 1990s was a change point for rainfed soybean. There were no change points detected for irrigated maize.
4. Discussion and conclusions
This study demonstrates strong climate controls on IYG response in maize and soybean crops, with the highest sensitivity to precipitation, VPD, and ETref. Winter wheat IYG response is the least sensitive, demonstrating a threshold response to growing season precipitation and a positive correlation with GDD. This threshold behavior between climate and crop yield is consistent with other studies. For example, (Lobell et al 2011b) demonstrated a nonlinear relationship between high air temperature and crop yields, (Troy et al 2015) showed non-linear and threshold-type relationship between crop yields and various climate indices, and (Leng 2017a) showed the changing relationship between corn yield and growing season air temperature. In many cases, the IYG response is driven by the rainfed crop yield response as irrigation can essentially decouple crop yields from climate. However, as irrigated crop yields have increased in time due to technological improvements, they have grown more sensitive to certain climate conditions. Irrigated crop yields, for maize in particular, have increased during average growing season conditions but not during the extremes, such as particularly cold or hot growing seasons.
The sensitivity of crops to climate conditions has largely been increasing, such that crop yields have a larger response to a given climate anomaly now compared to the 1970s. For maize, this increasing sensitivity is confined to rainfed crops. Soybean shows similar increasing sensitivity in both rainfed and irrigated crops, and winter wheat has a mixed response. (Lobell et al 2014) showed a statistically significant increase in sensitivity of rainfed maize yields with VPD 60–90 days after sowing in the Illinoi, Indiana, Iowa, Nebraska, South Dakota and Kansas with the reference crop explanation that it is due to denser sowing of maize, but no statistically significant changes in air temperature sensitivity. (Zipper et al 2016) showed that maize and soybean yields of the central and southeastern US have become more sensitive to drought over time. This study's results are similar: there is an increasing sensitivity across our larger study region for rainfed crop yields with VPD for the whole growing season. For average air temperature, we find a strengthening sensitivity during the entire growing season and from 91–150 d after sowing. We also find an increasing sensitivity to ETref, which was not analyzed by (Lobell et al 2014). Our research differs in the study area but also the spatial and temporal scale of analysis. Lobell et al (2014) used a random sample of 100 fields for each county-year combination in Illinois, Indiana, and Iowa whereas this study uses county-level crop yield estimates. By using county-level crop yields, much of the field-level heterogeneity, such as soil type (Tolk et al 1999), soil quality (Cassman 1999), and landscape topographic factors (Green and Erskine 2004), is averaged out. This averaging is useful for isolating the large-scale crop response to climate.
As (Lobell 2014) demonstrated, a technology change that leads to a net increase in yields over time does not necessarily reduce the impacts of climate variability or change. This study shows there are varying benefits between irrigated and rainfed agriculture to technologically-derived crop yield gains, with some crops becoming increasingly sensitive to certain climate conditions. Some previous studies have only analyzed irrigated crop yields (Schlenker et al 2007, Meza et al 2008), whereas this study considers both as did others (Grassini et al 2009, Troy et al 2015, Tack et al 2017). The results of this study as well as others that have considered both types of crops demonstrate how important it is that both be considered, given that they have variable response to climate and very different impacts on water resources.
Study limitations. Due to data availability, this study is confined to west of the Mississippi with its predominantly drier climate than the eastern US. Therefore, the range of climate conditions in this study does not represent the entire US growing region. The results cannot be extrapolated to more humid regions or to climate extremes, such as flooding or heavy precipitation which has been shown to cause additional negative effects on US Midwest maize yield and production levels (Rosenzweig et al 2002). However, the range of climate variation is large and the results may apply to outside the study region, such as Iowa whose growing season precipitation of 200–900 mm (Rosenzweig et al 2002) is mostly within the range of precipitation in this research. Irrigated agriculture has been expanding into the eastern US, and it would be informative to repeat this analysis there to quantify the benefits of irrigation in a humid climate.
This study primarily looked at growing-season climate variables. Soil moisture availability at the start of the growing season was evaluated as a possible control on crop yield gains, but it was found to be a weak predictor of crop yields (table S1). There are other climate indices, such as heat waves and dry spells, that impact crop yields that have been documented in prior studies (Legler et al 1999, Rowhani et al 2011, Troy et al 2015). This study in conjunction with the earlier study evaluates the range of climate extremes (Troy et al 2015) and growing season characteristics (this study) that impact irrigated crop yield gains, since the intraseasonal changes in air temperature and precipitation may also impact crop yield (Legler et al 1999, Rowhani et al 2011). Another limitation is only considering total precipitation rather than effective precipitation which would only include the water that infiltrates into the soil. Using effective precipitation or soil moisture would have the potential to lead to an improved understanding of the impact of climate on IYG because these variables would more accurately quantify the water available to the crops, compared to actual precipitation. Furthermore, the reference ET for crop is not the value for actual ET, but the estimated ET for a well-watered crop. This research focuses on the relationship between crop yield and climate variable, rather than farmer practices. Future studies could incorporate estimates of infiltration, actual ET, effective precipitation and soil moisture from crop or hydrologic models or satellite estimates of soil moisture, which would provide further details to inform climate adaptation in agriculture.
Study implications. Quantifying the relationship between crop yields and growing season totals allows for the potential application of these results with seasonal climate forecasts, which often do not include intraseasonal variability to understand potential impacts on crop yields. It also allows for potential application with projections of changes and extremes of climate variability, where there is more skill at the seasonal level than daily (Reddy and Pachepsky 2000, Diodato and Bellocchi 2007). Changes and extremes of climate variability may push growing regions into marginal rather than optimal growing conditions, and quantifying the large-scale irrigated crop yield gains under a range of climate conditions now informs what the potential impacts of changes and extremes of climate variability will be on agriculture, particularly how the benefit of irrigation may change as climate conditions change.
Under the stresses of changes and extremes of climate variability and population pressures, furthering our knowledge about the impact of climate on irrigated crop yield gains is a critical piece of information in balancing water and food needs. Irrigated crops have higher crop yields and less sensitivity to climate variability, but they also come at a cost to water resources. Comparing the irrigated crop yield gains with water consumption may reveal that in some cases, rainfed wheat may be preferable to avoid negative impacts on water resources. This does not necessarily decrease crop yields significantly: research has shown that in some cases rainfed crop yields can approach irrigated crop yields (Dean Yonts et al 2009). This study indicates there may be optimal climate zones where irrigation provides larger increases in crop yields compared to rainfed crops. Understanding the benefits in terms of crop yield gains compared to the potentially negative impacts of agricultural water use, through increased water scarcity, can help inform agricultural and water resources policies.
Acknowledgments
We would like to thank Chinpihoi Kipgen for sharing the processed USDA crop yield data, Naresh Devineni for the processed climate data, and Xiao Zhu for sharing the calculated data of the GDD, CDD, and SDII climate indices. This work was partially funded by NSF EAR-1360446. We would like to thank the two anonymous reviewers for their helpful suggestions.