
Abstract
Long-term warming trends across the globe have shifted the distribution of temperature variability, such that what was once classified as extreme heat relative to local mean conditions has become more common. This is also true for agricultural regions, where exposure to extreme heat, particularly during key growth phases such as the reproductive period, can severely damage crop production in ways that are not captured by most crop models. Here, we analyze exposure of crops to physiologically critical temperatures in the reproductive stage (Tcrit), across the global harvested areas of maize, rice, soybean and wheat. Trends for the 1980–2011 period show a relatively weak correspondence (r = 0.19) between mean growing season temperature and Tcrit exposure trends, emphasizing the importance of separate analyses for Tcrit. Increasing Tcrit exposure in the past few decades is apparent for wheat in Central and South Asia and South America, and for maize in many diverse locations across the globe. Maize had the highest percentage (15%) of global harvested area exposed to at least five reproductive days over Tcrit in the 2000s, although this value is somewhat sensitive to the exact temperature used for the threshold. While there was relatively little sustained exposure to reproductive days over Tcrit for the other crops in the past few decades, all show increases with future warming. Using projections from climate models we estimate that by the 2030s, 31, 16, and 11% respectively of maize, rice, and wheat global harvested area will be exposed to at least five reproductive days over Tcrit in a typical year, with soybean much less affected. Both maize and rice exhibit non-linear increases with time, with total area exposed for rice projected to grow from 8% in the 2000s to 27% by the 2050s, and maize from 15 to 44% over the same period. While faster development should lead to earlier flowering, which would reduce reproductive extreme heat exposure for wheat on a global basis, this would have little impact for the other crops. Therefore, regardless of the impact of other global change factors (such as increasing atmospheric CO2), reproductive extreme heat exposure will pose risks for global crop production without adaptive measures such as changes in sowing dates, crop and variety switching, expansion of irrigation, and agricultural expansion into cooler areas.
Export citation and abstract BibTeX RIS

Content from this work may be used under the terms of the Creative Commons Attribution 3.0 licence. Any further distribution of this work must maintain attribution to the author(s) and the title of the work, journal citation and DOI.
1. Introduction
Increases in mean annual temperatures have been evident throughout the world in the past few decades [1], including in most major agricultural regions [2]. Along with mean temperature changes, there has been an increase in the occurrence of warm temperature extremes, and a simultaneous reduction in cold extremes [3–5]. The trends in occurrence of events historically considered extreme are the natural consequence of a shifting mean, but changes in the shape of the temperature distribution have also likely played a role [5–7]. As with changes in mean temperature, the trends in extremes are primarily attributable to greenhouse gas emissions [8, 9], and therefore are expected to continue in the coming decades.
Hotter average temperatures affect crop production via several mechanisms, including by speeding rates of crop development and evapotranspiration [10–12]. The effects of changing mean conditions are fairly well captured by crop simulation models frequently used to assess climate change impacts, with the notable exception of effects of mean climate on pests and diseases [13]. However, extreme temperatures (both hot and cold) can also cause physiological damage and lead to crop failure, particularly during sensitive stages of the crop cycle (e.g. the flowering or reproductive stage) [14, 15]. Although widely recognized by the crop modeling community, the effects of extremes are often not well quantified and are generally not captured in existing models [16–19].
Crops are particularly sensitive to extreme heat in the reproductive period, where it can substantially reduce grain number and final yields, and in the most negative cases lead to complete crop failure [20–22]. Teixeira et al [23] examine projected exposure to reproductive heat stress for wheat, maize, rice and soybean in the period 2071–100. Their analysis considered a single global circulation model (GCM) projection, without correction for potential GCM temperature bias in agricultural regions. Nonetheless, the study suggested the potential for large increases in area exposed to reproductive heat stress on a global basis, particularly for maize and rice, although adaptive measures are shown to partially mitigate impacts, especially for wheat.
Although crop heat stress is expected to increase by the end of the 21st century, there has been little work done to document changes already occurring in global cropping systems, and only then in individual regions [19, 24]. Here, we examine historical rates of exposure to crop-specific critical temperatures, henceforth referred to as Tcrit, in the 30-day window around flowering, i.e. the reproductive period. We assess historical trends throughout the global area of maize, wheat, rice, and soybean, to test whether occurrence has been changing in the last three decades. We also consider sensitivity to future warming over the next few decades (until the 2050s), in order to identify areas at risk of large increases in exposure.
2. Methods
Representative locations are first selected to capture nearly all of the global harvested area for maize, wheat, rice, and soybean. Starting with a half-degree resolution map of harvested area around the globe from [25], we randomly selected ∼1100 grid cells that contain at least 10% area harvested for one of the four crops, and that were at least 100 km away from other points. Assuming that weather at each of the selected points is generally representative of conditions within a 100 km2 radius, this collection of points represents ∼98% of global harvested area for all of the four crops together. This value varies from 96% for maize to 99% for soybean.
Daily weather data were generated from 1980 to 2011 for each of the selected points by interpolating daily minimum and maximum temperature data from ∼40 000 weather stations in a merged database from the Global Historical Climatology Network [26] and the Global Surface Summary of the Day [27, 28]. In order to improve accuracy, spatial interpolation was applied to the daily anomalies from a multi-year average climatology at a 1 km2 resolution (i.e. WorldClim, [29]) rather than the actual station data itself, which helps to appropriately account for consistent spatial gradients in temperature due to latitude or elevation [30], as in [31]. A distance-weighted regression method (i.e. angular distance weighting) was used to interpolate the daily weather anomalies from sowing to harvest date for each site.
The reconstructed daily weather data were then paired with a gridded crop calendar dataset from [32], in order to determine planting and harvest dates for each crop and point location. For wheat, the crop calendars for spring versus winter wheat were chosen based on expert knowledge of which type predominates in which area. In addition, rather than using the sowing dates from the crop calendars for wheat, the season was presumed to start 120 days before the harvest date for all locations, in order to capture the primary growing period for both spring and winter wheat.
The crop calendars in [32] represent averages at a 0.5° resolution, and were compiled from a combination of national and sub-national scale data. While sowing and harvest dates can vary substantially at finer spatial scales, we necessarily rely on data products that estimate averages for entire regions in order to do a global analysis. Moreover, since we are emphasizing results at regional to global scales, it is unlikely that variations below sub-national scales would appreciably affect the results.
The reproductive period was assumed to last 30 days for all crops, and was centered around 5 days prior to a critical crop-specific event (i.e. heading for wheat and rice, pod-setting for soybean, and silking for maize). This date was presumed to occur a fixed proportion of the season back from the harvest date, with the proportions varying by crop and based on average state-wide crop calendars from the United States National Agricultural Statistics Service (NASS; www.nass.usda.gov/Data_and_Statistics/). These proportions were 0.45 for wheat, 0.55 for maize, and 0.50 for soybean. The proportion for rice, which is not included in the NASS dataset, was assumed to be 0.3, based on a literature review of rice crop calendars around the globe (table S1 in the supplementary material, available at stacks.iop.org/ERL/8/024041/mmedia).
The different states in the continental US give some indication of climate variability, and in fact, the seasonal proportions to flowering across states are relatively constant. We acknowledge that these US-based proportions are unlikely to be constant around the globe, as shown in the results of a literature review in table S1 in the supplementary material. This is especially the case for wheat, which typically has a rising temperature profile throughout the season, and phenology which varies with the shape of the profile (figure S1 in the supplementary material, available at stacks.iop.org/ERL/8/024041/mmedia). Unfortunately, we do not know of any global data product that estimates crop flowering dates, and therefore have to rely on simple metrics to estimate this. Finally, given that we use a 30 day window for the reproductive period, shifting the timing of flowering by a week or two would result in a new window with substantial overlap with the current window. It is therefore unlikely that this would make a large difference for regional or global-scale results.
Using the weather data and crop calendars, we calculated the number of days in the reproductive period over Tcrit per season for each crop at all selected locations from 1980 to 2011. For Tcrit, we use values taken from the review of [14]: 34 ° C for wheat, 35 ° C for maize, 36 ° C for rice and 39 ° C for soybean. It should be noted that these critical temperatures not only vary by crop species, but also, to some extent, by crop variety. In addition, canopy temperatures, which are influenced by soil moisture, atmospheric vapor pressure deficit, and transpiration efficiency of the variety [33], often differ from the air temperatures in our reconstructed weather data. As a reference indicator, we also calculated the mean growing season temperature for each location and year.
Using the yearly historical values for each location and crop combination, we calculated decadal means in the 2000s, and 32-year trends from 1980 to 2011. In addition, we calculated decadal means with projected future warming until the 2050s, using results from 37 models in the CMIP5 climate model inter-comparison project [34] with the RCP8.5 emission scenario [35]. We used model projections for a single representative concentration pathway (RCP) radiative forcing scenario, since the climate evolution for the next few decades does not depend substantially on emission pathway. For all climate models, we calculated projected changes by month and year relative to the 2000s, interpolated these changes to the daily scale, and then added them to the actual values in the 2000s in order to simulate realistic daily variability. By adding the temperature change from the models to actual weather data, we also help to account for any potential GCM bias in agricultural areas.
For both historical and projected future periods, we analyze reproductive extreme heat exposure by individual crop location, and also at the aggregated global scale. For the global analysis, we perform a weighted average, with the weights determined by harvested area within 100 km of each location, assuming that areas within this radius experience, on average, the same amount of exposure.
We perform two sets of sensitivity tests in order to assess the robustness of our conclusions. First, we calculate reproductive heat exposure at the global scale using 1 ° C higher critical temperatures. Second, warming temperatures increase the speed of crop development, which could potentially shift the timing of the reproductive period in future climates. This is not necessarily reflected in the static crop calendar used in this study. Rough estimates are that 1 ° C warming reduces time to flowering by ∼4 days [36], but this will vary by crop, variety and the baseline temperatures. In order to test whether reproductive extreme heat exposure is sensitive to accelerated development, we perform a sensitivity test where we shift the reproductive stage back 4 days per +1 ° C warming.
3. Results
As expected, the cropping systems that currently experience the highest average growing season temperatures are primarily in the tropics and sub-tropics (figure 1). Among the four crops under analysis, wheat is generally grown at the coolest temperatures, and rice at the hottest, with maize and soybean in between (table 1, figure S1 in the supplementary material). However, all crops are grown across a wide range of average growing season temperatures around the globe, with a larger amount of spatial variability relative to inter-annual variability at each site. Among the four crops, wheat has the most inter-annual variability in temperature due to its primarily temperate planting locations, and maize has the highest spatial variability.
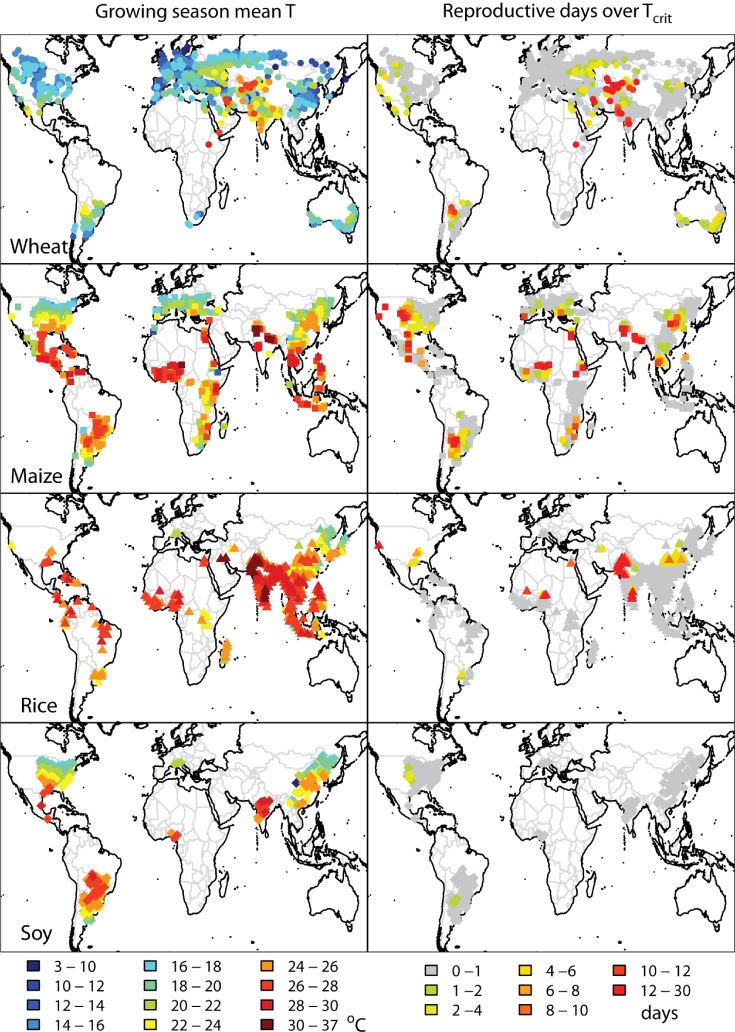
Figure 1. Mean values in the 2000s for all four crops. Left column: growing season average temperatures. Right column: days over Tcrit in the reproductive period.
Download figure:
Standard image High-resolution imageTable 1. Mean growing season temperatures, spatial and temporal standard deviations, and temperature ranges for the 2000s for wheat, maize, rice and soy. The spatial standard deviations are first calculated across sites by year, and then averaged in time. The temporal standard deviations are first calculated per site across the 32 years, and then averaged spatially. All metrics, except the temperature ranges, are weighted by the harvested area within 100 km of each cropping location.
| Mean growing season temperature (° C) | Spatial standard deviation (° C) | Temporal standard deviation (° C) | Range (° C) | |
|---|---|---|---|---|
| Wheat | 17.0 | 3.3 | 0.7 | 2.1–30.5 |
| Maize | 22.2 | 3.7 | 0.6 | 8.6–37.3 |
| Rice | 26.3 | 3.2 | 0.3 | 7.0–35.7 |
| Soy | 22.7 | 3.0 | 0.6 | 9.5–30.4 |
Even with recent warming trends, most cropping regions have not yet been systematically exposed to reproductive extreme heat in the past 30 years. For example, about one half of the locations for wheat and maize had less than one day of exposure to reproductive days over Tcrit for all years in the 2000s, with even higher proportions for rice and soybean cropping systems. For wheat, the highest exposure to reproductive extreme heat in the 2000s was in Central and South Asia (figure 1). Maize had frequent exposure in diverse locations, including the United States, Mexico, Argentina, parts of sub-Saharan Africa and the Nile basin, South Asia and China. Rice had the highest exposure in Pakistan and southern India, with other scattered locations including California, the Nile basin and the Sahel region of west Africa. Soybean had the least exposure of the four crops, with the only non-zero exposure in the central US and Argentina.
There have been strong warming trends in mean growing season temperature around the globe since 1980, particularly in Europe, the Middle East, and the northern half of China and Japan (figure 2). One major exception to the global warming trend is in North America, consistent with other studies [2, 37], where a 'warming hole' has existed during much of this period. Seasonal average temperature trends from 1980 to 2011 were ∼0.3 °C/decade on average across all four crops, consistent with global land-based full year trends over this period [1]. Wheat had the strongest seasonal warming trends, and soybean the least, only about half that of wheat (table 2), which corresponds with greater rates of warming at higher latitudes [38].
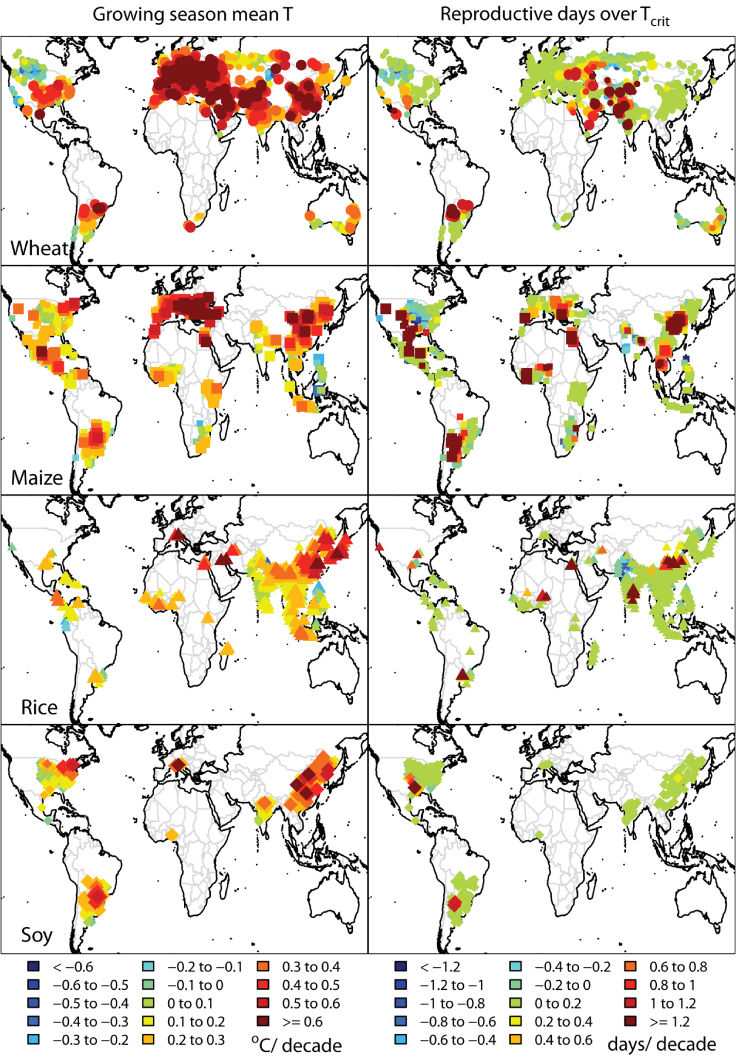
Figure 2. Historical trends from 1980 to 2011 for all four crops. Left column: growing season average temperatures. Right column: days over Tcrit in the reproductive period. Larger symbols represent trends that are significant at p ≤ 0.05.
Download figure:
Standard image High-resolution imageTable 2. Historical trends from 1980 to 2011 of growing season mean temperature and reproductive days above Tcrit, weighted by the harvested area within 100 km of each cropping location. Also shown are the per cent harvested areas with positive and negative trends, greater or less than ±0.1 °C/decade and ±0.1 days/decade, respectively.
| Growing season mean temperature | Reproductive days above Tcrit | |||||
|---|---|---|---|---|---|---|
| Trend from 1980 to 2011 (°C/decade) | % area with trend ≥0.1 °C/decade | % area with trend ≤–0.1 °C/decade | Trend from 1980 to 2011 (days/decade) | % area with trend ≥0.1 days/decade | % area with trend ≤–0.1 days/decade | |
| Wheat | 0.33 | 83 | 5 | 0.12 | 27 | 10 |
| Maize | 0.21 | 68 | 3 | 0.14 | 32 | 25 |
| Rice | 0.23 | 86 | 2 | 0.04 | 15 | 7 |
| Soy | 0.16 | 68 | 1 | 0.01 | 6 | 5 |
Trends in reproductive days over Tcrit only roughly correlate (r = 0.19) with trends in growing season mean temperature (figure S2 in supplementary material, available at stacks.iop.org/ERL/8/024041/mmedia). This correlation will likely strengthen as more regions reach critical thresholds. However, significantly positive historical trends since 1980 still exist in many locations (figure 2). For wheat, these include parts of eastern Europe, the Middle East, and Central and South Asia, and regions in Brazil, Argentina and North America. The most significantly positive trends for maize were in eastern Europe, the Nile basin, Cote d'Ivoire in Africa, Argentina, throughout the United States and Mexico, and northern China. Positive trends for rice were especially pronounced in northern China, eastern India and the Nile basin, while soybean had a few significantly positive trends in Argentina and the central US. Many other regions for the four crops have non-zero, but insignificant trends, including negative trends for maize and wheat in the United States and rice in northern South Asia.
A comparison of positive and negative historical trends in seasonal warming and reproductive extreme heat exposure by location since 1980 reveals some of the same differences in these two indicators (table 2). For example, a vast majority of wheat harvested area has experienced seasonal mean warming, with 83% of total area exhibiting trends ≥0.1 °C/decade, and only 5% with trends ≤ − 0.1 °C/decade. Trends in reproductive days over Tcrit for wheat were also more often positive than negative, but the contrast was less stark. Specifically, 27% of wheat area exhibited trends ≥0.1days/decade, while 10% had trends ≤ − 0.1 days/decade. For soybean, roughly two thirds of harvested area experienced seasonal mean warming trends, but for reproductive heat exposure, positive and negative trends were small and relatively balanced.
Future warming implies that more cropping systems will be reaching the reproductive critical temperatures in the coming decades, and those that already have non-zero exposure will be reaching these more often. Future warming is expected to be higher near the poles than the tropics, as in recent decades [39]. However, given low inter-annual variability and currently high temperatures in the tropics, warming signals may be more noticeable and have greater impacts in these locations [40]. The CMIP5 model projections account for differential rates of projected warming around the globe.
The projected mean changes (across climate models) from the 2000s to the 2030s and 2050s in reproductive days over Tcrit for each location and crop are shown in figure 3. Large increases are seen for maize in most locations around the globe, especially by the 2050s. For rice, many areas in South and East Asia will become newly exposed, consistent with the results of [23]. Central and South Asia will continue to be increasingly problematic for wheat, with additional exposure for some areas in the US, Mexico, southern Russia and Brazil/Argentina. Soybean will see more exposure in North and South America and China, but not to the same degree as for the other crops. Many of the projected changes in reproductive extreme heat exposure in the coming decades are outside two standard deviations of the historical variability in the 2000s, and will necessitate adaptations to continue growing these crops in the same locations.

Figure 3. The mean change across the CMIP5 models from the 2000s to the 2030s (left column) and 2050s (right column) in reproductive days over Tcrit for all four crops. Larger symbols represent changes that are at least one day and larger than two standard deviations of the variability in the 2000s.
Download figure:
Standard image High-resolution imageFigure 4 shows the exposure of global harvested area for each crop to at least 5 days of reproductive extreme heat, historically from 1980 to 2011, and then for future projections to the 2050s. For future projections, the spread of CMIP5 model results is shown in boxplots; (the middle line shows the median projection across all climate models, the boxes show 25th–75th percentiles, and the whiskers show the range). At this scale, we also examine the sensitivity to the choice of Tcrit. For the 2000s, maize had the highest total exposure at 15% of global harvested area in a typical year, followed by rice, wheat and soybean (figure 4, table 3). Positive historical trends are seen for wheat, maize and rice in the last 30 yr, although only the wheat trends were significant (at p ≤ 0.05). Some recent years were well above the trend lines, e.g. wheat in 2010 or maize in 2006, although years such as these will be common by 2030.

Figure 4. The per cent of global harvested area with at least five reproductive days over Tcrit, for all four crops. Values are shown historically by year from 1980 to 2011, with associated trend lines. Significant historical trends (at p ≤ 0.05) are shown with thicker lines. Future predicted values by decade until the 2050s represent the range of projections from the CMIP5 models. Red points use the same critical temperatures as used throughout the letter, whereas orange points use critical temperatures raised by 1 ° C.
Download figure:
Standard image High-resolution image
Table 3. Per cent of total harvested area with at least 1, 5 or 10 reproductive days above Tcrit in the 2000s, and in the 2030s and 2050s according to the mean CMIP5 model projections.
| 1 day | 5 days | 10 days | |||||||
|---|---|---|---|---|---|---|---|---|---|
| 2000s | 2030s | 2050s | 2000s | 2030s | 2050s | 2000s | 2030s | 2050s | |
| Wheat | 19 | 32 | 41 | 5 | 11 | 18 | 2 | 4 | 8 |
| Maize | 32 | 52 | 63 | 15 | 31 | 44 | 8 | 18 | 29 |
| Rice | 14 | 28 | 44 | 8 | 16 | 27 | 5 | 10 | 18 |
| Soy | 4 | 11 | 20 | 0 | 3 | 8 | 0 | 1 | 3 |
With future warming, strong non-linearities in total global harvested area exposed to reproductive extreme heat are seen for both rice and maize, given that many of their tropical growing regions are close to reaching the critical temperatures (figure 4). The total area exposed for rice is projected to grow from 8% in the 2000s to 27% by the 2050s, whereas global maize exposure will grow from 15 to 44% over the same period. Wheat and soybean will also see increasing exposure, but at slower rates than for rice and maize.
Using higher Tcrit values for each crop results, as expected, in lower estimated global exposure to reproductive extreme heat; however, the historical trends are relatively robust with respect to the specific values of Tcrit. With future projected warming in the 2050s, the global harvested area exposed for maize varies from 44 to 31% between the two critical temperatures, and from 27 to 16% for rice.
Sensitivity tests were also conducted where the reproductive period was shifted 4 days earlier for +1 ° C warming, and 8 days earlier for +2 ° C. This shortening of the growing season helps to mitigate the exposure to reproductive extreme heat primarily for wheat, which faces a rising temperature profile throughout the season in most areas (figure S1 in the supplementary material, available at stacks.iop.org/ERL/8/024041/mmedia). For example, with a fixed +2 ° C warming relative to the variability in the 2000s, the projected total global wheat area exposed to at least five days over Tcrit rises from 5 to 13%, but this value reduces to 9% with a shift to an earlier, and cooler, reproductive period. The other three crops experience little to no sensitivity to changes in the timing of the reproductive period on a global basis, but changes could be significant in particular regions.
4. Conclusions
With rising global mean temperatures, crops are increasingly being exposed to extreme heat in the reproductive period, raising the risk of yield damage or failure in ways that are not captured by most crop models. While many areas have not yet reached these critical temperatures on a consistent basis, particularly in tropical areas,positive trends in global exposure to at least five reproductive days over Tcrit are seen since 1980 for wheat, maize, and rice. In the 2000s, maize had the highest exposure at 15% of global harvested area, although this value was somewhat sensitive to the definition of the critical temperature.
With future warming, the strongest non-linearities in projected global exposure are seen for maize and rice. Particular cropping systems that look especially vulnerable with future warming include maize in most locations across the globe, wheat in Central and South Asia, and rice throughout South and East Asia. Soybean production will continue to remain relatively safe from reproductive extreme heat exposure, given its higher Tcrit relative to the other crops.
Apart from exposure to reproductive extreme heat, other factors help to determine the overall crop response to environmental change (e.g. increasing atmospheric CO2 and O3 concentrations, changes in soil moisture and vapor pressure deficit, increases in mean temperatures, and the interactions between these changes). However, extreme heat during the reproductive period could lead to complete crop failure, and is therefore particularly risky for farmers. On-farm adaptations, such as variety switching and changes in sowing dates may help to ameliorate these impacts to some extent. Regardless, the large projected increases in reproductive extreme heat exposure seen here, particularly for maize and rice, may pose a risk to global food security without more transformational adaptive measures, including expansion of cropping systems to cooler locations.
Acknowledgment
This research was funded by the Rockefeller Foundation.