

Abstract
Surface improvement of implants is essential for achieving a fast osseo-integration. Technically, the creation of a precise pattern on a titanium alloy surface is challenging. Here, the femtosecond laser was chosen as an innovative technology for texturing with accuracy a nano-micro topography. By adjusting the laser parameters, three biomimetic textures were fabricated on the titanium surface: micropits with nano-ripples in the pits, micropits with nano-ripples around the pits, and a texture with only nano-ripples.
Mesenchymal stem cells (MSCs, C3H10T1/2) grown on these surfaces displayed altered morphometric parameters, and modified their focal adhesions in term of number, size, and distribution depending on surface type. These results indicate that the MSCs perceived subtle differences in topography. Dynamic analyses of early cellular events showed a higher speed of spreading on all the textured surfaces as opposed to the polished titanium.
Concerning commitment, all the laser-treated surfaces strongly inhibited the expression of adipogenic-related genes (PPARϒ2, C/EBPα) and up-regulated the expression of osteoblastic-related genes (RUNX2, osteocalcin). Interestingly, the combination of micropits to nano-ripples enhanced their osteogenic potential as seen by a twofold increase in osteocalcin mRNA. Alkaline phosphatase activity was increased on all the textured surfaces, and lipid production was down-regulated.
The functionalization of metallic surfaces by this high-resolution process will help us understand the MSCs' interactions with substrates for the development of textured implants with predictable tissue integrative properties.
Export citation and abstract BibTeX RIS
1. Introduction
Titanium and its alloys are materials of choice for dental and orthopedic implants due to their highly biocompatible nature. A modification of the implant surface, both topographically or chemically, can promote accelerated osteogenesis in vivo and greatly increase bone-implant contact and bonding strength. With the development of modern implants, the control of the surface design has become increasingly important, as it is evident that the topography alters cell behavior on the implant and plays a crucial role in the success of the osseointegration in a biological environment [1].
Presently, many reports aim to describe how surface geometry influences cell behavior, by designing controlled patterns on polymeric substrata [2]. Different approaches to fabricating topographic patterns on polymers have been proposed, such as imprinting techniques, methods based on self-assembled colloids, or lithography [3–5]. In vitro studies have established that micro- and nano-topographical patterns influence, and in many cases elicit, specific cell functions. For example, micro- or nano-grooves have been shown to control the morphology, adhesion, and migration of a large variety of cells [6–8]. Microholes have been utilized to enhance focal adhesion and actin polymerization [9], and nano-pillars have influenced the growth of mesenchymal stem cells (MSCs) and cell osteo-differentiation [10]. However, these various designs obtained by micro- and nano-fabrication techniques have mainly been explored on polymer surfaces. There is thus a lack of information concerning the influence of such designs on titanium substrates, which are of high relevance for orthopedic and dental applications. Our knowledge in the field of titanium implants is based on studies that explored the influence of surface roughness on bone cell responses [11, 12]. Among the different technologies applied to create roughness are machined surfaces, acid-etched surfaces, grit-blasted surfaces, and plasma-sprayed surfaces. These 'classical' methods produce random surface irregularities, but do not render it possible to produce structures with defined shapes and sizes, and might also contribute to consequent changes in surface chemistry.
Our preferred approach involves the functionalization of titanium surfaces by a laser technology on a rational basis of how cells respond to precise micro- or sub-micrometer features with restricted detrimental side effects. The femtosecond (FS) laser has numerous advantages over nano- or pico-second lasers, as it produces controlled features with fewer thermal effects and less collateral damage. On a titanium-alloy, this innovative technology enables the production of multiscale structuring with a defined pattern [13]. Since cell/matrix/substrate interactions associated with cell signaling occur for both micro- and nano-scale dimensions, it is of interest to evaluate the influence of a double-scale texturing of titanium-based surfaces on cell behavior. The topographies used in the present study were chosen in relation to micro- and nano-structural cues found in the in vivo extra cellular matrix environment. Here, the intention was to design multiscale features on a titanium plate, with inspiration from the scales of the biological tissue [14]. Thus, from a biomimetic point of view [15], the idea was to pattern surfaces with a hierarchical structure composed of pits at the micrometric scale and nano-scaled ripples close to collagen fibers. These ripples are a characteristic phenomenon resulting from the interaction of ultra-short pulses on a metallic surface [16].
In the current work, we have elaborated and characterized new surface morphologies. These surfaces were used in cell-culture assays with MSCs to understand how the cells can sense and respond to these biomimetic designs. The short-term events (spreading, adhesion, morphology, migration) and differentiation (osteogenesis, adipogenesis) were analyzed on three textures and compared to smooth titanium.
2. Materials and methods
2.1. Laser surface texturing
Ti squares with dimensions of 23 × 23 mm2 were prepared from 1 mm thick sheets of titanium 6-aluminium 4-vanadium alloy. The surfaces were mechanically polished until a mirror image was obtained, after which 3 different topographies were processed using a femtosecond laser. Specific laser parameters, including the mean power (P), beam diameter, fluence (F), and speed, were adapted for each topography. The laser system was a Ti : Sa laser chain (Bright Thales), which delivers 120 fs, 800 nm pulses at a repetition rate of 5 kHz. The Ti plate's position was controlled with XYZ stages connected to a computer. The laser power P was adjusted using a half wave plate and a polarizer. The beam was focused on the sample using an 88 mm f-theta lens and the displacement of the beam was ensured with a pair of galvanometric mirrors (Scanlab). That way, an arrangement of laser-induced micropits was generated following a hexagonal array on the surface of the sample with a well-controlled gap (sub-micrometric precision) between the cavities. The number of light pulses was computer-controlled for each cavity, and we refer to it as N in the following. A circular diaphragm of diameter D was positioned on the laser path in front of the focusing unit. For the surface structuration of the micropits, the parameters were D = 3 mm, N = 9 pulses, P = 35 mW (texture A), and P = 100 mW (texture B). We obtained 30 μm diameter pits (textures A and B) distributed in staggered rows with a distance of 35 μm between the centers of 2 pits (figure 1(a)). The laser parameters for the surface with nano-ripples only (texture C, figure 1(a)) were D = 5 mm, N = 2 pulses, and P = 100 mW.
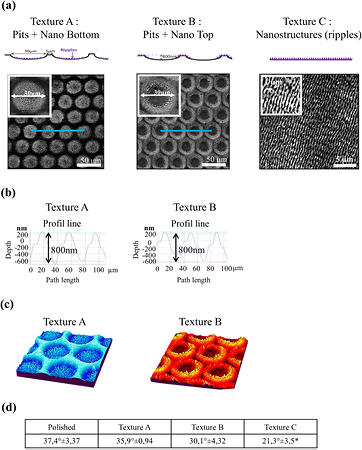
Figure 1. Topographies and wettability of surfaces processed by the femtosecond laser on a Ti4Al6V plate. (a) Schematic illustration and SEM images of the topographies. Textures A and B had pits (30 microns in diameter) and nano-ripples. Texture C had only nano-ripples. Insets: image with a higher magnification. (b) Pit depths measured along the profile line (blue line). (c) 3D reconstruction of SEM images showing the location of the nano-ripples. (d) Evaluation of the surface wettability. Contact angles was measured for distilled-deionized water droplets. The values were measured at 10 min based on the droplet profiles. n = 5 drops. Mean ± SD. * p < 0.05 versus polished.
Download figure:
Standard image High-resolution imageAccording to the type of experiment, we prepared plates of 23 mm × 23 mm that were totally textured for quantitative analyses, and multi-textured plates comprising the 3 textures (squares of 7 mm × 7 mm) as well as a polished mirror zone for imaging and video microscopy experiments. After irradiation, the titanium samples were ultrasonically cleaned in distilled water to remove metal debris and sterilized for 2 h at 180 °C for cell culture.
2.2. Surface wettability
The measurements were performed at room temperature using distilled water as the testing medium. After cleaning, the remaining water was removed and the samples were dried at room temperature overnight. Water droplets of 20 μL were deposited on the horizontal surfaces, and the evolution of the droplet shape was recorded with a microscope camera (dnt® Digimicro 2.0). The droplet profile was analyzed using the angle tool of ImageJ. It was evaluated in terms of the contact angle corresponding to the angle between the substrate surface and a tangent from the edge to the drop contour. The values presented are averages of at least five measurements at 10 min.
2.3. 3D surface measurements and scanning electron microscopy (SEM)
An optical 3D surface metrology system, InfiniteFocus (ALICONA), was used to image and measure the geometries (diameter and depth) of the micropits. SEM observations were obtained by a TESCAN VEGA3 SB scanning electron microscope at 20.0 kV. No sputter coating of the samples was required. 3D images of the micro pits were created from SEM images. Before SEM imaging, cellularized plates were immersed in 4% paraformaldehyde for 1 h and then washed with PBS. Dehydration was performed by immersing the plates in increasing concentrations of ethanol in distilled water, (60%, 70%, 80%, 90%, and 100%).
2.4. Reagents and antibodies
The fetal bovine serum (FBS) was provided by PromoCell, (Heidelberg, Germany); the rhodamine-phalloidin and bicinchoninic acid (BCA) protein assay kit were purchased from Interchim (Montluçon, France). The goat anti-rabbit Alexa Fluor 488 antibody (Molecular Probes) and PicoGreen DNA quantitation kit were obtained from Invitrogen. Unless otherwise specified, all other materials were purchased from Sigma Corp.
2.5. Cell culture
The mouse pluripotent MSCs line C3H10T1/2 (clone-8, American Type Culture Collection; LGC Promochem, Molsheim, France) was chosen to avoid donor-to-donor variation and cell population heterogeneity encountered with primary cell cultures. This cell line represents a homogeneous cell population without spontaneous differentiation under basal culture conditions and yet possesses many MSCs characteristics. Under the same inductive conditions as those applied to BM-MSCs, C3H10T1/2 cells have been found to show comparable or similar differentiation potentials, including osteogenic differentiation [17]. C3H10T1/2 cells were maintained in a standard medium: DMEM (Sigma D5796) supplemented with 10% FBS, 2 mM L-glutamine, and antibiotics (50 U ml−1 penicillin and 50 μg ml−1 streptomycin) in a humidified atmosphere of 5% CO2 at 37 °C and passaged before confluence. The cells were used between passages 13 and 16, and the plates were immersed in the culture medium for 1 h before cell seeding. The cells were seeded at a density of 4000 cells cm−2.
For the differentiation analyses, the cultures were maintained for 2 d in a standard medium, and then switched to the specific medium. For the analysis of genic expression, the cultures were grown in a mixed medium, permissive for adipogenic and osteoblastic differentiation, composed of alpha MEM supplemented with 10% FBS, 50 μg ml−1 ascorbate phosphate, 10−6 M beta-glycerophosphate, 10−8 M all-trans retinoic acid, 10−8 M dexamethasone, 5 × 10⁻⁵ M isobutyl-1-methylxanthine. For adipogenic differentiation, 10−7 M dexamethasone, 1% insulin, and 5 × 10⁻⁵ M isobutyl-1-methylxanthine were added. For osteogenic differentiation, the cultures were supplemented with 50 μg ml−1 ascorbate phosphate, 10−5 M beta-glycerophosphate, 10−8 M all-trans retinoic acid. The culture medium was changed every 2 d.
2.6. Cell immunostaining and image analysis
The cells were fixed in 4% paraformaldehyde, and permeabilized with 0.1% Triton X-100 in PBS (3 min). The cells were pre-incubated in blocking solution (PBS, 1% BSA) for 15 min, and incubated with rhodamine-conjugated phalloidin (45 min) or a vinculin antibody (2 h). After incubation, they were washed and incubated with Alexa Fluor 488 conjugated goat anti-rabbit antibody for 1 h. The nuclei were stained with 1 μg ml−1 DAPI. Fluorescence spectroscopy of the MSCs was carried out using a Leitz (Wetzlar, Germany) DMRB fluorescence microscope and the images were acquired with a Roper Scientific (Trenton, NJ) CoolSnapfx camera using the Meta Imaging series 4.6.6 software (Universal Imaging, Ypsi-lanti, MI).
For quantification, the freeware image analysis software ImageJ was used. Morphometric measurements and FA analysis of the cells were obtained by the 'analyze particle' program. The raw image was converted to an 8-bit file, and the background was removed. The image was then converted to a binary image. The shape of the cells was quantitatively described by the expression 4π (area/perimeter2), which assesses the deviation from circularity: a circle has a value of 1, the branched shape is defined as the ratio area/perimeter, and the cell elongation is expressed as the ratio of the major/minor axis.
2.7. Cell labeling with a fluorescent tracker and time-lapse observation
For real-time fluorescence visualization, cells were labeled before seeding with 1,1'-dioctadecyl-3,3,3',3'-tetramethylindocarbocynanine perchlorate (DiIC12; Molecular Probes). A cell suspension was prepared and labeled for 1 h with 0.4 μg ml−1 DilC in a standard culture medium at 37 °C. After washing, the DiI-labeled cells were seeded on the Ti plates at a density of 4000 cells cm−2. The cells were allowed to attach and spread for 30 min before the time-lapse recording was started on the microscope equipped with an incubator 5% CO2, 37 °C. (AxioObserver Z1 SIP51353). For cell adhesion, images were acquired every 3 min for 3 h. For migration analysis, images were recorded every 15 min for 12 h, beginning 7 h post seeding.
2.8. RNA extraction and RT-PCR
RNA extraction and RT-PCR were performed on C3H10T1/2 cells to analyze the cell commitment. C3H10T1/2 cells were harvested after 2 d of preculture and 12 d in a permissive medium. The cells were lysed with 600 μl of TRIzol (Ambion, TX) and stored at −80 °C. The total RNA was isolated (RNeasy Mini Kit, Qiagen, CA) and its quality and concentration were determined (NanodropND-1000, Thermo Scientific, NY). Upon reverse transcription (High Capacity RNA to cDNA kit, Applied Biosystems, CA), RT-PCR was performed (Step-One Plus, Applied Biosystems, CA) using Taqman primer probes (Applied Biosystems). The expression level was quantified with the delta-delta CT method and the results were reported and compared to polished titanium.
Complementary DNA (cDNA) was synthesized from 1.5 μg of the total RNA with the 1st strand of the cDNA Synthesis Kit for RT-PCR (AMV, Roche, Hague Road, Indianapolis). For quantitative Real Time PCR, 8 μl of a cDNA mixture diluted to 1 : 10 in water was subjected to real-time PCR using SYBR Green I dye (Lightcycler faststart DNA master SYBR green I, Roche, Penzberg, Germany). The reactions were performed in 20 μl of a PCR mixture containing 4 μl 5 × Master Mix (dNTP mixture with dUTP, MgCl2, SYBR Green I dye, Taq DNA Polymerase and reaction buffer) and 2 μl of 10 μM primers. β-actin was used as a housekeeping gene.
2.9. Alkaline phosphatase activity
The ALP activity was measured in MSCs cultured for 7 d in an osteogenic medium. The cells were harvested in a lysis buffer (Tris-NaCl-0.1% TritonX100, pH9) and sonicated. The assay consisted of hydrolyzing p-nitrophenyl, and calorimetrically determining the product (p-nitrophenol) at 405 nm. The results were expressed as absorbance values recorded per minute and they were normalized by the DNA content.
The PicoGreen DNA quantitation kit was used to measure double-stranded DNA concentrations in solution. All the reagents (dsDNA reagent, TE buffer: 200 mM Tris–HCl, 20 mM EDTA, pH7.5 and lambda DNA standard) were obtained from the kit and the assay was performed as outlined in the protocol from the manufacturer. The data were corrected for cell-free values. The samples were placed in a black 96-well plate and excited at 485 nm. The emission was measured at 538 nm using a fluorometer.
2.10. Adipogenesis
The cells were cultured in an adipogenic medium for 7 d, after which they were incubated for 10 min with Nile Red (0.25 mg ml−1), a fluorescent marker for intracellular lipid droplets. After washing, the cultures were observed under a Leitz (Wetzlar, Germany) DMRB fluorescence microscope. The images were acquired with a Roper Scientific (Trenton, NJ) CoolSnapfx camera using the Meta Imaging series 4.6.6 software (Universal Imaging, Ypsi-lanti, MI).
2.11. Statistical analysis
The data were analyzed with R software. One-way analysis of variance ANOVA followed by the Tukey post hoc test were used for statistical evaluation of the effect of the different topographies (p < 0.05). For smaller samples size (PCR data, n = 6), group comparisons were performed with Kruskal–Wallis analysis of variance. Post hoc comparisons between individual samples were performed with the Mann–Whitney test with Bonferroni correction.
3. Results
3.1. Characterization of multiscale surface topography and wettability
The processing parameters of the FS laser were adjusted to control the micro- and nano-topography, as detailed in the Materials and methods section. Three patterns were created: 2 surfaces with both micropits and nano-ripples (textures A–B), and one texture with only parallel nano-ripples (texture C). On texture C, a higher magnification of the SEM image showed periodic waves that were about 600 nm wide with directional orientation (figure 1(a)).
The 3D imaging reconstruction of SEM images illustrated the location of the nano-ripples at the bottom of the pits on texture A, and around the pits on texture B (figure 1(c)). The 3D geometry of the micropits was measured with the optical 3D surface metrology system. The micropits have an average depth of 800 nm and a diameter of 30 μm (figure 1(b)). The average depth of the nano-ripples was 200 nm (figure 1(b)).
Contact angle measurements were used to characterize the wettability of the different surfaces by following the shape of a water drop resting on a horizontal surface. On surfaces with micropits (textures A–B), the wettability was similar to the mirror-polished surface. The surface featured with ripples (texture C) was slightly more hydrophilic than the others (figure 1(d)). Because of its anisotropy, texture C guided the spreading of liquid in the direction of the nano-grooves formed by the ripples, leading to lower contact angle values in this direction. Such an orientation-dependent wettability was also observed by Cunha et al [18].
3.2. Morphology of MSCs and cytoskeletal organization
24 h after seeding the MSCs, cell spreading was achieved, and specific morphologies could be observed both by SEM and fluorescent microscopy after actin labeling. The cells were largely spread on the polished surface, whereas they looked smaller and branched on textures A and B, displaying a large polygonal morphology as compared to cells cultured on texture C, which exhibited a more elongated, spindle-like morphology (figure 2(a)).

Figure 2. Cell shape and cytoskeletal organization acquired on different textures 24 h post-seeding. (a) Representative SEM images illustrating the morphology of cells growing on the different topographies. Insets: higher magnification. (b) Morphometric parameters normalized to the polished surface. The cell areas (blue) were measured in pixel2. The elongated shape was quantified as the major axis/minor axis ratio (red) and the branched shape was quantified as the perimeter/area ratio (green). Mean ± SEM with *p < 0,05 versus polished, #p < 0,05 versus C n = 100–150 cells provided from 3 samples. (c) Actin staining of MSCs 24 h post-seeding. On the polished surfaces, actin stress fibers were sparsely arranged throughout the cell body. On texture A, the MSCs exhibited reinforced actin fibers on the top of the pits, in the smooth zones. On texture B, the actin fibers were poorly organized across the cell body. On texture C, thin cortical actin fibers were observed. Scale bar = 30 μm.
Download figure:
Standard image High-resolution imageMorphometric parameters were obtained on cells labeled with phalloidin-rhodamine (figure 2(b)). Cell area measurements indicated that the cells grown on all the textures were significantly smaller in size than their counterparts grown on polished plates. The area/ perimeter ratio was significantly decreased on all the textured materials, reflecting a more stellate cell shape. On texture C, the cells were the smallest, and the elongation factor, expressed as major axis /minor axis, was increased compared with all the other surfaces.
Cytoskeletal organization after actin labeling could be observed at a higher magnification (figure 2(c)). On the polished surfaces, actin stress fibers were sparsely arranged throughout the cell body. On texture A, actin was reinforced all around the pit periphery, underlining the design of the pits (see figure 2(c), texture A insets). On texture B, the actin fibers were thin and less abundant, substantially underlining the cell periphery and the extremities of the cytoplasmic extensions. On the nano-ripples (texture C), the network was poorly organized across the cell body and only cortical actin was reinforced. These results showed that cytoskeletal organization was influenced by the surface topography.
Measurements of the location of nuclei related to the pits on textures A and B were performed after DAPI staining. It was found that nuclei were randomly distributed, without any preference for pits (data not shown).
3.3. Focal adhesions (FA)/interactions topographies
Close examination using SEM imaging (figure 2(a)) rendered it possible to visualize the cell adhesion in relation to the nano-ripples that were differently located from the pits. On texture A, the extremity of the cytoplasmic extensions was preferentially in contact with the smooth zones separating the pits. These observations were confirmed by analyses of FAs immunostained for vinculin (figure 3(a)). On 200 analyzed FAs, a manual quantification of the FA distribution related to pattern A demonstrated that 75% of these FAs were located on the area devoid of nano-ripples. On texture B, the ends of the cytoplasmic protrusions were found to be frequently settled inside the pits (figure 3(a)).
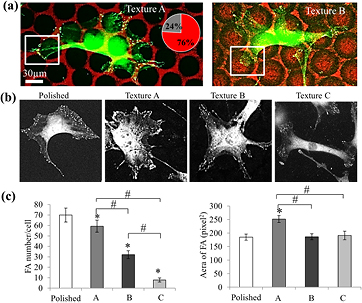
Figure 3. Cell interactions with topography 24 h post-seeding. (a) Vinculin staining in MSCs cultured on textures A and B. The distribution of focal adhesion between the smooth area (red) and rippled area (black) was measured on texture A: 76% of focal adhesions were established on smooth areas (analysis of 200 FAs). (b) Representative images of vinculin staining on the different topographies used for quantification. (c) Quantification of the number of focal adhesions per cell. Mean ± SEM *p < 0,05 versus polished, #p < 0,05 versus B or C. n = 10 cells. (d) Quantification of the area of focal adhesions. 800 FAs were measured for each topography. Mean ± SEM *p < 0,05 versus polished, #p < 0,05 versus B or C.
Download figure:
Standard image High-resolution imageA quantification of the size and number of FAs from the images after vinculin staining (figure 3(b)) exhibited significant differences: on TiL, the FAs were distributed in small patches all around the cell, whereas on the textured surfaces, the FAs were located at the edges of the extensions. On texture A, the FAs were organized in clusters: the measurement of the area of focal contacts showed a 25% increase in their size compared to all the other surfaces (figure 3(c)). A quantification of the number of FAs per cell indicated that their number decreased on all the textures compared to the control, and that the amount differed significantly between textures. On texture C, the number of FAs was significantly lower than on the other two surfaces (figure 3(c)).
3.4. Dynamic cell spreading by time-lapse microscopy
For these experiments, all the patterns were located on a single plate, allowing simultaneous time-lapse microscopy analysis, thus reducing experimental variability. In an attempt to better describe the cell behavior observed on the textured surfaces, time-lapse microscopy was performed to track cell geometry changes during early cell adhesion, between 30 min and 3h30 post seeding.
For the cell morphology, only representative images with 30 min spacing are presented. A different evolution of the cell morphology was observed during the first 3 h, depending on the substrata (figure 4(a)). On the smooth surface, the cells maintained a round shape (circularity factor = 0.55) and the cell area grew slowly (figure 4(b)). On texture A, the MSCs rapidly acquired a stellate shape. Cytoplasmic elongations were visible at 2h30, i.e. the development and retraction of cells resembling spider protrusions on smooth zones, externally to the pits. On texture B, the aspect ratio (major/minor axis) was poorly modified between 30 min and 3h30, but the cellular periphery acquired small irregularities. The circularity factor reflected this shape, with the lowest value on texture B at 2h30. On texture C, a noticeable elongation was observed as early as 2h30 with a significant increase in the aspect ratio versus the control. Moreover, the aspect ratio continued to increase over time, reaching a value 1.6-fold that of the control at 3h30.

Figure 4. Time-lapse acquisition of images during the early step of cellular adhesion. (a) A representative cell was selected for imaging. Measurements of the elongation factor and circularity were performed on 15 cells. Mean ± SEM, *p < 0,05 versus polished. A value of 1.0 indicates a perfect circle. (b) Progression of cell spreading. n = 15 Mean ± SEM, *p < 0,05 versus polished, #p < 0,05 versus C.
Download figure:
Standard image High-resolution imageThe spreading dynamic is expressed here by the delta of the area at time T with a reference area at 30 min. We considered that 30 min was necessary for the cell to attach via physical cues (figure 4(b)). Globally, the speed of early spreading adhesion was higher on the textured substrates. The presence of pits was felt by the cells: the MSCs on textures A or B with pits spread 2 times faster than their counterparts on a surface with only nano-ripples (texture C).
3.5. Cell motility on the different topographies
Seven h after seeding, the cells cultured on both plane and patterned substrates spread widely, as shown in figure 5(a). At this time, cell tracking was used to quantify the migration speed of the cells seeded on the different textured biomaterials. On texture B, the motility behavior was the same as the polished control. On textures A and C, the cells moved more rapidly (approximately 40%) than on the smooth surface. The migration was not influenced by the presence of pits, considering that the cells moved equally on textures A and C. However, the cells took into account the localization of the nano-ripples: cell migration was faster in the case where the nano-ripples were at the bottom of the pits (texture A) rather than at the pit periphery (figure 5(b)). The tortuosity, measured by the total distance/ straight distance ratio, was lower on texture C; in this case, the parallel orientation of the nano-ripples guided the cell migration (figure 5(c)).
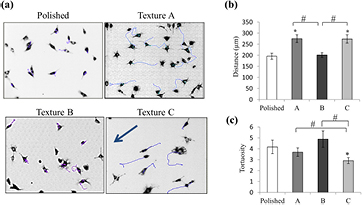
Figure 5. Cell mobility analyzed by time-lapse microscopy for 12 h. (a) Migratory paths of individual cells on the different topographies. The arrow on texture C indicates the direction of the nano-ripples. (b) Measurements of the total distance of cell migration. (c) Tortuosity of cell paths defined as the ratio of the total distance/ straight distance. Images were acquired every 15 min, beginning 7 h post-seeding. n = 40 cells. Mean ± SEM *p < 0,05 versus polished surface, #p < 0,05 versus B or C.
Download figure:
Standard image High-resolution image3.6. Influence of topographies on the fate of the MSCs
The next part of the study explored how the topographies drove the fate of the MSCs toward either osteogenesis or adipogenesis. C3H10T1⁄2 cells were grown in the different surfaces for 12 d in the presence of a permissive culture medium. To investigate the osteoblastic commitment, we examined the gene expression of RUNX2 and OCN. The key bone markers expressed at different stages of osteoblast differentiation were evaluated by qPCR analysis (figure 6(a)). The master gene RUNX2 was up-regulated for textures A and B compared to the control. An up-regulation of osteocalcin was induced by all the textured surfaces at day 12. This late osteoblastic marker increased 2-fold on texture A and B, and 1.4-fold on texture C. In addition, the ALP activity normalized by the DNA level was enhanced after 7 d of culture in an osteogenic medium in all textures (figure 7(a)).

Figure 6. Relative mRNA expression of osteoblastic (a) and adipogenic genes (b) in MSCs cultures at day 12. The mRNA levels were normalized to the expression of β-actin mRNA. The results are expressed as a percentage of the polish surface (mean ± SEM, with *p < 0,05 versus polished, #p < 0,05 versus C (n = 6).
Download figure:
Standard image High-resolution image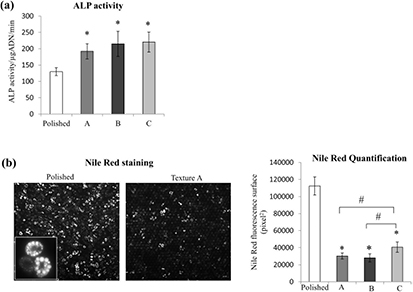
Figure 7. Characterization of osteogenesis and adipogenesis. (a) ALP activity measured on MSCs cultured in osteogenic culture medium for 7 d. (b) Nile Red staining on MSCs cultured for 7 d in an adipogenic culture medium. To the left, a representative image presenting the polished surface and the texture A. To the right: quantitative analysis for Nile Red on the different surfaces. Mean ± SEM, with *p < 0,05 versus polished, #p < 0,05 versus C; n = 25 fields of 1 mm2.
Download figure:
Standard image High-resolution image
The levels of the expression of adipogenic markers were evaluated by qPCR analysis at day 12 under a permissive culture medium (figure 6(b)). We noted that adipogenesis was equally inhibited for all the textured surfaces: approximately a decrease by half for PPARϒ2 and by more than 3 for C/EBPα. The results were confirmed by measuring the lipid accumulation in the MSC cultures grown in an adipogenic medium. Wide-field epifluorescence images after Nile Red staining demonstrated a lipidic production under all conditions at day 5 (not shown), which increased at day 7 (figure 7(b)). The amount of lipids was largely decreased on the textured surfaces compared to the smooth one. This cannot be attributed to a difference in cell number, as the numeration of nuclei at this time was the same for all the surfaces (data not shown). The down-regulation of lipid production was higher on the multi-scale textures (A and B) than on texture C (figure 7(b)).
4. Discussion
In the field of metallic implants for orthopedic and dental applications, it has been shown that surfaces with complex topographies accelerate osteoconduction [19]. At present, commercially available dental implants are classified according to roughness-based parameters only [20]. To go further, a biological approach is needed to define the importance of the geometry of the patterns at different scales intended to improve implant surface topography. In this study, we chose three organized nano- and micro-scale topographical features on a titanium alloy to analyze their potential in terms of adhesion and differentiation.
It has been described that surface texture creates instructive contexts for orienting stem cells along a specific pathway. Our results show that all the surface topographies designed on the surface of Ti6Al4V with the FS laser enhanced osteogenesis and robustly prevented adipogenesis compared to a polished surface. Since the article by McBeath et al [21], many studies have aimed at understanding the relationship between morphological cell changes and stem cell lineage commitment. In our case, the enhancement of osteogenesis directed by all the textured surfaces compared to a polished surface can be related to alterations in cell shape, focal contacts, and the cytoskeletal organization initiated during the minutes to hours following adhesion [22].
Thanks to time-lapse microscopy, we obtained information on the early events that occurred once the cell had touched the substrate. Cell spreading was faster on the three textured surfaces than on the polished one. This rapid cell adhesion on the laser-treated surfaces could influence long-term cellular events [23]. Alteration in cell spreading modified intracellular tension, which became transduced into a chemical signal inside the cell, eliciting changes in gene expression. From 2h30 post-seeding, the cells displayed a round morphology on the polished surface, whereas on the textured surfaces cytoplasmic extensions were already well developed. This finding is in agreement with other studies that have shown that for MSCs, the circular shape induces adipogenesis [24, 25], whereas less circular shapes, or star-like ones, promote osteogenesis [2, 26–28]. Lavenus et al [29] also carried out observations on titanium with different nanopore sizes, and found that the nanostructures more favorable for osteogenic differentiation (Ti30) also drove a branched shape of MSCs. In accordance with these studies, we can conclude that the rapid loss of the round cellular shape driven by all our laser-treated surfaces inhibited adipogenesis and concomitantly enhanced osteogenesis, as demonstrated by the levels of markers for each lineage.
Globally, in comparison with MSCs cultivated on the polished surface, the cell behavior had some common points on all the textures: cell adhesion was accelerated, focal contacts were less abundant, cell areas were smaller, and the cells produced cytoplasmic extensions. Finally, these behavioral modifications led to a commitment towards osteogenesis and to consistently reduced adipogenesis.
Taking into account that nano-ripples were integrated into all the textures fabricated for this study, our results suggest that they were at least partly responsible for this stimulation of the osteogenesis. These periodic nano-ripples created by the laser irradiation had a spacing of about 600 nm. It has been demonstrated that a specific size scale of linear structures promotes osteogenic differentiation. For instance, Watari et al [30] demonstrated that on polyurethane surfaces with grooves with a 400 nm pitch, MSCs had the highest expression levels of osteogenic genes relative to cells cultured on 1400 or 4000 nm pitches. Our results are in the same scale range as that reported by Watari et al [30], and the optimal scale range is close to the size of collagen fibers (~500 nm in diameter). In vivo, these fibers are exposed on any bone surface, and the resulting surface morphology likely provides osteogenic signaling to attached cells.
Not only the size but also the pattern of the nano-ripples seems to play a role in cellular responses. As described in our previous study, the MSCs integrated the two types of information provided by, on the one hand, micrometric grooves, and on the other hand submicro-metric ripples, by modulating their alignment as a function of the orientations of the grooves and/or the ripples [13]. In our engineered topographies, the nano-ripples were distributed differently, inside or outside the pits or in parallel arrays. The MSCs were thus able to identify the differences in the organization of the nano-ripples. We showed that the focal adhesion was modulated by the textures. The number of FAs decreased for both textures A and B, and was the smallest for texture C. In accordance with our results, McNamara et al [31] observed that MSCs grown on titanium nano-pillars demonstrated a reduced number of focal adhesions per cell in comparison with the planar substrate. Concerning the size of the focal adhesions, it was maintained or increased on our textured surfaces. On texture A, the FAs were settled on the smooth areas around the pits. Our results suggested that the presence of nano-ripples on texture A drove the FAs to the non-textured areas and promoted large clusterings of FA proteins, which caused an increase in their size. It is not easy to establish a relationship between FA size and signaling for cell osteo-differentiation. Some studies have correlated adhesion size with osteoblast gene expression [32–34], whereas other studies suggest that the actual size or maturity of the FAs is not the governing factor [35]. For example, osteoblasts cultured on SLA (a blasted and etched titanium surface, which is therefore rough, showed a significant reduction in adhesion number and size compared with control cells on smooth titanium surfaces but showed faster/or increased differentiation) [36]. Besides their role in cellular adhesion, focal adhesions are constantly assembling and disassembling to enable motility and cellular migration [37]. Interestingly enough, cell tracking reported evidence that MSCs are more mobile on texture A than on texture B. On texture A, we noticed that the cells preferentially migrated along the path devoid of nano-ripples situated between the pits. Moreover, we also observed that the actin fibers were reinforced in these zones underlining the pits. Thus, the cell motility on smooth areas was promoted by actin reorganization of the fibers around the pits observed on texture A but not on texture B. This is supported by previous studies having reported how the organization of the actin cytoskeleton provides fibroblastic cells with the capacity to orient and migrate through micron-sized patterns [38, 39].
The nano-ripples represent only one of the parameters designing texture at the nano-metric scale, but their combination with larger patterns (pits) must be examined. It is known that complex topographies at the surface of implants are required for long-term stability [40]. Structures, with length scales ranging from the micro-scale to the nano-scale, have the potential to mimic the micro-environment of in vivo cells and thus elicit additional biological effects on stem cells [41]. Our results showed that the behavior of MSCs on surfaces with multiscale textures (A and B) was distinguishable from that on solely nano-ripples textured surfaces (texture C): all designs favored osteogenesis, but textures A and B were more efficient with regard to the enhancement of osteocalcin and RUNX2 expression. These results have let us gain insight into the advantage of creating substrate topographies at both micro- and submicro-metric scales. In accordance with our results, others have shown that a titanium surface with hierarchical levels of roughness improves osteoblast adhesion and differentiation of MG63 [42], or differentiation of rat bone marrow cells [43]. These kinds of features are usually obtained by combinations of treatments, for example substractive techniques such as grit-blasting followed by acid-etching or anodization (SLA), which is now described as a method for texturing dental implants [44]. In our study, the micron and submicron features were within the same scale of SLA as that reported in Wieland's [45] study (wide pores 20–50 μm, and micropits 0.5–2 μm in diameter). However, in our case, the features were created with a precise geometry allowing additional information about the respective role of each scale.
Studies have reported that the depth of the micropits can influence cellular responses. For example, on polymeric substrates, Seo et al [46] showed that by increasing the depth by 1 μm (from 1 μm to 2 μm), the location of the vinculin switched from the top to the bottom area. On metallic surfaces, it is not easy to control the depth of the pattern created by classical methods. In contrast, with a technology such as an FS laser, one simply needs to adjust the number of laser pulses in order to control the depth of the pits. A depth of 800 nm was chosen in this study, but our texturing method can make it possible to modulate this depth and then investigate the influence of this parameter on the cell responses.
Actually, all the laser parameters (fluence, number of pulses, laser beam polarization, wavelength, incident angle, scan velocity) can be easily adjusted. It is thus possible to create geometric patterns by gradually modifying the dimensions with control at the submicron scale. Fabricating highly regulated and reproducible defined features on a titanium surface will help to gain more accurate control of cell responses. It is interesting to note that an FS laser produces a size of nano-ripples on titanium surfaces close to that of collagen fibers. We have seen that these biomimetic nanofeatures promote osteoblastic differentiation and, consequently, offer the possibility to improve the osseointegration of titanium implants. Moreover, the FS laser has the advantage of being applicable to the surfaces of any 3D object such as a dental implant. It can create the desired micro- and nano-structures in a single machining step without contact, thereby preventing contamination.
The challenge is to find the optimal design. Before texturing an implant with a laser, additional data are necessary to understand how the topography dictates the cell fate. As biological experiments demand a lot of identical samples, an idea would be to use the laser-treated titanium surfaces as masters for polymer replicas. This combination of technologies would be interesting as a low-cost, high-efficiency process for the reproduction of a large number of replicas.
5. Conclusion
In summary, the three surfaces textured by FS laser have proved their ability to increase osteogenesis and inhibit the adipogenesis of MSCs. The nano-ripples alone favored the osteoblastic commitment. Moreover, the combination of micro patterns (pits) with these nano-ripples enhanced the osteogenic potential. These results highlight the potential of the FS laser technology for the functionalization of metallic implant surfaces. The dynamic observation of cell behavior was useful to accurately analyze the cell adhesion and showed that MSCs finely perceived the differences in the patterns.
The flexibility of this laser technique, producing surfaces with controlled features at the micro/nanometer scale, would allow further elucidation of the pathways through which adhesion and cytoskeletal changes regulate gene expression in MSCs. This technology can help us understand the biological interactions with substrates in order to develop new implant surfaces with predictable tissue integrative properties.
Acknowledgments
The authors acknowledge the financial support from Saint Etienne Metropole. The authors thank french ANR for the Equipex MANUTECH-USD support (Investissements d'Avenir ANR-10-EQPX-36-01).