

Abstract
Objective. The aim of this study was to determine the test-retest reliability of muscle fiber conduction velocity (CV) and fractal dimension (FD) obtained from multichannel surface electromyographic (sEMG) recordings.
Approach. Forty healthy recreationally active subjects (20 men and 20 women) performed two elbow flexions on two trials with a 1 week interval. The first was a 20% maximal voluntary contraction (MVC) of 120 s, and the second at 60% MVC held until exhaustion. sEMG signals were detected from the biceps brachii, using bi-dimensional arrays.
Main results. Initial values and slope of CV and FD were used for the reliability analysis. The intraclass correlation coefficient (ICC) values for the isometric contraction at 20% MVC were (−0.09) and 0.67 for CV and FD respectively; whereas the ICC values at 60% MVC were 0.78 and 0.82 for CV and FD respectively. The Bland Altman plots for the two isometric contractions showed a mean difference close to zero, with no evident outliers between the repeated measurements: at 20% MVC 0.001 53 for FD and −0.0277 for CV, and at 60% MVC 0.006 66 for FD and 0.009 07 for CV.
Significance. Overall, our findings suggest that during isometric fatiguing contractions, CV and FD slopes are reliable variables, with potential application in clinical populations.
Export citation and abstract BibTeX RIS
Abbreviations
| EMG | Electromyography |
| IED | Inter-electrode distance |
| MVC | Maximal voluntary contraction |
| ICC | Intraclass correlation coefficient |
| SEM | Standard error of measurement |
| MDC | Minimal detectable change |
| CV | Conduction velocity |
| FD | Fractal dimension |
Introduction
Muscle fatigue is the inability to maintain a required or expected force or power output under maximal or submaximal sustained contraction conditions, i.e. the time to task failure or muscle endurance (Vøllestad 1997). Albeit skeletal muscle manifests fatigue during a sustained task, the origin of fatigue is not exclusively muscular. Indeed, muscle fatigue develops in different parts of the body and can be academically divided into its central and peripheral component, according to neural and muscular origins respectively (Bigland-Ritchie et al 1978). Moreover, muscle fatigue consists of mechanical and myoelectric phenomena, the latter ones preceding the former. Consequently, the assessment of mechanical and myoelectric manifestations of fatigue requires respectively the definition of indices based on mechanical variables (such as force or torque), and indices associated to the surface electromyographic (sEMG) signal, or electrical stimulation during maximal voluntary contraction (MVC), a technique also known as the twitch interpolation (Merton 1954, Bigland-Ritchie et al 1983, Kent-Braun and Le Blanc 1996, Place et al 2007). sEMG reflects both central and peripheral neuromuscular properties, since its main characteristics, amplitude and power spectrum, depend on muscle fiber membrane properties and on the timing of motor unit (MU) action potentials (Farina et al 2004). Previous studies have shown that the sEMG changes characteristically with fatigue and it is possible to assess the progress of fatigue by analyzing myoelectric variables (Merletti and Parker 2004). In particular, during isometric constant force contractions, myoelectric manifestations of fatigue are mainly caused by three physiological factors: (1) a decay in muscle fibers conduction velocity (CV) (Buchthal et al 1955, Stalberg 1966), mainly related to a decrease of the intracellular pH (Komi and Tesch 1979, Bouissou et al 1989, Brody et al 1991); (2) an increase of the level of MUs synchronization by the central nervous system (Merletti et al 1990) and (3) a reduction of the recruitment threshold of MUs (Adam and De Luca 2003). MU synchronization is a phenomenon described as a higher occurrence of nearly simultaneous discharge of different MU action potentials (MUAPs) than expected by chance.
Therefore, the estimation of CV slope (i.e. rate of change), might be useful to characterize the peripheral components of muscle fatigue (during an isometric task) (Merletti and Farina 2016) and this variable may be considered as one of the most robust EMG fatigue indices (Linssen et al 1993, Bilodeau et al 1994, Ng and Richardson 1996, Kollmitzer et al 1999, Dedering et al 2000, Rainoldi et al 2001). Furthermore, if the MU pool is stable, this variable correlates with fiber size and type (Sadoyama et al 1988).
However, because MU synchronization is linked to the central nervous system, its study may provide an insight into functional neurophysiological aspects during voluntary tasks and pathological conditions. The most commonly used technique to quantify MU synchronization is needle (or fine wire) EMG combined to cross-correlation analysis of single MUAPs pairs (Nordstrom et al 1992). However, only a very small MU population of the active muscle is typically examined when estimating MU synchronization by needle EMG. The representativeness of this small population and the physiological implications of the results have thus been questioned (Karlsson et al 2009).
More representative indices to quantify MU synchronization from a larger population of active MUs have been proposed using sEMG (e.g. spike shape analysis (Gabriel et al 2007), full-wave rectification and frequency domain analysis (Halliday et al 1999), etc). Although these methods have demonstrated sensitivity to MU synchronization, they are highly dependent on CV and this is a major limitation since MU synchronization level and CV often change in parallel (Arendt-Nielsen et al 1989). Recently Mesin and colleagues (2009) proposed a new index to monitor levels of synchronization in response to fatigue, least affected by CV changes and based on the quantification of the signal's geometrical complexity, defined as fractal dimension (FD).
The fractal's theory refers to the discovery of Benoit Mandelbrot (1982): 'an object or a signal which can be split into parts, each of which is a reduced-size copy of the whole, might be defined as fractal and this property is called self-similarity'. The sEMG signal itself, which originates from a strong non-linear combination of similar templates (i.e. action potentials of different MUs), has self-similarity properties, and therefore fractal analysis seems appropriate (Anmuth et al 1994). Several studies (Anmuth et al 1994, Gitter and Czerniecki 1995, Gupta 1997, Xu and Xiao 1997, Shields 2006) have directly applied geometrical and box-counting methods on the EMG signal interference pattern to acquire an estimate of the FD, which is a measure of self-similarity and geometrical complexity of the signal. FD gives a quantitative indication of the chaotic behavior of a signal, and is also related to the degree of interference of the signal, which is inversely related to the 'smoothness' of a signal (Mesin et al 2009).
FD was initially used to characterize levels of muscle activation (Anmuth et al 1994, Gupta et al 1997, Talebinejad et al 2009) and patterns of MU recruitment (Xu and Xiao 1997). Later Mesin et al (2009) suggested that FD could also be related to increases in MU synchronization during muscle fatigue. However, although the use of nonlinear analysis of the sEMG signal is desirable, as more sensitive than spectral analysis for the assessment of muscle fatigue (Farina et al 2002), it is difficult to relate these parameters to physiological changes in muscle properties resulting from muscle fatigue (for an exhaustive and comprehensive review, see Gonzalez-Izal et al 2012). In 2009 Mesin and colleagues compared FD to other linear and non-linear muscle fatigue indices' computed from both synthetic and experimental sEMG signals: they found that FD was the parameter least affected by CV changes, weakly affected by fat layer thickness and mostly related to the level of MU synchronization, which suggested its possible use as index of central components of muscle fatigue.
We recently reported on the decay of FD during sustained isometric contractions of the quadriceps muscle, and this change may be considered as an indicator of progressive MU synchronization (Beretta-Piccoli et al 2015, Boccia et al 2016a), as suggested by previously published studies (Troiano et al 2008, Mesin et al 2009).
Assessment of the reliability of fatigue indexes is of considerable relevance for research and clinical use of sEMG. Research findings on the test-retest reliability of muscle fiber CV are rather consisting. It has been reported that the reproducibility of CV estimates, as assessed by the intra-class correlation coefficient (ICC), is rather poor (Rainoldi et al 2001), even in muscles with fibers that run parallel to the skin, such as the biceps brachii (Rainoldi et al 1999), probably due to the estimation method adopted. Farina and colleagues (2004) reported that an ICC may increase with increasing number of recording channels (from 2 to 7) and distance between detection points (from 2 to 10 mm). Moreover, in general, CV slopes were not as reproducible as initial values, reflecting their high sensitivity to electrode displacement during test-retest sessions. However, since CV is a direct physiological parameter, its use is to be preferred over mean (MNF) or median spectral frequency (MDF), when computed with a multi-channel approach (Farina and Merletti 2004).
Studies on FD of sEMG reliability are currently lacking. Therefore, the aim of this study was to investigate the test-retest reliability of muscle fiber CV and FD during sustained isometric contractions of the biceps brachii muscle in a population of healthy subjects.
Methods
Subjects
The study was approved by the local ethics committee of the Swiss Italian Health and Sociality Department, Switzerland. All procedures were conducted according to the Declaration of Helsinki. All participants signed a written informed consent form before participation in the experiments. Forty healthy recreationally active volunteers (20 women and 20 men) aged between 20 and 33 years from a university setting were recruited to participate in the study.
Experimental procedure
The subjects participated in two experimental sessions ('trial 1' and 'trial 2'), a week apart at the same time and under the same environmental conditions. Measurements were performed on the two arms randomly within each session.
Subjects were seated in a height-adjustable chair with their arm positioned on an isometric ergometer (MUC1, OTBioelettronica, Turin, Italy), equipped with a load cell (Model TF022, CCT Transducers, Turin, Italy). In order to isolate the action of the biceps brachii, the wrist was fastened to the ergometer, with the elbow at 120°, as shown in figure 1.
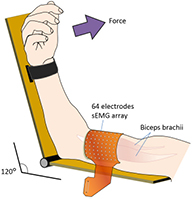
Figure 1. Electrode arrays positions on biceps brachii muscle. Myoelectric signals were detected in single differential configuration, using bidimensional arrays of 64 electrodes (3 mm diameter, 8 × 8 grid, 10 mm interelectrode distance), positioned along the length of the muscle, between the distal tendon and the innervation zone.
Download figure:
Standard image High-resolution imageInitially, two isometric MVCs of 2–3 s were performed, separated by 2 min rest. During each contraction, the force trace was displayed to participants on a computer monitor as visual feedback. Participants were instructed to increase the force up to their maximum, and to hold it as steady as possible. Participants were given verbal encouragement.
Next, after 2 min rest, a low-level contraction (20% MVC) was performed for 120 s, after which the subjects were asked to provide a value of the perceived exertion on a visual Borg scale, ranging from 6 to 20 (Borg 1982). After 5 min rest, the subjects were asked to perform a higher level contraction (60% MVC) to be maintained until exhaustion. During the contraction subjects were verbally encouraged to keep the force level for as long as possible, until the force value decreased below 90% of the target (endurance time, i.e. the time for which a subject is able to maintain the requested mechanical task (Merletti and Roy 1996)).
EMG and force measurements
Myoelectric signals were detected from the biceps brachii, in a monopolar configuration using a bidimensional array of 64 electrodes (3 mm diameter, 8 × 8 grid, 10 mm interelectrode distance (IED); model ELSCH064NM3; OT Bioelettronica) (figure 1). This muscle was chosen in order to obtain high-quality sEMG signals according to the qualitative criteria described in Beretta-Piccoli et al (2014). The electrode grid was applied on the muscle belly, with its distal edge close to the cubital fossa and the midline of the array aligned with the midline of biceps along a line from the cubital fossa to the acromion (see figure 1). A ground electrode was placed on the contralateral wrist. The EMG signals were amplified (EMG-USB2; OT Bioelettronica), band-pass filtered (10–750 Hz), sampled at 2048 Hz, and stored on a computer.
The isometric ergometer was used to measure elbow torque with a torque meter operating linearly in the range 0–1000 Nm. The torque signal was amplified (MISO II; OT Bioelettronica) and stored on a computer with the sEMG data. The torque signal was displayed on a screen, providing real-time biofeedback
Signal processing
The number of channels used for CV estimation was selected based on visual inspection, which comprised five steps:
- (1)Identification of movement artifacts or missing channels: signals with large amplitude changes due to movement were removed from the analysis.
- (2)Identification of power line interference: signals which presented large sinusoidal components at 50 Hz or their harmonics, were removed from the analysis.
- (3)Manual identification of the main innervation zone (if present under the array) and of the distal tendons (through observation of propagating waves and inversion of MUAP shapes).
- (4)Selection of the array column where the maximal amplitude and largest MUAPs were visible.
- (5)Selection of the channels between the innervation zone and the distal tendons, where the MUAPs appear similar in shape and shifted in time.
The number of channels chosen to estimate CV was between 4 and 7, i.e. the maximal number of channels between the main IZ and the distal tendon. The minimal number of channels was set to 4 according to a previously published study on the reproducibility of CV estimation using multichannel sEMG (Farina et al 2004).
The FD was computed on each of the signals selected for CV computation and then averaged; thus, for each signal epoch, one value of CV and one value of FD were obtained.
FD was estimated using the box-counting method, as previously reported (Gitter and Czerniecki 1995). Briefly, a grid of square boxes is used to cover the signal, and the number of boxes that the sEMG waveform passes through is counted. When the box size decreases, the number of the boxes that are counted will increase exponentially. The range of box size is restricted in order to avoid saturation for high and low value of size (Gitter and Czerniecki 1995). The box size was fixed to 13 steps equally spaced in logarithmic scale, with the smallest box equal to 1/128th of a second and the largest box equal to 1/8th of a second. The vertical side of the boxes was normalized to the range of the signal during epochs of 1 s and divided in the same number of boxes.
However, by plotting the logarithm of the number of boxes required to cover the signal versus the logarithm of the inverse of the box area, the exponential relationship becomes approximately linear. The slope of the interpolation line (estimated using the least mean squared procedure) is the fractal dimension (FD) (Mesin et al 2009). Therefore, the following expression defines the FD:

where N is the number of boxes required to cover the signal and L is the box side, with the ratio indicating the slope of the interpolation line.
Eventually, CV was estimated using a multichannel algorithm (Farina and Merletti 2003) on single differential signals, based on the matching between signals filtered in the temporal and in the spatial domains, using non-overlapping signal epochs of 1 s. CV values outside the physiological range (3–8 m s−1) were excluded from the analysis.
Data were analyzed by a custom-written software in MATLAB R2014b (Mathworks, Natick, USA)
Linear regression over time was applied to FD and CV in order to extract an initial value and slope.
Statistical analysis
Statistical tests were conducted for FD and muscle fiber CV initial values and slopes, considering the data from left and right biceps brachii as a single set. A Shapiro-Wilk test revealed that all these variables were normally distributed. Data are reported as means ± standard deviation (SD) within the text and tables.
Test-retest reliability of the variables was examined using the intraclass correlation coefficient (ICC(2,1)) (Weir 2005) and the Bland–Altman plot (Bland and Altman 1986) since their use has been recommended in reliability studies (Rankin and Stokes 1998, Bruton et al 2000, Weir 2005). The criteria used for the interpretation of the ICCs were as follows: 0.00–0.25: no correlation; 0.26–0.49: low correlation; 0.50–0.69: moderate correlation; 0.70–0.89: high correlation; 0.90–1.00: very high correlation (Munro 2005). Bland–Altman plots were provided to give a visual representation of the size and range of differences between two consecutives measurements from the same subjects (i.e. limits of agreement: average differences ± 1.96* standard deviation of the difference). The standard error of measurement (SEM), defined as the amount of error that might be considered as a measurement error, was calculated using the following equation (Stratford and Goldsmith 1997):

where  represents the total variance and
  the ICC.
Moreover the minimal detectable change (MDC95) for the ICC(2,1) was also calculated to provide an estimate of the true change for each variable for a participant using the following equation (Weir 2005):

The MDC95 is the minimum amount of change in subject's variables that ensures the change is not the results of measurement error: therefore, values greater than the MDC95 represent true change.
Statistical analyses were performed using SPSS Version 22.0 (SPSS Inc, Chicago, IL, USA), and significance was set to α = 0.05.
Results
Table 1 shows mean values and standard deviations for CV and FD initial values and rate of change during the contractions. At 20% MVC contraction, the lack of CV and FD change over time was paralleled by an average Borg scale score of 10.7 ± 1.8, indicating a fairly light perceived fatigue.
Table 1. Initial values and normalized slopes of CV and FD at 20 and 60% MVC, during trial 1 and 2. Values are indicated as mean ± SD.
| Trial 1 | Trial 2 | |||
|---|---|---|---|---|
| Conduction velocity (CV) | Initial (m s−1) | 20% MVC | 4.53 ± 0.70 | 4.48 ± 0.69 |
| 60% MVC | 4.94 ± 0.77 | 4.97 ± 0.86 | ||
| Slope (% s−1) | 20% MVC | −0.042 ± 0.056 | −0.040 ± 0.060 | |
| 60% MVC | −0.71 ± 0.40 | −0.72 ± 0.31 | ||
| Fractal dimension (FD) | Initial | 20% MVC | 1.59 ± 0.028 | 1.59 ± 0.026 |
| 60% MVC | 1.61 ± 0.035 | 1.61 ± 0.030 | ||
| Slope (% s−1) | 20% MVC | −0.012 ± 0.011 | −0.013 ± 0.011 | |
| 60% MVC | −0.17 ± 0.089 | −0.18 ± 0.082 | ||
Time courses of CV and FD during 20% and 60% MVC, assessed during trial 1 and 2 are shown in figure 2 for one representative subject. Negative slopes for CV and FD were observed only during the sustained 60% MVC, indicating that this level of contraction was fatiguing.
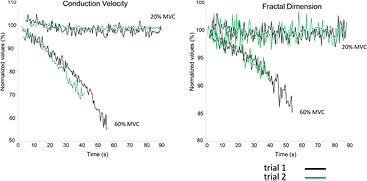
Figure 2. Time course of muscle fiber conduction velocity (CV) and fractal dimension (FD) for a representative subject. Surface EMG signals were detected from the biceps brachii using bi-dimensional arrays during isometric contractions at 20% and 60% MVC. CV and FD were computed for the selected channels in epochs of 1 s, where pure propagation of the MUAPs was visible. Trial 1 and trial 2 measurements are depicted respectively in black and in green. Data are normalized with respect to their initial values.
Download figure:
Standard image High-resolution imageTable 2 documents the results of ICC(2,1), SEM and MDC95 for the initial value and slope of muscle fiber CV and FD, for both the 20% and the 60% MVC isometric contractions. According to the classification of Munro (2005), very high levels of test-retest reliability were identified for the initial values of FD at 20 and 60% MVC (ICC = 0.91 and 0.95 respectively), whereas slopes of FD during the two levels of contraction showed moderate to high test-retest reliability (ICC = 0.67 and 0.82 respectively).
Table 2. Results of the test-retest reliability analysis of initial values and normalized slopes of CV and FD at 20 and 60% MVC.
| ICC | 95% CI | SEM | MDC95 | |||
|---|---|---|---|---|---|---|
| Conduction velocity (CV) | Initial (m s−1) | 20% MVC | 0.70 | 0.53–0.81 | 0.045 | 0.124 |
| 60% MVC | 0.68 | 0.50–0.80 | 0.051 | 0.141 | ||
| Slope (% s−1) | 20% MVC | −0.09 | −0.72 to 0.31 | 0.009 | 0.025 | |
| 60% MVC | 0.78 | 0.65–0.86 | 0.022 | 0.060 | ||
| Fractal dimension (FD) | Initial | 20% MVC | 0.91 | 0.87–0.95 | 0.0009 | 0.003 |
| 60% MVC | 0.95 | 0.92–0.97 | 0.0009 | 0.002 | ||
| Slope (% s−1) | 20% MVC | 0.67 | 0.49–0.79 | 0.0007 | 0.002 | |
| 60% MVC | 0.82 | 0.73–0.89 | 0.004 | 0.012 | ||
Note: ICC, intra-class coefficient; CI, confidence interval; SEM, standard error of measurement; MDC, minimal detectable change; MVC, maximal voluntary contraction.
High levels of test-retest reliability were also found for initial values and slopes of CV, respectively during the low level and the endurance contractions (ICC = 0.70 and 0.78). On the contrary, the ICC value of CV slope during the 20% MVC contraction was negative, showing dependence on days and trials larger than dependence on subjects (Rainoldi et al 2001, Farina et al 2004).
SEM values were respectively low, for CV and FD initial values and slopes.
MDC95 values for all the variables, except CV slope during the 20% MVC, were low, in the range 0.002–0.141. Bland & Altman plots are shown in figures 3 and 4.
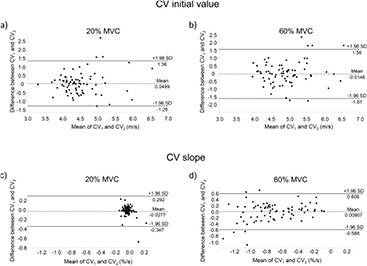
Figure 3. Bland–Altman plots for conduction velocity (CV) initial values and slopes during 20% and 60% MVC isometric contractions. The difference between CV initial values (a) and (b) and slopes (c) and (d) during trial 1 (CV1) and trial 2 (CV2), is plotted against their mean values. Mean difference values and the 95% limits of agreement are reported.
Download figure:
Standard image High-resolution image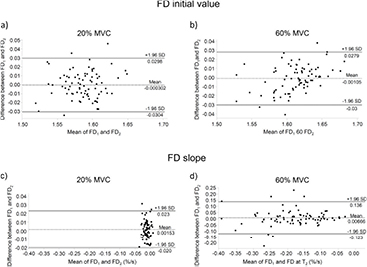
Figure 4. Bland–Altman plots for fractal dimension (FD) initial values and slopes during 20% and 60% MVC isometric contractions. The difference between FD initial values (a) and (b) and slopes (c) and (d) during trial 1 (FD1) and trial 2 (FD2), is plotted against their mean values. Mean difference values and the 95% limits of agreement are reported.
Download figure:
Standard image High-resolution image
Discussion
Test-retest reliability of conduction velocity (CV) and fractal dimension (FD), selected respectively as promising indicators of peripheral and central components of myoelectric manifestations of fatigue (Mesin et al 2009), is currently unknown. Therefore, we measured CV and FD test-retest reliability during low (20% MVC) and high (60% MVC) level isometric contractions of biceps brachii in healthy subjects. To our knowledge this is the first study which reports the test-retest reliability of FD of EMG during isometric contractions.
Test-retest reliability of CV
The issue of reliability of CV initial values and slope is a complex issue that has been addressed by several studies in the past. Farina et al (2004) suggested that there are at least three factors affecting CV reproducibility: (1) variance of estimation of CV intrinsic in the method, (2) electrode repositioning and (3) variability intrinsic in the subjects' performance and modality in muscle control. To reduce the impact of factors (1) and (2), we used bi-dimensional arrays with 10 mm IED, in order to have larger number of electrodes, optimal distance between detection points and lower sensitivity to electrode displacements, thus reducing the experimental noise.
Initial values of CV showed high to moderate relative test-retest reliability during the low and high level contractions (table 2), and the same behavior emerged from the absolute test-retest reliability analysis depicted by the Bland & Altman plot (figures 3(a) and (b)) and by the low values of SEM (0.045–0.051 m s−1), which indicates the expected trial-to-trial noise. Therefore, initial value of CV, estimated with multichannel sEMG, is a reproducible variable, suitable for example to characterize MU types constituency of muscles (Sadoyama et al 1988, Farina et al 2004), for differentiating pathological conditions (e.g. Klaver-Król et al 2012, Butugan et al 2014, Boccia et al 2016b) or to highlight fiber size differences (Blijham et al 2006).
Despite these considerations, a negative ICC of CV slope was found at 20% MVC (table 2), indicating a very low inter-subject variability. Given the fact that CV slopes are indicative of the development of peripheral muscle fatigue (Merletti and Parker 2004), and that at 20% MVC, as previously reported (Beretta-Piccoli et al 2015), peripheral fatigue is almost absent across the subjects, the inter-subject variance will be very low, so that the relative test-retest reliability expressed through the ICC may become negative. Moreover, the values distribution in the Bland & Altman plot (figure 3(c)) results in a very narrow cloud around zero, with many values overlapped, thus confirming a low inter-subject variability. Additionally, MDC95, which provides an estimate of the magnitude of change on CV slope and, therefore, accounts for measurement error and variability (Weir 2005), and SEM are both very low, respectively 0.025 and 0.009% s−1, thus supporting the fact that the low test-retest reliability is not due to a measurement issue.
On the contrary, the fact that the 60% MVC contraction was much more fatiguing (CV slope was negative), likely lead to a higher inter-subject variability, as depicted in the Bland & Altman plot (figure 3(d)), together with a slight increase of SEM and MDC95.
In literature there are few studies addressing the issue of CV slope test-retest reliability during isometric contractions at 50 or 60% MVC, using the ICC (Rainoldi et al 1999, Rainoldi et al 2001, Falla et al 2002, Farina et al 2004, Ollivier et al 2005) and their conclusions are rather consistent indicating that ICC ranges from low to moderate. In most of these investigations, a four-electrodes system to estimate CV (with an IED of 5 mm) was used: the sensitivity to electrode location, was identified as the main factor limiting test-retest reliability. In fact, electrode repositioning between sessions produced high levels of experimental noise. Our results confirm what Farina et al (2004) suggested, namely that increasing the number of channels (and IED to 10 mm) would have resulted in higher ICC.
Test-retest reliability of FD
Initial value of FD has been found as the most repeatable parameter, with ICC values ranging from 0.91 (20% MVC) to 0.95 (60% MVC): this result can be partly explained by the very strong inter-subject variability (figures 4(a) and (b)). Nevertheless, the trial-to-trial variability expressed by the SEM was very small (9 × 10⁻⁴), as also the MDC95 (range 0.002–0.003) for both contraction levels (table 2). These findings suggest that initial value of FD is a reproducible variable which may be suitable in a clinical setting to estimate initial levels of MU synchronization in the biceps brachii.
Despite the very high relative test-retest reliability found for FD initial values during the 20% MVC, the rate of change of FD showed only a moderate inter-subject variability (ICC = 0.67). This behavior may be explained by the fact that during a low level isometric contraction at 20% MVC the level of synchronization remains almost constant, just as with the muscle fiber CV (Beretta-Piccoli et al 2015). Two other studies conducted at an intensity of 20% (Contessa et al 2009) and 10% MVC (Semmler et al 2000) did not report an increase in MU synchronization during the time course of the contraction.
Moreover, just like CV slope at 20% MVC (figure 3(c)), the Bland & Altman plot of FD slope (figure 4(c)) resulted in a narrow value distribution, which suggests low inter-subject variability. Additionally, MDC95, which estimates the smallest amount of change that can be detected by the measure, and SEM, which estimates the response stability, are both very low, respectively 0.001 and 0.002% s−1, thus supporting the fact that the low test-retest reliability is probably not due to a measurement issue. Subsequently due to the fact that the 60% MVC contraction was fatiguing, as highlighted by a much more negative FD slope (which is an indicator of an increased MU synchronization (Beretta-Piccoli et al 2015, Boccia et al 2016a)), the relative test-retest reliability was higher (ICC = 0.82) with respect to the 20% MVC contraction. Very low values of SEM (0.004) and MDC95 (0.012% s−1), supported by high inter-subject variability as showed in the Bland & Altman plot (figure 4(d)) suggest that FD rate of change during fatiguing contractions is a reliable measure of MU synchronization in biceps brachii.
Attention should be paid when assessing other muscles, as subject-dependent factors (e.g. fat layers and skin properties) may influence the FD of the signal but not the rate of change of FD (Mesin et al 2009). As a result, single values of the FD will not necessarily reflect the actual MU synchronization level; nevertheless, FD slope provides a reliable estimate of the actual change in MU synchronization level.
Limits
The limitations of this study are mainly related to technical constraints. Firstly, we investigated only one muscle, which, of course, does not represent the behavior of all the muscles. Secondly, to our knowledge, literature is currently lacking studies on validity of FD in estimating MU synchronization. If future studies will overcome this gap, FD will provide a valid and robust measure of MU synchronization during fatiguing contractions.
Conclusion
In summary, the results indicate that during an isometric fatiguing contraction, CV and FD rates of change, measured by multichannel EMG, are highly reliable variables, which may be useful in clinical populations to evaluate peripheral and central contributions to muscle fatigue.
Acknowledgments
This study was supported by the Thim van der Laan Foundation, Switzerland (to MBP, CC, RC and MB) and Association Française Myopathies, Paris, France (grant 17191 to GD).
Conflict of interest
The Authors declare that there is no conflict of interest.