

Abstract
A major source of error in quantitative PET/CT scans of lung cancer tumors is respiratory motion. Regarding the variability of PET texture features (TF), the impact of respiratory motion has not been properly studied with experimental phantoms. The primary aim of this work was to evaluate the current use of PET texture analysis for heterogeneity characterization in lesions affected by respiratory motion. Twenty-eight heterogeneous lesions were simulated by a mixture of alginate and 18F-fluoro-2-deoxy-D-glucose (FDG). Sixteen respiratory patterns were applied. Firstly, the TF response for different heterogeneous phantoms and its robustness with respect to the segmentation method were calculated. Secondly, the variability for TF derived from PET image with (gated, G-) and without (ungated, U-) motion compensation was analyzed. Finally, TF complementarity was assessed. In the comparison of TF derived from the ideal contour with respect to TF derived from 40%-threshold and adaptive-threshold PET contours, 7/8 TF showed strong linear correlation (LC) (p < 0.001, r > 0.75), despite a significant volume underestimation. Independence of lesion movement (LC in 100% of the combined pairs of movements, p < 0.05) was obtained for 1/8 TF with U-image (width of the volume-activity histogram, WH) and 4/8 TF with G-image (WH and energy (ENG), local-homogeneity (LH) and entropy (ENT), derived from the co-ocurrence matrix). Their variability in terms of the coefficient of variance ( ) resulted in
  (WH) = 0.18 on the U-image and
  (WH) = 0.24,
  (ENG) = 0.15,
  (LH) = 0.07 and
  (ENT) = 0.06 on the G-image. Apart from WH (r > 0.9, p < 0.001), not one of these TF has shown LC with Cmax. Complementarity was observed for the TF pairs: ENG–LH, CONT (contrast)–ENT and LH–ENT. In conclusion, the effect of respiratory motion should be taken into account when the heterogeneity of lung cancer is quantified on PET/CT images. Despite inaccurate volume delineation, TF derived from 40% and COA contours could be reliable for their prognostic use. The TF that exhibited simultaneous added value and independence of lesion movement were ENG and ENT computed from the G-image. Their use is therefore recommended for heterogeneity quantification of lesions affected by respiratory motion.
Export citation and abstract BibTeX RIS
1. Introduction
Positron emission tomography (PET) imaging with [18F]fluoro-2-deoxy-D-glucose (FDG) plays a major role in clinical oncology. Quantitative analysis of the PET image has been shown to be a valuable tool for diagnosis and staging in lung cancer (Townsend et al 2008, MacManus et al 2009). Interest is now increasing in using PET quantification for therapy response assessment and patient follow-up (Weber 2005, Jeraj et al 2015). Standardized uptake value (SUV) measures have been reported to support diagnosis and assist prognosis. Their relative changes are commonly investigated as being representative of clinical response (Nestle et al 2006).
The biologic heterogeneity within the tumor relates to poor prognosis and lesion sensitivity to specific therapy. Random sampling biopsies probe only a specific part of a tumor, which does not necessarily represent the lesion heterogeneity. Research is therefore focusing on medical image analysis for tumor heterogeneity characterization in a noninvasive way (Buvat et al 2015). The measurement of texture features (TF) on PET images has been recently investigated in different cancers (El Naqa et al 2009, Tixier et al 2014, Doumou et al 2015). The use of TF for this purpose requires an additional level of reproducibility beyond what is required for diagnostic imaging. Consequently, the robustness of TF with respect to image reconstruction settings (Galavis et al 2010, Nyflot et al 2015, Yan et al 2015), and to inter-observer variability (Leijenaar et al 2013), has been investigated by retrospective analysis of clinical images. The non-negligible impact on TF variability has been observed depending on the segmentation method (Hatt et al 2013, Orlhac et al 2014). Although the impact of lesion heterogeneity on threshold-based delineation has been demonstrated, it has been widely used for TF computation (Erdi et al 1997). From our knowledge, the bias in heterogeneity characterization that could imply TF derived from threshold-based contours has not yet been evaluated with experimental phantoms.
In addition, the evaluation of the lesion with FDG PET/CT imaging in lung cancer presents challenges due to respiratory movement. Respiration and organ deformation result in lesion motion, thereby spreading the radiotracer activity over an increased volume, distorting the apparent tumor shape and location and reducing the signal-to-noise ratio. Different strategies have been proposed for respiratory motion management in PET/CT systems (Bowen et al 2008). As a result of motion compensation, an improvement of the volume and activity accuracy has been reported in experimental phantoms (Nehmen et al 2003, Park et al 2008) that may help in the clinical scenario (Callahan et al 2014, Chirindel et al 2015). However, commercially available phantoms are often fillable inserts made of glass. These inserts have two main disadvantages: the size of their surrounding walls (1–3 mm) and that they are only fillable with homogeneous solutions which do not reflect the clinical lesion scenario. The use of alginate for phantom development has been recently proposed to avoid these limitations (Kurth et al 2013). Alginate phantoms could therefore be used to extend the study of the impact of respiratory movement on TF in order to ensure their robustness when heterogeneity is quantified in lung cancer.
The aim of this work was to evaluate, with experimental heterogeneous phantoms, the current use of PET texture analysis for heterogeneity characterization in lesions affected by respiratory motion.
2. Materials and methods
Our work involved: (i) an initial evaluation of the TF response for an ideal contour fitting the whole lesion (VOIideal) and its robustness with respect to the segmentation method; (ii) the effect of motion on TF derived from images with and without motion compensation and (iii) the evaluation of the complementarity for the TF under study. Experimental measurements are summarized in table 1. Their main characteristics are detailed in the following sections.
Table 1. Experimental phantom measurements.
| Movement | Phantom | Image | Segmentation method | Study |
|---|---|---|---|---|
| No movement applied | SET1 | Static | VOIideal | Effect of segmentation method |
| M.Q. Platform |  |
|||
| Typical.HP | SET1 | Gated |  |
Effect of repeated measurements for the same movement |
| Ap(LR) = 3 mm and Ap(SI) = 18.3 mm | M.Q. Platform | Ungated | ||
| Ap(SI) = (18.3, 15.7, 12.6, 9.4 and 6.3 mm) | SET 2 | Gated |  |
Effect of SI amplitude |
| Typical.HP and Ap(LR) = 0. | M.Q. Platform | Ungated | ||
| Ap(LR) = (10.5, 8, 5, 3 and 0 mm) | SET3 | Gated |  |
Effect of hysteresis (LR amplitude) |
| Typical.HP and Ap(SI) = 18.3 mm | M.Q. Platform | Ungated | ||
| 3 Typical (HP, MP, LP), 1 atypical normal and 1 atypical irregular Ap(LR) = 0 and Ap(SI) = 18.3 mm | SET3 | Gated |  |
Effect of waveform |
| M.Q. Phantom | Ungated | |||
Ap: peak-to-peak amplitude; SI: superior–inferior; LR: left–right; TF: texture features; M.Q.:Medical Quasar; VOI: volume of interest and H(M/L)P: high(middle/low) peak
2.1. Phantoms with heterogeneous FDG distribution
Alginate (Kurth et al 2013) was employed in order to simulate 28 heterogeneous lesions (figure 1). FDG concentrations within the simulated lesions (I3 = 17 kBq ml−1,  ,
,  ,
,  ) and background (Bg = I3/10) were within the range reported by a previous publication in lung cancer patients (Carles et al 2014). The level of heterogeneity was guaranteed by the coefficient of variance (COV) > 0.3 for all the phantoms (COV
 , ranging from 0.38–0.64), criteria conventionally applied to identify heterogeneous lesions (Hatt et al 2011). The COVs were computed within VOIideal (see section 2.4) on the static image. All the simulated lesions had a diameter longer than 3 × FWHM (full width half maximum) in order to minimize the partial volume effect (PVE) (Shepherd et al 2012). This restriction is often applied in quantification of intratumoral heterogeneity (Brooks et al 2014, Grootjans et al 2016).
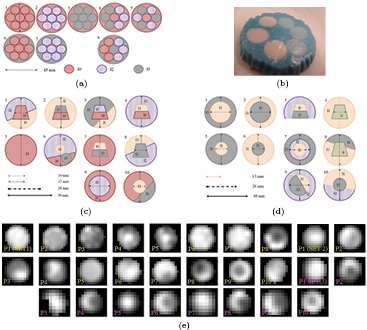
Figure 1. Heterogeneous inserts made of alginate. (a) SET1. (b) SET1: phantom 8. (c) SET2. (d) SET3. (e) PET static images. Image scale defined by whole image (3D) gray values.
Download figure:
Standard image High-resolution image2.2. Respiratory movements
The heterogeneous inserts were placed within a cylindric container filled with an FDG background, Bg. In order to simulate respiratory motion, a Medical Quasar respiratory motion phantom and platform (Dunn et al 2011) were employed (figure 2).
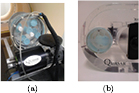
Figure 2. Medical QUASAR respiratory platform (a) and phantom (b).
Download figure:
Standard image High-resolution imageThe different applied patterns were chosen in compliance with respiratory motion descriptions (Seppenwoolde et al 2002, Ionascu et al 2007, Liu et al 2009). On the one hand, a patient's breathing leads to a complex tumor movement. This movement is significant in the superior–inferior (SI) direction with peak-to-peak amplitudes (Ap) ranging from 6 to 20 mm (Ionascu et al 2007). Additionally, tumor motion comprises smaller displacements in anterior–posterior and left–right (LR) directions. On the other hand, hysteresis observed in a patient's breathing (Seppenwoolde et al 2002) shows a difference path between inhalation and exhalation due to the phase difference in the breathing curves along two directions. We therefore applied SI average peak-to-peak amplitudes ranging from 6.3 to 18.3 mm. Hysteresis was included along the LR direction with Ap ranging from 0 to 10 mm, which was possible because of the properties of the Medical Quasar respiratory platform. In addition, we have included different respiratory traces according to Liu et al (2009). In this work, a classification of 1259 respiratory traces in 3 categories based on the shape of the displacement histogram was done: (i) 60% of the patients were classified as periodic breathers with reproducible end-expiration displacement (typical), with a prominent peak at the end of the displacement histogram; (ii) 20% were classified as periodic breathers with normal distribution of end-expiration displacement (atypical normal) and (iii) 20% were classified as chaotic breathers (atypical irregular). Applied patterns (figure 3) corresponded to this classification.

Figure 3. Waveforms and histograms of displacement for the respiratory patterns applied. Three typical patterns (60%): with high peak (HP) (a), middle peak (MP) (b), and low peak (LP) (c). (a) Typ.HP. (b) Typ.MP. (c) Typ.LP. (d) Atyp. normal. (e) Atyp. irregular.
Download figure:
Standard image High-resolution image2.3. Data acquisition
The PET/CT system we employed (Medical Philips System GEMINI TF TOF 64) had a transverse and axial resolution of 4.7(5.2) mm at 1(10) cm from the scanner center, 526 ps of temporal resolution and an average energy resolution of 11.8%. This scanner fulfilled the requirements indicated in the EANM imaging guidelines and obtained EARL accreditation during the time of the measurements. The gated (G-) images resulted from a 10 min PET and 36 s CT acquisitions that were retrospectively gated in 10 frames based on the time analysis of the breathing curve provided by a pressure sensor belt (Mayo clinic respiratory feedback system). Each PET frame was scatter- and attenuation- corrected with the corresponding frame of the 4D-CT dataset, performed with a tube voltage of 120 kV and a current of 188 mAs. BLOB-OSEM-TOF (3D blob-based ordered-subset iterative time-of-flight) was the reconstruction algorithm with 2 iterations and 33 subsets. The grid sizes of  and
and  lead to image voxel volumes of
  mm3 and
  mm3 for CT and PET images, respectively. Ungated (U-) images resulted from the whole data reconstruction. Static (S-) images were obtained for 15 min PET and 3.7 s CT acquisitions when no movement was applied to the phantoms.
2.4. Tumor segmentation
For the heterogeneous phantoms, a direct correspondence between the alginate and FDG distribution permitted us to approach the ideal segmentation of the whole lesion (VOIideal) by the CT contour on the static image. After a denoising median filter (radius = 3 voxels), the growing region algorithm initialized with a threshold interval (65–135 Hounsfield units), resulted in a robust method for the lesion contour definition in CT (see figure 4). These CT contours were applied to the PET image for TF computation.

Figure 4. Example of VOIideal for SET1 on static CT ((a), (b)) and on PET (c). (a) Axial. (b) Coronal. (c) Axial.
Download figure:
Standard image High-resolution imageOn the PET image, two different methods were applied for tumor delineation: (i)  , a fixed threshold of 40% of the maximum intensity within the lesion and (ii) VOICOA, an adaptive threshold taking into account the contrast between tumor concentration (mean value for a 70% isocontour of maximum intensity within the lesion) and background (automatically derived from the whole image) (Carles et al 2015).
2.5. Texture features
Eight TF were used in order to quantify lesion heterogeneity (table 2 and table 3). They were categorized into two types: (i) first order statistics (FOS) which are based on the histogram of the voxel activity concentration (intensities), xk, of the N voxels,  , within the VOI and (ii) methods based on the spatial arrangement of the voxel intensities within the lesion using second order statistics by firstly calculating the gray-level co-ocurrence matrix (GLCM). This MxM matrix gives the probability (p(i, j)) of observing a pair of voxel values (matrix indexes: i = 1,...M; j = 1,...M) at a distance (r) along direction (d).
Table 2. TF of first order.
| Name | Equation | Meaning |
|---|---|---|
| Coefficient of variance (COV) |  |
COV > 0.3 are considered heterogeneous (Hatt et al 2011) |
| Skewness (SK) |  |
SK = 0 symmetric; SK < 0 skewed left; SK > 0 skewed right |
| Kurtosis (KT) |  |
KT = 3 normal distribution peak; KT < 3 flat; KT > 3 peaked |
| Width of the histogram (WH) |  |
 : accumulative concentration for the % of the lesion volume (El Naqa et al 2009) : accumulative concentration for the % of the lesion volume (El Naqa et al 2009) |
Table 3. TF of second order.
| Name | Equation | Meaning |
|---|---|---|
| Energy (second angular moment) (ENG) |  |
Uniformity |
| Contrast (inertia) (CONT) FOS were evaluated |  |
Local intensity variation |
| Local homogeneity (inverse different moment) (LH) |  |
Homogeneity |
| Entropy (ENT) |  |
Information content |
To calculate the TF of the second order, the voxel values were firstly resampled following equation (Buvat et al 2015):

where Cmax and Cmin are the maximum and minimum voxel activity concentrations within the lesion, and the values were resampled with M = 16 discrete values. M = 16 was chosen based on the criteria of image noise (1 min for the G-image), previously suggested for resampling optimization (Yan et al 2015). GLCM ( ) was calculated considering all 13 directions in 3D (d = 26) between the consecutive voxels (r = 1), a definition supported by previous publications (El Naqa et al 2009, Hatt et al 2015, Vallières et al 2015).
The studied TF were computed using an in-house software based on Wolfram Mathematica. The Medical Imaging Interaction Toolkit and internal functions of Wolfram Mathematica were employed to validate the intensity histograms and FOS derived from them and the 2D version of the co-ocurrence matrix.
2.6. Data analysis
Heterogeneity was quantified on three different PET images: S-, G- and U-images. For the G-image, the TF were derived from the mean position frame (Fm). The Fm was identified for each measurement as the time bin in which the center of gravity of the target was closest to its time weighted-mean position.
Different analyses were performed in order to quantify the impact on TF variability. Bland–Altman (BA) percentage plot analysis involved mean and standard deviation (SD) of differences relative to the mean of the two measurements, as well as the respective limits of agreement (mean ± 1.96SD). The 95% confidence interval (CI) was used as a criteria for significant bias (Giavarina 2015). The coefficient of variance was defined as  . Linear correlation (LC) analysis was performed using a software package (SPSS Statistics of IBM). P-values less than 0.05 were considered statistically significant. The effect of the movement was analyzed by the LC between all the possible combinations of pairs of movements
  , where Ns were the number of movements applied. In the comparison of TF derived from the G- and U- image for the same movement, relative deviation (δ12(%) = 100 (TF1-TF2)/TF1) and the Wilcoxon rank test were additionally investigated.
3. Results
3.1. Effect of segmentation method
In order to provide some guidance regarding how the TF relate to the heterogeneous activity distribution, in figures 5(a) and (b) we represent the TF derived from the approach to the ideal contour (VOIideal) on the S-image when no movement was applied to the phantoms of SET1. Some of the histograms and co-ocurrence matrix were plotted in figures 5(c)–(j). The results showed that COV values were larger than the criteria to identify heterogeneity (COV > 0.3) for all phantoms. Most of the phantoms were classified as skewed to the right by skewness (SK) and flatter than a Gaussian distribution by kurtosis (KT). Phantom 2 was classified as the most symmetric distribution (SK =−0.005) (see figure 5(d)) and phantom 8 as the most skewed and highly peaked (SK = 0.88, KT = 3.22); see figure 5(f). By comparing the histogram and the corresponding co-ocurrence matrix, it was observed that the spatial information conveyed by the matrix could facilitate the visual assessment of the different layers of FDG concentration.

Figure 5. ((a), (b)): TF derived from the approach to the ideal contour on the S-image for the phantoms of SET1 when no movement was applied. Histograms (c) and co-occurence matrix (d) derived from the approach to the ideal contour on the S-image for phantoms 1 ((c), (g)), 2((d), (h)), 7 ((e), (i)) and 8 ((f), (j)), from left to right. (a) 1st order. (b) 2nd order.
Download figure:
Standard image High-resolution imageThe impact of the segmentation approach in the TF was analyzed in terms of BA percentage plots (examples in figure 6), being (method A–method B) the comparisons (ideal-40%) and (ideal-COA). As expected (Hatt et al 2011), both segmentation approaches showed significant volume underestimation when compared with the ideal contour,  and
and  for (ideal-COA) and (ideal-40%), respectively. The difference percentages for almost all the TF (except for COV and WH) followed a normal distribution (Shapiro–Wilk test). The mean percentage of difference and 95% CI demonstrated a significant bias for all of them. The results of the BA analysis are summarized in figure 7. When applying the BA analysis between PET segmentation approaches (COA-40%), a smaller but still significant bias was obtained for volume:
  and CI (−7, −5). The bias was non-statistically significant for Cmean and 4/8 TF: SK, KT, CONT and ENT.

Figure 6. Bland–Altman percentage plot analysis.
Download figure:
Standard image High-resolution image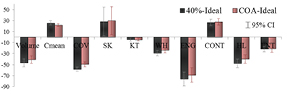
Figure 7. Mean of differences relative to the mean and 95% CI.
Download figure:
Standard image High-resolution imageIn addition, the LCs were investigated between the TF derived from the two PET segmentation approaches (COA-40%) and with respect to the ideal contour (COA-ideal) and (40%-ideal). For volume, the mean concentration (Cmean) and all TF, apart from COV, high significant (p < 0.001) LCs were obtained in all comparisons. In table 4, Pearson's correlation coefficient (r) averaged over (40%-ideal) and (COA-ideal) was denoted by mean (PET-ideal) and presented together with values for (40%-COA). A stronger LC resulted between the PET segmentation approaches with respect to their comparisons with the ideal contour.
Table 4. Pearson's correlation coefficients, p < 0.001 in all cases.
| Vol | Cmean | SK | KT | WH | ENG | CONT | LH | ENT | |
|---|---|---|---|---|---|---|---|---|---|
| mean(PET-ideal) | 0.82 | 0.98 | 0.82 | 0.82 | 0.98 | 0.82 | 0.93 | 0.82 | 0.81 |
| (40%-COA) | 0.99 | 0.93 | 0.99 | 0.99 | 0.97 | 0.99 | 0.99 | 0.95 | 0.93 |
3.2. Effect of respiratory motion on TF
3.2.1. Variability for the same movement.
We repeatedly measured (22 min between the initialization of consecutive acquisitions, three acquisitions) phantoms of SET1 following the breathing pattern typical.HP with amplitudes App(SI) = 18.3 mm and App(LR) = 3 mm.
In order to study the variability given by three repeated measurements of the same movement, we analyzed the LCs for all TFs, volume and Cmax (table 5). Volume, SK, WH and ENT were linearly correlated for the three possible combinations of pairs of movements on both images Cmax, energy (ENG) and LH were also linear correlated for the G-image. TF variability was also analyzed in terms of  . The results are presented in the next section 3.2.2 by comparing them with respect to
  for different movements.
Table 5. Linear correlations of TF when the same movement was applied to phantoms of SET1.
| TF | Cmax | Volume | COV | SK | KT | WH | ENG | CONT | LH | ENT |
|---|---|---|---|---|---|---|---|---|---|---|
| U-image | 2/3 | 3/3 | 3/3 | 3/3 | 2/3 | 3/3 | 2/3 | 3/3 | 1/3 | 3/3 |
| G-image | 3/3 | 3/3 | 2/3 | 3/3 | 2/3 | 3/3 | 3/3 | 2/3 | 3/3 | 3/3 |
For this complex movement, we additionally compared the TF derived from the U-image and G-image. Comparison was analyzed in terms of relative deviation  (%), the Wilcoxon rank test and BA analysis (Yip et al 2014, Oliver et al 2015, Grootjans et al 2016). The Wilcoxon rank test resulted in significant differences for volume, Cmax, COV and WH. For all TF
  (%) were lower than for volume, and for 6/8 TF were lower than for Cmax, suggesting less dependency on image protocol than conventional indexes (see table 6). BA analysis showed that only bias for CONT (
 ) and ENT (
 ) were non-statistically significant, with 95% CI of (−4, 9) and (−8, 2) respectively.
Table 6. TF relative deviation  (%) between ungated and gated imaging.
| Vol | Cmax | COV | SK | KT | WH | ENG | CONT | LH | ENT |
|---|---|---|---|---|---|---|---|---|---|
 |
 |
 |
 |
 |
 |
 |
 |
 |
 |
3.2.2. Variability for different movements.
Our set-up permitted us to study the effect of the three main characteristics of respiratory movement on heterogeneity quantification (table 1): amplitude along SI, hysteresis and waveform. TF values derived from the G- and U-image were analyzed in terms of LCs for ten possible combinations of the five movements applied to the phantoms in each study. The results are shown in figure 8. Different behaviors were observed depending on the TF and on the characteristic of the movement considered. For a given waveform, increasing the amplitude along SI did not translate to significant differences between TF response on the G- and U- image. Hysteresis did not compromise variability on the U-image, but for G-quantification by first order TF (FOS), poorer variability was observed. It could be due to higher sensitivity of FOS to poorer G-frame statistics implied by these two-path movements. The waveform showed the most significant impact on TF variability. For different waveforms, U-image quantification had poor correlation for TF, both first and second order. This effect was minimized using the G-image. Overall, an ideal performance, i.e. significant LC for all pairs of movements (30/30), was obtained for WH on the U-image and WH, ENG, LH and ENT on the G-image.
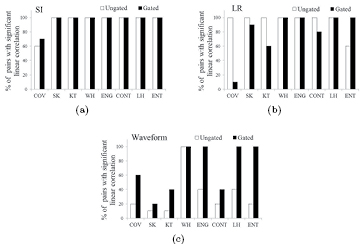
Figure 8. Percentage of combined pairs of movements ( pairs) with significant LC for TFs. The characteristics of movement studied were: variation in SI amplitude (a), in LR amplitude (b) and in the waveform (c).
Download figure:
Standard image High-resolution imageIn figure 9(b), recovery coefficients (RC) for most of the TF showed increased variability when different movements were applied, with respect to variability given by repeated measurements of the same movement (see section 3.2.1): RC ranging from 0.71–1.4 on the G-image and from 0.26–1.50 on the U-image. In figure 9(a), we compared  of TF for different movements (columns) with respect to
  of volume and Cmax obtained for the same movement (horizontal lines). All TFs showed lower variability than Cmax. On the G-image,
  for COV, KT, LH and ENT was also lower than for volume.

Figure 9. Variability in terms of the coefficient of variance:  for TF when different movements were applied (a) and their recovery coefficients with respect to the
  over three repeated measurements of the same movement (b).
Download figure:
Standard image High-resolution image
3.3. Complementarity of TF
The TF complementarity between themselves and with respect to Cmax and volume was studied. The analysis was applied to the G-imaging of the dynamic measurements (see section 2.2). WH was the unique TF that showed significant correlation with respect to Cmax. Significant LCs were observed (table 7) for ENG–LH, CONT–ENT and ENT–LH.
Table 7. Complementarity.
| WH–Cmax | ENG–LH | CONT–ENT | ENT–LH | |||||
|---|---|---|---|---|---|---|---|---|
| Phantoms | Average (r, p) | N/Ntot | Average (r, p) | N/Ntot | Average (r, p) | N/Ntot | Average (r, p) | N/Ntot |
| SET1 | (0.92, 0.002) | 3/3 | (0.96, <0.001) | 3/3 | (−0.91, 0.002) | 3/3 | (−0.90, 0.004) | 3/3 |
| SET2 | (0.93, <0.001) | 9/9 | (0.97, <0.001) | 9/9 | (−0.92, <0.001) | 9/9 | (−0.95, <0.001) | 9/9 |
| SET3 | (0.99, <0.001) | 5/5 | (0.99, <0.001) | 5/5 | (−0.85, <0.05) | 3/5 | (−0.96, <0.001) | 5/5 |
| N/Ntot: proportion of measurements in which significant correlation was obtained. | ||||||||
| Average (r, p): calculated over N. | ||||||||
The TFs that showed the highest percentage of LCs with respect to volume were: ENG and ENT in 9/15 cases and LH in 10/15 cases, with average values (r = 0.86, p < 0.01), (r = −0.87, p < 0.01) and (r = 0.86, p < 0.01), respectively. The large volumes involved in our set of phantoms minimized PVE, and the range of volumes minimized the difference in the number of voxels. We could therefore expect more significant LCs for a wider range of volumes.
4. Discussion
In previous works, experimental measurements of phantoms filled with homogeneous solutions were employed to report the improvement in volume and SUV accuracy by the compensation of respiratory motion conveyed in retrospectively gated (4D-) PET/CT (Nehmen et al 2003, Park et al 2008). In our work, alginate (Kurth et al 2013) allowed us to simulate different heterogeneous FDG distributions. Therefore, we had a priori knowledge of the nominal distribution, extending the investigation to TF for heterogeneity characterization.
The impact on TF due to reconstruction settings (Yan et al 2015), the resample step (Orlhac et al 2014, Leijenaar et al 2015) and segmentation method (Hatt et al 2013, Orlhac et al 2014) was minimized by applying the same methodology across the whole analysis. The resampling step with a fixed number of bins was selected based on the recommendations given by the TF state-of-the-art review published in 2015 (Buvat et al 2015). The choice of its use, together with the co-ocurrence definition employed in this work, was supported by different publications (El Naqa et al 2009, Hatt et al 2015, Vallières et al 2015). However, Leijenaar's work suggested, as a better approach, resampling with a fixed bin width due to the constant resolution maintained across all tumor images (Leijenaar et al 2015). Discrepancies in the TF derived from both methods were therefore expected to increase with larger differences in tumor intensity ranges. Additionally, when considering the resampling used in the current study, most TFs were likely to be correlated with volume, whereas they would be more likely to be correlated with Cmax using the alternative resampling proposed by Leijenaar. Due to the fact that most of the analysis of the present work involved comparisons of TF response on the same target (no significant differences in intensity range), the resampling step might not compromise its results. However, in future work, the development of phantoms involving a larger range of concentrations and volumes could properly address the impact of the resample step on TF complementarity.
PET/CT imaging of lesions affected by respiratory motion implies an additional limitation to the acquisition time. It should be a trade off between optimizing the statistics and minimizing motion effect. Some recent studies of lung cancer patients used TF derived from U-PET acquisitions in order to characterize tumor heterogeneity (van Elmpt et al 2013, Tixier et al 2014). No consensus seems to emerge for the acquisition time of U-imaging of lesions affected by respiratory movement, ranging from 1.5–5 min. In our work, respiratory patterns (ranging from 2.5–5 min) were repeated throughout a 10 min acquisition. As a result of this approach, the U-image employed in our study involved the effect of motion but better statistics than the one expected in the clinical case. Consequently, it is reasonable to consider that the improvements observed in our work for the G-image with respect to the U-image could be more significant in the clinical case.
Previous works investigated the impact of the segmentation method on TF variability by comparison with the TF derived from different PET segmentation methods, including COA and 40%, applied on the clinical image (Hatt et al 2013, Orlhac et al 2014). In our work, alginate phantoms permitted TF computation from the ideal contour of the whole lesion. We could therefore establish them as the ground truth for the comparison with respect to TF derived from 40% and COA contours. Our results—significant bias for volume and all the TF, but high significant LCs for all of them, apart from COV—could justify the results reported in Hatt et al (2013). They found a non-statistically significant difference concerning the associated predictive value of TF, that has shown high absolute difference between values derived from different delineation approaches. Consequently, it could be concluded that, although 40% and COA could lead to an inaccurate delineation of heterogeneous lesions, the TF derived from them could be reliable for their prognostic use. However, based on the non-interchangeable TF values reported, the standardization of the segmentation method would still remain a requirement when absolute TF quantification is involved in clinical trials.
In our study, the effect of respiratory motion on TF was evaluated by the analysis of LCs between TF values when different movements were applied to the phantoms. This analysis was chosen based on the assumption that TF with perfect LC (100%, significant LC independent of the movement) may be more able to ensure a robust classification of the level of tumor heterogeneity. In addition, LC analysis was preferred than rank correlation because it could ensure linearity for all positive correlations, whereas by positive rank correlation, different monotonic functions could be covered. We considered that the results from LC analysis should imply higher robustness, and that was therefore chosen. Previous publications (Leijenaar et al 2013), discussed the need to identify changes in the TF value large enough to be considered useful. As possible estimators of significant TF deviations, we additionally provided  of TF when different movements were followed by simulated lesions and compared their values with respect to
  for the same movement in conventional indexes (Cmax and volume) (see figure 9). Cmax and volume were previously suggested as criteria of reasonable stability because of their wide use as conventional indexes in PET quantification (Orlhac et al 2014).
Three recent works have investigated TF variability when computing from 3D- and 4D-PET imaging protocols for lung cancer patients. In Yip et al (2014), Oliver et al (2015) and Grootjans et al (2016), the TF studied in common with our work were 1/5, 6/56 (for which  were provided) and 1/4, respectively. When comparing (Oliver et al 2015) with respect to the
  results in our work (see section 3.2.1), the values were similar for volume (15 versus
  ), WH (16 versus
  ) and ENT (5 versus
  ). The PVE for small volumes (Oliver et al did not apply minimum volume critera for lesion selection) could be responsible for increasing the variability observed for Cmax (45 versus
  ) and COV (25 versus
  ). The choice of the alternative definition for KT (our definition-3, where 0 corresponded to the normal distribution peak) could explain their larger values for
  (193%). In addition, they reported that TF variability between images did not show dependency with amplitude of movement. It could be partially explained by the results presented in figure 8(a) of our work. For periodic-breather movement with reproducible end-expiration displacement (typical.HP), comparable to the criteria for patient selection applied in their work, most TFs for both G- and U-images were not sensitive to differences in amplitude. In concordance with our work, non significant differences (Wilcoxon rank test) between the G- and U-images and similar
  were reported for ENT (5 versus
  ) in Grootjans et al (2016) and for CONT (4–6 versus
  ) in Yip et al (2014).
As recently discussed in Buvat et al (2015), in order to demonstrate the real added value of TF, the LC between different TF themselves and between TF and conventional indexes, such as Cmax, should be analyzed. Our analysis of complementarity was limited by the sample of the phantoms employed. However, the correlations obtained (ENG–LH, CONT–ENT and LH–ENT) were in concordance with the results reported in previous retrospective analysis of clinical data (Orlhac et al 2014). We additionally observed a high correlation between WH and Cmax. Further work should be focused on the validation of this correlation by clinical data in order to ensure the added value of WH.
From the large number of image features available in the literature, our study focused on eight of them. All eight TFs were commonly under study in a wide range of previous works (El Naqa et al 2009, Hatt et al 2011, Tixier et al 2012, 2014, Orlhac et al 2014, Leijenaar et al 2013, Nyflot et al 2015, Yan et al 2015). FOS were involved because respiratory motion could translate into a significant impact on heterogeneity quantification based exclusively on intensity histograms. From all the available TF conveying spatial information, co-ocurrence matrices were preferred because of their more intuitive structure. Their surface plots facilitated visual assessment not only of our a priori knowledge of the intensity distribution, but also of the motion effect. From the results, the retrospectively gated image could be expected to minimize the effect of respiratory motion for TF conveying spatial information. However, further investigation involving other TF approaches, as well as the wavelet transform, Markov model, etc (Zhang and Tan 2002), would be required to support their use with a prognostic purpose.
5. Conclusion
Experimental heterogeneous phantoms were used in order to evaluate the current use of PET-TF for heterogeneity quantification. Despite inaccurate delineation of heterogeneous lesions by 40% and COA, the TF derived from them could be reliable for their prognostic use. In addition, energy and entropy derived from the G-image could be recommended for their use in the heterogeneity characterization of lesions affected by respiratory motion.
Acknowledgments
This work was funded by the Vali + d Programme of the Regional Government of Valencia (APOSTD/2015). For the Medical Quasar respiratory phantom and platform, the authors wish to thank Dr José Pérez Calatayud from Radiotherapy Department at the University Hospital La FE and the companies PTW and Modus QA.