

Abstract
Surface hydroxylation of crude Al2O3 (c-Al2O3) nanoparticles by H2O2 was conducted to tailor the electrical properties of UV-cured resin. The hydroxyl groups on Al2O3 particles were designed to establish hydrogen bonding between the hydroxyl and carboxyl groups, which favors the enhancement of interfacial strength between fillers and UV-cured resin matrix. The effect of interfacial strength on the electrical properties was investigated. Owing to the improved interfacial strength, it can be conjectured that a larger volume of the interaction zone exists in UV-cured resin/hydroxylated Al2O3 (UV/h-Al2O3) composites. As a consequence, the number of deeper traps is increased, restraining the charge migration and raising the charge injection barrier. Thus, UV/h-Al2O3 composites exhibit remarkably enhanced breakdown strength, improved volume resistivity and suppressed space charge accumulation in comparison with that of UV/c-Al2O3 composites at the same filler content. It was found that the addition of 0.5 wt% h-Al2O3 increases the AC breakdown strength and volume resistivity by 15.5% and 367.9%, respectively. Our results suggest that hydroxylation is an efficient way to improve the electrical properties of UV-cured resin nanocomposites, thus promoting stereolithography 3D printing in the application of electrical and electronic fields.
Export citation and abstract BibTeX RIS
1. Introduction
Stereolithography apparatus (SLA) 3D printing has drawn tremendous attention from both academia and industry with the numerous advantages offered by this technology, such as ease of use, excellent accuracy, low internal defects, processing speed, and creating more complex geometries [1–3]. These advantages make it a well-regarded candidate for the 3D printing of functional and end-use components. Despite these advantages, however, the poor electrical performance of the supporting UV-cured resin restricts SLA's applications in electrical and electronic insulation fields [4, 5].
Incorporating polymeric matrix with inorganic fillers is a preferential method to improve the electrical properties of polymer materials [6–8]. However, the high surface energy of nanoparticles would lead to phase separation and agglomeration in the polymer matrix [9]. The traditional way to get around the problem is chemical grafting silane coupling agent to polymer chains and filler particles [10]. However, because of many problems such as complicated procedures, toxic reagents, strict reaction conditions and high cost instruments, they, to a great extent, have limited development and application in engineering [11–13]. Therefore, how to develop an eco-friendly and easily-handled method to modify the fillers in order to improve the electrical properties of polymer materials is an urgent subject now. Previous studies have demonstrated that enhancing the interfacial bonding strength between nanoparticles and matrix can greatly improve the electrical properties of nanocomposites [14, 15]. A simple and effective way to improve the interfacial bonding strength is by constructing hydrogen bonding (H-bonding) between filler surface and matrix. Based on this rationale, some scholars have done a lot of research and validated that H-bonding methods can effectively improve the electrical properties, mechanical properties and thermal conductivity properties of nanocomposites [16–18]. However, few studies in which the method of H-bonding has been applied to improve the electrical properties of UV-cured resin have been reported. In addition, the intrinsic relationship between the electrical properties, trap levels, and interfacial bonding strength remain unclear, which leads to insufficient understanding of the distinct different electrical properties of composites compared to those of pure polymers.
In this study, the electrical properties of UV-cured resin/Al2O3 nanoparticle composites (UV/Al2O3) are improved by a simple and efficient approach. That is, increasing the interfacial bonding strength with H-bonding. Moreover, an essential and intuitive understanding of the interfacial strength on the electrical properties was conducted. To establish H-bonding between Al2O3 nanoparticles and UV-cured resin matrix, the hydroxylated Al2O3 (h-Al2O3) nanoparticles fillers were prepared from crude Al2O3 (c-Al2O3) nanoparticles in an aqueous solution of H2O2. Then, the UV-cured resin based nanocomposites filled with c-Al2O3 and h-Al2O3 nanoparticles were fabricated. The morphology, electrical properties, space charge properties, and trap level distributions of UV/c-Al2O3 and UV/h-Al2O3 composites were investigated comprehensively. The results and methods presented here provide insights in the fabrication of UV-cured resin nanocomposites and contribute to the application of SLA 3D printing technology in electrical and electronic fields.
2. Experimental
2.1. Materials
The Al2O3 nanoparticles with an average diameter of about 100 nm, a purity of 99.9 %, and an average surface area of 50–80 m2 g−1 were obtained from Shanghai Macklin Biochemical Co., Ltd. (China). Acrylate resin (High Temp, Formlabs Inc., USA), which is sensitive to 405 nm light radiation wa used as the polymer matrix. Aqueous solutions of H2O2 (30 wt%), acetone and ethanol were supplied by Shanghai Reagents Co. Ltd (China). All of the chemicals were used as received. 2 cm thick quartz glass sheets , PDMS films and PET films are commercially available.
2.2. Hydroxylation of Al2O3 nanoparticles
To hydroxylate the Al2O3 nanoparticles, the synthetic procedure reported by S Chang et al was followed [19]. Initially, 10 g c-Al2O3 nanoparticles and 100 ml aqueous solution of H2O2 (30 wt%) were added to a round bottomed flask. Then, the mixture was sonicated for 30 min to guarantee a good dispersion and refluxed at 106 °C for 4 h. Then the h-Al2O3 nanoparticles were recovered by centrifugation at 2000 rpm for 20 min and were washed with distilled water at least 3 times. Finally, the h-Al2O3 nanoparticles were dried under vacuum at 80 °C for 12 h.
2.3. Preparation of UV/Al2O3 composites
The nanocomposites were fabricated by the UV-cured method, as illustrated in scheme 1. Firstly, the required amount of aforementioned Al2O3 nanoparticles were ultrasonically dispersed in acetone for 1 h. At the same time, UV-cured resin was diluted in acetone by magnetic stirring. The suspension of nanoparticles was then added into the UV-cured resin/acetone solution. Then, the mixture was sonicated and stirred for 6 h at 50 °C to get homogeneous nanocomposites and evaporate the residual solution. Subsequently, the mixture was degassed for 30 min to remove internal air bubbles. The mixed material was then injected into a transparent mold and cured for 2 h under 405 nm UV exposure (75 mW cm−2) at 60 °C. After which, films with a thickness of 500 ± 10 μm were obtained for test. The cured samples filled with c-Al2O3 and h-Al2O3 were respectively named as UV/c-Al-x and UV/h-Al-x, where x represents the percentile weight fraction of the ceramic fillers. Pure resin films were obtained by using the same procedure.
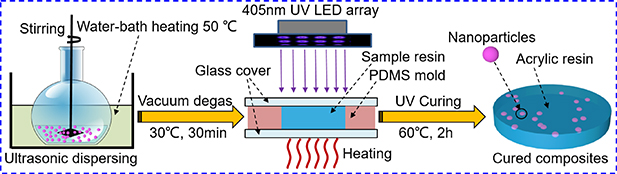
Scheme 1. Schematic diagram illustrating of preparation process of UV/Al2O3 composites.
Download figure:
Standard image High-resolution image2.4. Characterization
The Chemical structures of c-Al2O3 and h-Al2O3 nanoparticles were characterized by Fourier transform infrared spectroscopy (FT-IR, IN10 + IZ10, USA) in the wavenumber range from 400 to 4000 cm−1. The elemental compositions of the nanoparticles were identified by x-ray photoelectron spectroscopy (XPS, ESCALAB 250Xi, USA) with a monochromatic Al Kα x-ray (1486.6 eV photons) source. Survey scans over a binding energy range of 0–1200 eV were first taken for each sample with a constant detector pass energy range of 200 eV and then the high-resolution XPS measurements (pass energy 40 eV) were carried out to quantitatively measure the binding energy and atomic concentration.
The volume resistivity was investigated by Keithley 6517B test system. Each sample was measured eight times under a fixed 500 V DC voltage. According to GB/T 1408.1–2016 [20], the AC breakdown strength of the films with average thickness of 500 ± 10 μm was measured under a sphere-sphere electrode configuration. The dielectric properties of the samples were measured by broadband dielectric spectroscopy (Concept 80, Novocontrol Technology) over the frequency range of 10–1–106 Hz at 300 K under a 1.0 −V alternating-current voltage.The space charge distribution of the samples was measured using the pulsed electroacoustic (PEA) method under the applied DC electric field of 40 kV mm−1 at room temperature for 30 min after the electric field was applied.
The isothermal surface potential decay (ISPD) method was employed to analyze the charge transport behaviors of test samples. The corona triodes consist of a needle, a mesh grid and a grounded planar electrode [21]. Both the corona system and the test samples were placed into a test chamber where the temperature and humidity was approximately kept constant as 50 °C and 55%. The specimen was firstly charged with a −15 kV DC corona voltage and a −6 kV DC bias voltage for 10 min. Then the sample was moved to the probe and the surface potential of samples was measured immediately after charging by the probe of an electrostatic voltmeter for 50 000 s.
The trap level distribution was obtained by thermally stimulated depolarization current (TSDC) measurements. Electrodes with radii of 30 mm were used. The detailed TSDC procedure is as follows: The samples were firstly polarized under 250 V DC electric field at 150 °C for 30 min. Then the samples were rapidly cooled to −20 °C and stabilized at −20 °C for 3 min. After that, the poling voltage was removed and the samples were short-circuited for 3 min. Finally, the depolarization current was recorded from −20 °C to 180 °C with a heating rate of 3 °C min−1.
3. Results and discussion
3.1. Effect of H2O2 treatment on nanoparticles
FTIR spectroscopy was used to demonstrate the effect of the H2O2 treatment on the surface of the c-Al2O3 particles. Figure 1(a) showed the FTIR spectra of c-Al2O3 and h-Al2O3 nanoparticles. The broad absorbance band peaked at 3443 cm−1 represents the stretching mode of surface -OH groups on the particles [22]. It is clearly found that the c-Al2O3 and h-Al2O3 nanoparticles demonstrated exactly similar spectra in shape. However, as illustrated in the inset of figure 1(a), after being treated with H2O2, a stronger hydroxyl absorbance peak appeared in the h-Al2O3 nanoparticles, which signified denser surface hydroxyl groups. Overall, the results implied that the hydroxyl groups are successfully introduced onto the surface of c-Al2O3 nanoparticles by H2O2 treatment.

Figure 1. (a) FTIR spectra of c-Al2O3 and h-Al2O3 nanoparticles. (b) XPS general spectra of c-Al2O3 and h-Al2O3 nanoparticles. (c), (d) c-Al2O3 and h-Al2O3 nanoparticles high-resolution XPS spectra of O 1 s region.
Download figure:
Standard image High-resolution imageAdditionally, the effect of the H2O2 treatment on the surface of the Al2O3 nanoparticles was further verified by XPS. As described in figure 1(b), the XPS general spectra of c-Al2O3 and h-Al2O3 nanoparticles were obtained. It can be seen that there is no longer a significant difference between both nanoparticles. Figures 1(c) and 1(d) revealed the high-resolution XPS spectra of the c-Al2O3 and h-Al2O3 nanoparticles, respectively. It is clearly that the h-Al2O3 nanoparticles have a stronger -OH peak than c-Al2O3 nanoparticles. These results indicate that the surface treatment of the c-Al2O3 nanoparticles with H2O2 could endow the c-Al2O3 nanoparticles with -OH groups.
3.2. Microstructure and electrical properties
The dispersion of fillers in composites can be directly observed by using the SEM. The SEM micrographs to describe the fractured surfaces of the UV/c-Al-10 and UV/h-Al-10 composites are shown in figure 2. Large phase separations and agglomerations of Al2O3 particles in UV-cured resin matrix can be observed as demonstrated in figure 2(a) and the inset of figure 2(a). As the hydrogen bonds formed by the hydroxyl groups of h-Al2O3 and the carboxyl groups of UV-cured resin molecular chain, there is strong interfacial strength between filler and matrix, leading to a good dispersion of h-Al2O3 particles in the resin matrix (as shown in figure 2(b) and the inset of figure 2(b)).
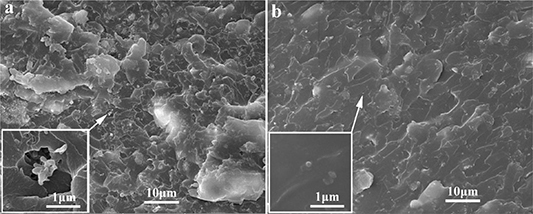
Figure 2. SEM micrographs of fractured surfaces of (a) UV/c-Al-10 composites, (b) UV/h-Al-10 composites.
Download figure:
Standard image High-resolution imageThe dielectric properties of the UV-cured resin nanocomposites were measured to find out the effect of hydrogen bonds formed by the carboxyl groups of UV-cured resin and the hydroxyl groups of h-Al2O3 nanoparticles. Figures 3(a) and (b) display the frequency dependence of the dielectric constant and dielectric loss tangent in pure UV-cured resin, UV/c-Al-x, and UV/h-Al-x composites. We can see that the dielectric constant for UV/c-Al-x and UV/h-Al-x composites increased with the increasing content of fillers relative to that of pure UV-cured resin. The main reasons are the larger dielectric permittivity of inorganic Al2O3 fillers and the greater interfacial polarization gained by the large amount of filler particles [23]. Beyond that, the dielectric constant of UV/h-Al-x is higher than that of UV/c-Al-x composites and the dielectric constant and loss tangent increased significantly with elevating weight of the Al2O3 nanoparticles especially when the content of Al2O3 reached 10 wt%. It may be explained by two reasons as followed. The first one is that the orientation polarization could be promoted when polar groups (-OH groups) were introduced into the composites. Second, the presence of hydrogen bonding enhanced the size of the interface region between the nanoparticles and the resin, which contributed to the improvement of the interface polarization at relatively low frequency [24].
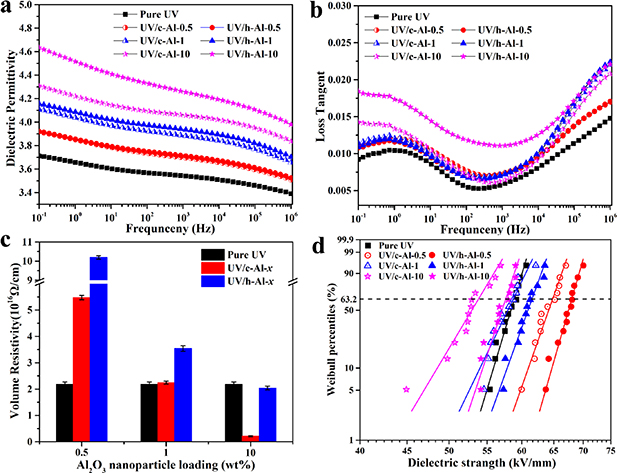
Figure 3. (a) Dielectric constant, (b) dielectric loss tangent, (c) volume resistivity and (d) weibull distribution of ac electrical breakdown of the UV-cured resin composites filled with different contents of c-Al2O3 and h-Al2O3 nanoparticles.
Download figure:
Standard image High-resolution imageThe volume resistivity of UV/c-Al-x and UV/h-Al-x composites with different contents of fillers are shown in figure 3(c) and listed in table 1. It is indicated that the volume resistivity decreased with the increasing content of c-Al2O3 or h-Al2O3 nanoparticles, meanwhile the volume resistivity of UV/h-Al-x is significantly higher than that of UV/c-Al-x composites. In addition, the results presented show that volume resistivity of UV/h-Al-0.5 composites increased 4.68 times (from 2.18 × 10¹⁶ Ω cm−1 to 10.2 × 10¹⁶ Ω cm−1), while that of UV/c-Al-0.5 composites increased 2.51 times (from 2.18 × 10¹⁶ Ω cm−1 to 5.47 × 10¹⁶ Ω cm−1) compared to pure UV-cured resin.
Table 1. Dielectric properties, volume resistivity and Weibull parameters of AC breakdown strength.
 r, r, |
ρ (1016 | Weibull parameters of AC breakdown strength | ||
|---|---|---|---|---|
| Specimen | 103 Hz | Ω cm−1) | α (kV mm−1) | Shape, β |
| Pure UV | 3.54 | 2.18 | 58.89 | 43.13 |
| UV/c-Al-0.5 | 3.69 | 5.47 | 64.82 | 36.91 |
| UV/c-Al-1 | 3.89 | 2.24 | 58.73 | 27.00 |
| UV/c-Al-10 | 4.06 | 0.21 | 53.84 | 21.77 |
| UV/h-Al-0.5 | 3.71 | 10.20 | 68.00 | 45.43 |
| UV/h-Al-1 | 3.94 | 3.54 | 61.56 | 36.09 |
| UV/h-Al-10 | 4.26 | 2.04 | 57.65 | 35.45 |
Breakdown strength (Eb) is a crucial parameter for practical applications as it determines the operational electric field. The Weibull statistical distribution is employed to analyze the AC breakdown strength of the nanocomposites according to the following formula [25, 26]:

where P(E) is the failure probability, Eb is the measured breakdown strength, α is the scale parameter which denotes a 63.2% probability of failure and β is the shape parameter which reflects the dispersion of data.
Figure 3(d) illustrates the AC breakdown strength of the nanocomposites with different contents of fillers and the parameters α and β are summarized in table 1. It is clear that the breakdown strength decreased with the increasing content of c-Al2O3 or h-Al2O3 particles. Moreover, the breakdown strength of UV/h-Al-x is remarkably higher than that of UV/c-Al-x composites. Specifically, the AC breakdown strength of UV/h-Al-0.5 composites increased by 15.5% (from 58.89 kV mm−1 to 68 kV mm−1) and 5% (from 64.82 kV mm−1 to 68 kV mm−1) compared with pure UV-cured resin and UV/c-Al-0.5 composites, respectively.
3.3. Space charge characteristics
Figure 4(a) demonstrates the space charge behaviors and corresponding electrical field profiles of pure UV-cured resin. It can be obviously seen that large amounts of homogenous charges were injected from both electrodes, especially the cathode. The injected homogenous charges accumulated at the vicinity of the cathode electrode and moved towards the bulk of the sample with increasing time. The largest electric field distortion in pure UV-cured resin is about 9 kV mm−1, which is nearly 22.5% of the average applied electric field of 40 kV mm−1. Such serious electric field distortion is very unfavorable for insulation applications [27, 28].
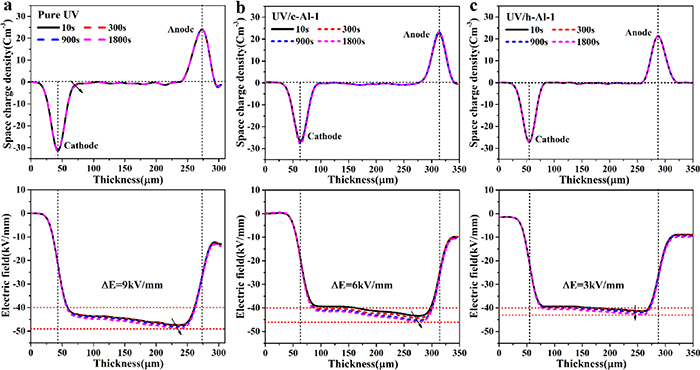
Figure 4. Space charge behaviors and corresponding electric field distribution during polarization when subjected to a dc voltage of 40 kV mm−1 at 298 K for 30 min. (a) Pure UV-cured resin, (b) UV/c-Al-1 and (c) UV/h-Al-1 composites.
Download figure:
Standard image High-resolution imageAs shown in figure 4(b), there is only a small amount of charge injected and accumulated in the UV/c-Al-1 composites. Up to 1800 s, the maximum electric field in the UV/c-Al-1 composites is less than that in pure UV-cured resin. Due to the introduction of the h-Al2O3 nanoparticles, as shown in figure 4(c), the nanocomposites possessed the best suppression performance of space charge, thus there is almost no space charge accumulation. The maximum electric field distortion detected in UV/c-Al-1 is about 3 kV mm−1, which is only one third of that in pure UV-cured resin. It suggests that the injection and migration of charge is significantly suppressed, and the distortion of the electric field is effectively improved.
3.4. Trap level distributions
Though the PEA is able to provide a spatial distribution of space charge across the specimen, its spatial resolution is limited (typically 5–10 μm). Therefore, this technique cannot be used to distinguish space charges located in the subsurface region of the specimen from capacitive charges on the electrodes (shown in figures 4(b) and 4(c)), which confuses the understanding of the effect of deep traps on the mechanism of space charge suppression [29]. Fortunately, ISPD is a common method to characterize the traps of sample in the subsurface region (1–2 μm). Based on the isothermal decay current theory, the relationship between the trap energy Et and the trap density Nt is shown as following [30, 31].
Where k is the Boltzmann's constant, T is the absolute temperature, γ is the electron vibration frequency, set as 1012 s−1, Nt(Et) is the trap density corresponding to the energy level of Et, 0 is the vacuum permittivity and r is the relative permittivity of dielectric, δ is the thickness of top charge layer, usually set as 2 μm, L is the sample thickness, and f0(Et) is the initial occupation probability of traps, set as 1/2 [32].
The ISPD experimental surface potential decay curve and corresponding calculated trap level distributions of pure UV-cured resin, UV/c-Al-1, and UV/h-Al-1 composites are described in figures 5(a) and 5(b), respectively. As can be seen from figure 5(a), the surface potential decay rate of UV/c-Al-1 composites is bigger than that of pure UV-cured resin, while obviously less than that of UV/h-Al-1 composites. Trap level Et and trap density Nt(Et) were calculated by using the ISPD theoretical equation (2), as shown in figure 5(b). It indicates that large amounts of deep traps are introduced by doping c-Al2O3 and h-Al2O3 particles in pure UV-cured resin. In addition, the trap density and depth of UV/h-Al-1 composites are higher than that of UV/c-Al-1 composites.
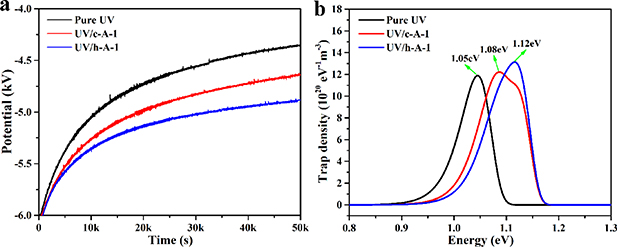
Figure 5. (a) Surface potential decay and (b) trap level distributions of pure resin, UV/c-Al-1 and UV/h-Al-1 composites after negatively charging at the temperature of 50 °C.
Download figure:
Standard image High-resolution imageTo further characterize the trap level distributions of pure UV-cured resin, UV/c-Al-1, and UV/h-Al-1 composites, the TSDC discharge current with temperature change was transformed into trap level density and trap level according to the calculation program in the previous study [33], as shown in figure 6. Meanwhile, the TSDC experimental current spectrum was inset into figure 6. The calculated trap level parameters are summarized in table 2. It is found that doping c-Al2O3 or h-Al2O3 particles into the UV-cured resin did not induce a new trap level peak. All the samples have two peaks, including deep trap peak α located at high temperature and shallow trap peak β located at a relatively lower temperature. By comparing the trap level distributions of pure UV-cured resin, UV/c-Al-1, and UV/h-Al-1 composites, we found that the trap level and trap density of peak α in UV/c-Al-1 composite are bigger than pure UV-cured resin, while the trap level of peak β is lower than pure UV-cured resin. However, when doped with 1 wt% h-Al2O3 particles, the trap level and density of peak α and peak β are significantly higher than pure UV-cured resin and UV/c-Al-1 composites. It indicates that large amounts of deep traps are introduced by doping h-Al2O3 in pure UV-cured resin, which is in good agreement with the results of ISPD.
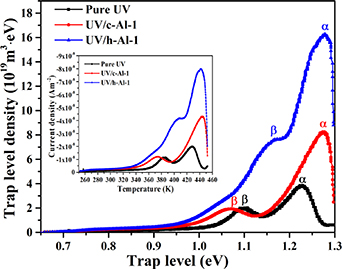
Figure 6. The TSDC trap level distributions in pure resin, UV/c-Al-1, and UV/h-Al-1 composites.
Download figure:
Standard image High-resolution imageTable 2. Parameters of trap level.
| Specimen | Tα (K) | Eα (eV) | Tβ (K) | Eβ (eV) |
|---|---|---|---|---|
| Pure UV | 428.28 | 1.23 | 384.46 | 1.10 |
| UV/c-Al-1 | 443.78 | 1.27 | 374.10 | 1.07 |
| UV/h-Al-1 | 445.53 | 1.28 | 407.45 | 1.17 |
3.5. Effect of H-bonding and trap level on electrical properties
Space charge transport includes charge migration, trapping, de-trapping and recombination processes, which is closely related to the electrical properties (such as breakdown, resistivity, dielectric constant, etc) [34]. Additionally, charge transport is affected by trap characteristics [35, 36]. The interface region (interaction zone) between the nanoparticles and matrix in composite materials is a special region, different from that of nanoparticles and matrix materials. There are a large number of local states in this region, which affect the trap characteristics of composite materials. As described in [37], the interaction zone around nanoparticles consists of two regions, which are named the bonded region and transition region. Among the two regions, the bonded region will produce deeper traps and the transition region will produce a large amount of shallower traps [38]. Compared with the matrix material, the interaction zone is considered as a conductive zone, and the thickness of the interaction zone is affected by the strength of interaction between nanoparticles and polymeric matrix [39]. The stronger the interaction strength, the thicker the interaction zone becomes [40].
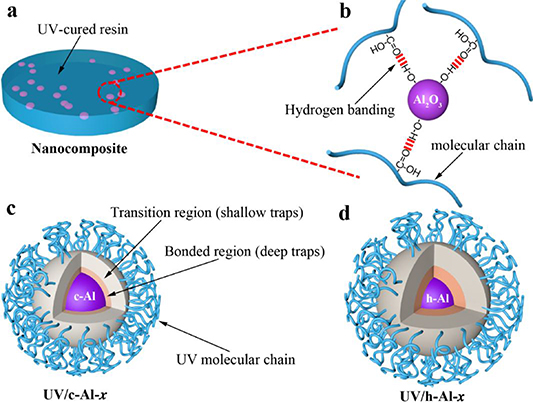
Figures 7(a) and 7(b) illustrated the formation mechanism of the intermolecular hydrogen-bonding system between Al2O3 nanoparticles and the UV-cured resin matrix. As shown in figure 7(b), the hydrogen bonding will be formed between the hydroxyl groups of Al2O3 nanoparticle and the carboxyl groups of UV-cured resin molecular chain. As a result, the dispersion of UV/h-Al-x composites is improved and the interfacial strength between h-Al2O3 and UV-cured resin matrix is enhanced (shown in figure 2). Based on the knowledge and understanding of the interaction zone, the interaction zone models of UV/c-Al-x and UV/h-Al-x composites are presented as figures 7(c) and 7(d), respectively. Compared with the UV/c-Al-x composites, a larger volume of the interaction zone existed in UV/h-Al-x composites because the interfacial bonding strength is improved by hydrogen bonding interaction between fillers and UV-cured resin matrix. Consequently, the number of deeper traps increased, which can be verified by ISPD and TSDC measurement results.
Figure 7. Schematic illustrations of (a) nanocomposite and (b) molecular morphology of UV/h-Al-x composites, the dotted lines in red represent H-bonding formed between the carboxyl and hydroxyl groups. The interface region models of (c) UV/c-Al-x and (d) UV/h-Al-x composites.
Download figure:
Standard image High-resolution image
Under high electric field stress, the carriers injected from electrodes will be captured by traps at the vicinity between the electrode and sample. A reverse electric field will be formed owing to the accumulation of homogenous charges [41, 42], resulting in the suppression of subsequent charge injection and the mitigation of electric field distortion. The deeper the trap level, the stronger the suppressing effect becomes [43]. Hence, UV/h-Al-1 composites have better suppression of space charge accumulation and the mitigation of electric field distortion than pure UV-cured resin and UV/c-Al-1 composites (shown in figure 4). Moreover, carriers need to overcome a bigger potential barrier after being trapped in a deeper trap, leading to decreased carrier mobility and energy. Thus, UV/h-Al-x composites exhibit remarkably enhanced volume resistivity, improved breakdown strength compared with UV/c-Al-x composites at the same filler content (shown in figures 3(c) and 3(d)). The space charge layer effectively hinders the movement of dipoles, causing a reduction in the dielectric constant at a certain degree. With increasing filler loading, the distance between neighboring particles becomes shorter. In this way, carriers can obtain enough energy from the electric field to hop the barrier between two neighboring particles and transport instead of being restrained in the transition region. The shorter the distance between neighboring particles, the greater the probability to hop the barrier becomes. Thus, the volume resistivity decreased with the increasing content of c-Al2O3 or h-Al2O3 particles. At a large doping concentration (10 wt%), the formation of conductive channels between the interaction areas due to the overlap of the interaction areas resulted in a lower volume resistivity and breakdown strength of the material [37, 39].
4. Conclusion
UV-cured resin based nanocomposites filled with c-Al2O3 and h-Al2O3 nanoparticles were fabricated. The morphology, electrical properties, space charge properties, and trap level distributions of UV/c-Al-x and UV/h-Al-x composites were comprehensively investigated. A model of the interface region based on band theory and the multi-region structure was used to analyze the effect of interfacial strength and traps on the electrical properties. The interfacial strength between filler and matrix was significantly enhanced because of the hydrogen bonds formed by the hydroxyl groups of Al2O3 nanoparticles and the carboxyl groups of the UV-cured resin molecular chain. Thus, much more deeper traps were introduced into the UV/h-Al-x composites. As a result, UV/h-Al-x composites exhibit better space charge suppression characteristics, larger volume resistivity, and higher breakdown strength than that of UV/c-Al-x composites. Lastly, the highest breakdown strength of UV/h-Al-0.5 composite is 68 kV mm−1, which is 15.5% higher than that of the pure UV-cured resin. The maximum volume resistivity obtained by doped 0.5 wt% h-Al2O3 particles increased from 2.18 × 10¹⁶ Ω cm−1 to 10.2 × 10¹⁶ Ω cm−1. The research results are conducive to promoting stereolithography 3D printing in applications within electrical and electronic fields.
Acknowledgments
This work was supported by National Natural Science Foundation of China (U1766218) and by National Basic Research Program of China (973 Program, 2015CB251003).