

Abstract
Gold nanoparticles are widely studied due to the ease of controlled synthesis, facile surface modification, and interesting physical properties. However, a technique for depositing large-area, crack-free monolayers on solid substrates is lacking. Herein is presented a method for accomplishing this. Spherical gold nanoparticles were synthesized as an aqueous dispersion. Assembly into monolayers and ligand exchange occurred simultaneously at an organic/aqueous interface. Then the monolayer film was deposited onto arbitrary solid substrates by slowly pumping out the lower, aqueous phase. This allowed the monolayer film (and liquid–liquid interface) to descend without significant disturbance, eventually reaching substrates contained in the aqueous phase. The resulting macroscopic quality of the films was found to be superior to films transferred by Langmuir techniques. The surface plasmon resonance and Raman enhancement of the films were evaluated and found to be uniform across the surface of each film.
Export citation and abstract BibTeX RIS
Introduction
Deposition of continuous, well-ordered nanoparticle (NP) monolayers over large areas remains an unresolved challenge in nanoparticle processing. A simple strategy to fabricate the NP monolayers involves drop-casting an NP colloid onto a solid substrate. However, non-uniform coffee-ring-like patterns composed of clusters of NPs are usually formed, largely due to the uncontrolled fluid flow during liquid drying [1, 2]. Although a modified drop-casting strategy was used to create monolayer NP film at a liquid–air interface, the film had visible cracks due to the mechanical damage during solvent evaporation and film transfer [3]. Good NP superlattice order can be achieved for some systems by assembling nanoparticles at a liquid–air interface [4]. Langmuir techniques were developed 80 years ago to transfer assemblies from a liquid–air interface to a solid substrate and are still widely used today [5, 6]. For example, ordered arrays of trioctylphosphine oxide-capped CdSe NPs were created by compressing the CdSe NP at a water/air interface to form a close-packed NP film. The film could be transferred to solid wafers by the Langmuir–Blodgett procedure (i.e. dip-coating) [7]. Once formed at the water/air interface, the NP film could also be transferred to the solid substrate by horizontally lifting it off after contacting the NP film (i.e. the Langmuir–Schaeffer method). The Langmuir–Schaeffer method has been found capable of fabricating monolayer films composed of different sized gold NPs [8, 9] and core–shell structure silica NPs [10]. Despite the versatility of Langmuir methods in fabricating NPs of various shapes and sizes, and with different surface coatings [11], the macroscopic film size is limited, due the inevitable mechanical disturbance of the compression process and substrate movement during film transfer. Furthermore, the transfer process is limited by surface interactions between the particles and the surfaces, i.e., if the particles do not wet the surface, transfer does not occur [9].
A more universal technique has been developed to transfer striped nanoparticle assemblies to arbitrary substrates [12]. This approach relies on nanoparticle assembly at a liquid–liquid interface, which allows a wider range of nanoparticle types to be assembled into monolayers [13, 14]. After assembly, the top phase is evaporated. A combination of surface energy effects and fluid dynamics leads to a regular nanoparticle stripe pattern. Finally, the stripe pattern can be transferred to a substrate in a Langmuir-like fashion. This approach, while powerful, does not allow for the deposition of crack-free nanoparticle monolayers.
The deposition of crack-free, well-ordered gold nanoparticle films over large areas are of potential interest for electronic [15–19], photonic [20–22], and sensing [23] applications. For example, surface enhanced Raman spectroscopy is a promising technique for detecting battery electrolyte degradation. Herein, we report a new technique to transfer monolayer NP films onto arbitrary substrates. This technique involves draining the lower liquid phase to allow the NP monolayer to deposit on substrates initially in the lower liquid phase. Due to the eliminated mechanical disturbance during film formation and transfer, our technique was found efficient in creating large-area, crack-free NP monolayers from liquid–air or liquid–liquid interfaces. The quality of these films is evaluated with microscopy and x-ray scattering, and their plasmonic and Raman enhancement properties are examined.
Experiment
Materials
Gold (III) chloride trihydrate (HAuCl4 · 3H2O, ≥99.9% trace metals basis), sodium citrate dihydrate (HOC(COONa)(CH2COONa)2 · 2H2O ≥99%), ethanol (ACS reagent, ≥99.5%), n-hexane (anhydrous, 95%), dodecylamine (CH3(CH2)11NH2, ≥99%), octadecylamine (CH3(CH2)17NH2, 97%), and rhodamine 6G perchlorate (R6G, dye content 99%) were purchased from Sigma-Aldrich and used as received. Deionized (DI) water (18.2 MΩ cm) was supplied by a Millipore water purification system. Gas-tight containers (10 × 10 × 5 cm3, Snapware) were used for interfacial ligand exchange and monolayer self-assembly. For all experiments, glassware was thoroughly cleaned with Piranha solution (Caution: Piranha solution is highly corrosive and reacts violently with organic matter!) at 60 °C. Homemade Teflon wells (with inner dimensions 5 × 2 cm2 and depth of 1.5 cm) and Teflon coated magnetic stir bars (VWR) were cleaned using acetone followed by THF. All glassware, stir bars, and Teflon wells were rinsed with DI water and oven-dried overnight at 100 °C before use.
Au NP preparation
Aqueous Au NPs were prepared using a modified Turkevich method [24]. Aqueous solutions of HAuCl4 (200 ml, 0.5 mM) and sodium citrate (10 ml, 38.8 mM) were brought to boiling separately. Then the latter was rapidly added to the former under vigorous stirring, followed by boiling for another 20 min until the color remained constant. Afterwards, the as-synthesized Au NP colloid was diluted to 75 vol% with DI water.
Au NP film fabrication
Two pieces of glass slides (18 × 18 mm2) (Ted Pella) were placed in a Teflon well, which was housed in a gas-tight container. Other substrates (silicon wafers, copper grids) were fixed to the glass slides using a small piece of carbon tape. Aqueous Au NP colloid (5 ml) was transferred to the Teflon well followed by 2 ml of alkylamine/hexane solution (figure 1(a)). A water/organic interface (with water phase at bottom) was formed due to the immiscibility of the two liquid phases. After capping the gas-tight container, an ethanol solution (2 ml, 75 vol% in DI water) was added via syringe at 0.5 ml min−1 (controlled by a peristaltic pump, Masterflex L/S). As shown in figure 1(b), a golden sheen layer formed at the water/organic interface.

Figure 1. (a)–(d) Schematic illustration of the Au NP film formation and deposition (upper panels) and the corresponding optical images (lower panels).
Download figure:
Standard image High-resolution imageA syringe needle was inserted to the bottom of the Teflon well through a small port on the gas-tight lid. The aqueous subphase was slowly removed through the syringe (0.05 ml min−1, shown in figure 1(c)). The NP film and water/organic interface dropped at a rate of 5 × 10⁻³ cm min−1 until the NP film deposited on the substrates (figure 1(d)). The remaining amine/hexane solution was also removed after film deposition. It is worth noting that only a tiny portion of the entire Au NP film around the syringe needle tip (around 0.2 mm2) was lost to the pumping procedure. After deposition, the gas-tight lid was replaced with a lid comprising a 5 × 5 array of holes (with single hole diameter 0.2 mm and hole-to-hole distance 1 cm). The residual water slowly evaporated from the Au NP film over a period of 48 h.
Characterization
A transmission electron microscope (TEM, JEOL JEM-2011) was used to collect micrographs of the Au NP film deposited on a carbon coated copper grid (200 mesh, Ted Pella). The accelerating voltage was 200 kV. The interparticle space (dc-c) of each film was analyzed using an autocorrelation function (SI). At least five TEM images on different locations were analyzed for the alkylamine-Au NP films.
Grazing incidence small angle x-ray scattering (GISAXS) experiments were carried out at beam line 8-ID-E, Advanced Photon Source at Argonne National Laboratory. The energy of the x-ray beam was set at 7.35 keV, corresponding to a wavelength of 1.686 nm. The Au NP monolayer on silicon wafers were tilted at an angle of 0.2°. Scattering patterns were recorded by an x-ray charge-coupled device area detector at a distance of 1474 mm from the sample. The data was reduced using the 'NIKA' [25] package for Igor pro. A horizontal line cut was taken at a fixed qz = 0.74 nm−1 in order to reduce the GISAXS data to a one-dimensional scattering profile. For qz values from 0.3 nm−1 to 0.8 nm−1, the 1D scattering profile was not sensitive to the specific location of the horizontal line cut.
The ultraviolet–visible–near infrared (UV–vis–NIR) spectrum (350 nm–1200 nm) of each Au NP film was collected from a UV–vis–NIR spectrophotometer (Agilent, Cary 5000) with the incident beam perpendicular to the sample surface. A blank glass slide background was subtracted from each spectrum. Spectra were collected from 3 to 5 locations on each film.
Raman spectra were recorded by a confocal Raman microscope (inVia Renishaw), equipped with a 785 nm diode laser source (300 mW full power). The laser power at the sample position was set to 2.5 mW. Two accumulations of 10 s exposure time were performed for each sample. The Raman spectra were analyzed by Renishaw's WiRE 3.4 software. R6G was used as the Raman reporter. R6G was drop cast from ethanol solution, using the solution concentration to control the R6G surface coverage. A drop of freshly-made R6G solution (0.5 μl) was transferred onto a silicon wafer or the Au NP film and dried under ambient conditions before each measurement.
Results and discussion
Figure 1 illustrates the formation and deposition process of Au NP film using a 'drain-to-deposit' protocol. Aqueous Au NPs are electrostatically stabilized by negatively charged citrate ions that are generated during synthesis [26]. Upon addition of ethanol, a thin layer of mirrorlike film gradually formed (figure 1(b), lower panel), indicating that Au NPs segregated to the hexane/water interface [14, 27, 28] where the alkylamine ligands can attach to the Au NP surface, displacing citrate ions. According to Pieranski, the change in total interfacial energy (Helmholtz free energy) due to the translocation of a single nanoparticle from the aqueous phase to the organic/water interface can be written as [29]
Here,  is the interfacial energy at the organic/water interface,
  is the interfacial energy at particle/water interface, and
  is the interfacial energy at the particle/organic interface. From equation (1), the total Helmholtz free energy change of the colloidal Au NPs must be negative for them to transfer to the organic/water interface. Thus, the minimization of the total free energy offers the driving force for the translocation of the Au NPs from the aqueous bulk to the organic/water interface.
A similar Au NP film has been shown to have a Janus structure, of which the top face (facing to the hexane phase) is passivated with hydrophobic alkylthiol ligands, while the bottom face (facing to the water phase) is still negatively charged with citrate ions (figure 1(b) inset) [14].
The driving force for NP entrapment is the decrease of surface energy, which can be derived as a function of the contact angle (Θ) of NP films [28, 30, 31]. Dispersed in water, hydrophilic Au NPs have negative surface charge due to the citrate ions, with a water contact angle smaller than 90°. The introduction of ethanol decreases the NP surface charge density (ρe), likely resulting from the competitive replacement of citrate ions with ethanol molecules [28, 32]. The introduction of ethanol also causes the contact angle to approach 90°, leading to the entrapment of NPs in the hexane/water interface [28, 33]. It has been found that addition of ethanol alone does not completely neutralize NP surface charge (i.e., ρe > 0) [28]. The residual electrostatic repulsive force due to the remaining surface charge can keep the Au NPs apart so as not to agglomerate, but large voids are often observed [27, 28]. Further attachment of amine ligands can consequently reduce NP surface charge density, ρe. As will be shown, this further reduces the total number of voids [27]. In order to preserve the long-range order of the films, we developed a new deposition method, 'drain-to-deposit', as shown in figure 1(c). All other reported instances of transferring interfacially assembled Au NP monolayers have relied on Langmuir methods, i.e., moving the substrate. The slow downward movement of the interface onto a stationary substrate decreases the mechanical disturbance and better maintains film integrity. Eventually, a film of Au NPs and residual solvent deposits on the substrates and any exposed portions of the bottom of the Teflon well. Both the as-deposited film and the dried film are metallic in appearance and gold in color. The presence of a metallic sheen suggests that the film has finite electrical conductivity. The fact that the deposition technique is insensitive to substrate material demonstrates its versatility.
Using this protocol, monolayer alkylamine-Au NP films of large area have been deposited. Shown in figure 2 (middle), severe cracks across the C18-Au NP film were manifest when the film was deposited onto the glass slide using a traditional Langmuir–Blodgett method (i.e. vertically lifting the glass slide from underneath the Au NP film). In sharp contrast, no visible cracks were observed along these continuous films (figure 2 right), showing the ability of the 'drain-to-deposit' protocol to fabricate large area monolayer Au NP films.
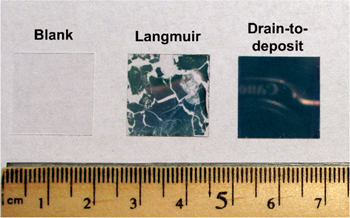
Figure 2. Optical image of the comparison between octadecylamine-Au NP monolayer films deposited on glass slides by the Langmuir–Blodgett method and by the 'drain-to-deposit' method.
Download figure:
Standard image High-resolution imageIn addition to using the 'drain-to-deposit' strategy to maintain film integrity, it was important to retain the water/hexane interface by preventing hexane evaporation until after the film was deposited on the solid substrate. The hexane/water interface offers a 'soft template' to retain the integrity of the NP film through the film deposition process. Through this 'soft template', constituent Au NPs could adjust their relative position in the film in order to maintain superlattice order. Hexane evaporation in the absence of a solid substrate caused instability in the film. In fact, severe film cracking was observed in our study when drying the top hexane phase before depositing the film on substrates. Such films showed a 'parallel strip' morphology (figure S1), further indicating the negative effect of hexane evaporation on the microscopic quality of the monolayer Au NP film. It should be noted that a Langmuir–Blodgett approach to compress the strips of the monolayer film would lead to fractal stacks or multiple-layers rather than a well-ordered monolayer [34]. This emphasizes the novelty of our approach, which results in a monolayer without any visible cracks (figure 2, right).
TEM images were used to explore the local ordering of the film deposited with the 'drain-to-deposit' protocol. As shown in figures 3(a)–(d), a well-ordered hexagonal closed packed (HCP) structure of just a single layer could be observed for both dodecylamine-Au NP film (C12-Au NP film) and octadecylamine-Au NP film (C18-Au NP film). The HCP order of the film is also confirmed by the corresponding fast Fourier transforms (figure 3, insets). The presence of Bragg spots instead of diffuse rings are apparent, demonstrating the long-range order of both alkylamine-Au NP films.

Figure 3. TEM micrographs of single layer (a) C12-Au NP film and (b) C18-Au NP film. (c) and (d) are TEM images of larger magnification corresponding to (a) and (b), respectively, with the inset images showing the respective Fourier transform. The scale bar is 100 nm for (a) and (b), and 20 nm for (c) and (d). (e) The plots of pair autocorrelation function versus radial distance of C12-Au NP film and C18-Au NP film on the basis of TEM images. The primary peak is indicated by an arrow, where the radial distance corresponds to the Au NP center-to-center distance, dc-c.
Download figure:
Standard image High-resolution imageCompared with the Au NP films fabricated by interfacial self-assembly technique without applying organic ligand, the number of void areas on the alkylamine-Au NP films was significantly decreased [28, 31]. The possible explanation could be sketched as follows. It has been well accepted that interaction energy among Au NPs,  can be calculated by [33]

Where ψvdW(dc-c) is the van der Waals attraction potential, ψelec(dc-c) is the electrostatic repulsion potential and ψster(dc-c, l) is the steric elastic repulsive energy from the entropy loss that occurs on compression of the stabilizing ligands. The addition of the alkylamine ligands can further reduce the NP surface charge density,  until the van der Waals attraction potential, ψvdW(dc-c), the electrostatic repulsion potential, ψelec(dc-c) and ligand-induced steric repulsive energy, ψster(dc-c, l), reaches a new balance [35]. Without applying organic ligand (i.e. ψster(dc-c, l) ≈ 0), the Au NP electrostatic repulsion potential, ψelec(dc-c) cannot be well balanced solely by van der Waals attraction potential, ψvdW(dc-c), thus creating void areas in the Au NP film. This theory can also be employed to explain the fact that C18-Au NP film has a better ordering than C12-Au NP film, as manifest in the magnified TEM images (figures 3(c) and (d)). Figure 3(c) shows that a small portion of the C12-Au NPs appeared to be touching, indicating insufficient repulsive force is offered by dodecylamine. With an increased ligand length, octadecylamine provides the Au NPs with enhanced steric repulsive energy, ψster(dc-c, l), and hence a better film ordering. However, there is an optimal amount of residual electrostatic repulsion needed to maintain film ordering. This is demonstrated by the fact that an optimized concentration of ligand in hexane was needed to form monolayers. The alkylamine molar concentrations were optimized at 1 × 10⁻² mM for C12-NH2 and 2 × 10⁻⁴ mM for C18-NH2. Concentrations below the optimized values resulted in voids in the Au NP films, possibly due to an excess of residual electrostatic repulsion. Concentrations above the optimized ligand concentration led to multi-layer Au NP films. More detailed explanations on the film ordering and concentration effect can be found in our follow-up study [36].
The uniform and consistent distribution of the interparticle-space across the Au NP film is an important indication of good NP film ordering. In order to statistically assess the ordering of the monolayer Au NP films based on the TEM images, a pair autocorrelation function, g(r), was used to describe how the particle areal density varies as a function of the radial distance from an arbitrary Au NP (see supporting information) [37]. The primary peak position of the autocorrelation function, as labeled by an arrow for each film in figure 3(e) indicates the representative Au NP center-to-center distance, dc-c for each Au NP film (also see table 1). The particle spacing is larger for the C18-Au NP film than for the C12-Au NP film, which is to be expected due to ligand length. Furthermore, the primary peak intensity is larger and peak width is smaller for the C18-Au NP film than for the C12-Au NP film, which indicates that the C18-Au NP film has better local order. In addition, the existence of higher order peaks manifests the periodic arrangement of the constituent Au NPs in the monolayer films [38].
Table 1. The Au NP center-to-center distance, dc-c and the interparticle (edge-to-edge) distance, d, calculated on the basis of the pair autocorrelation function of each Au NP film.
| Sample | Primary peak, dc-c (nm) | Interparticle distance, d (nm) |
|---|---|---|
| C12-Au NP Film | 14.7 ± 0.4 | 2.0 ± 0.4 |
| C18-Au NP Film | 15.7 ± 0.2 | 3.0 ± 0.2 |
Since the TEM analysis is only capable of offering the localized ordering of the Au NP films, we further employed GISAXS to evaluate the global ordering of the Au NP film and quantify interparticle separation for each alkylamine-Au NP film (figure 4). Figures 4(a) and (b) show 2D GISAXS patterns of C12-Au NP and C18-Au NP films, respectively. The Bragg rod pattern and higher-order peaks are apparent in both figures, indicating good long-range order for both Au NP films. The Bragg peaks are labeled by green arrows, with the Miller indices (10), (11), (20) and (22) representing the corresponding 'crystal plane' in the Au NP lattices. Shown in figure 4(c), the (10) plane spacing, d10 can be calculated by Bragg's law

qy is the value of the scattering vector along the y direction. It was obtained from the (10) peak in the 1D GISAXS profile (figure 4(d)). The geometric relationship of the Au NP center-to-center distance, dc-c, interparticle spacing, d, and (10) inter-planar distance, d10, are sketched in figure 4(c). A uniform 2D HCP lattice constant (dc-c) is assumed for the monolayer Au NP film protected by each alkylamine ligand, so that dc-c is calculated as

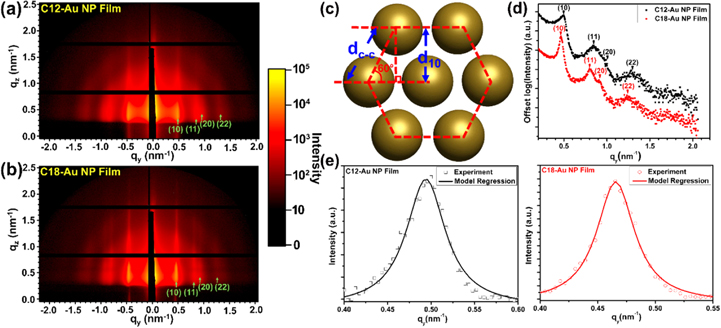
Figure 4. The 2D GISAXS patterns for the single layer (a) C12-Au NP film and (b) C18-Au NP film. Different diffraction positions, (10), (11), (20) and (22) are marked by green arrows. (c) Schematic of the HCP structure formed by Au NPs and the geometric relationship between (10) plane space, d10 and the interparticle distance, dc-c. (d) Representative horizontal line cuts along the qy axis at qz = 0.74 nm−1. The primary (10) peak indicates the distance between two neighboring (10) planes, d10 in each single layer Au NP film. (e) The (10) scattering peaks of C12-Au NP film and the C18-Au NP film with corresponding Lorentzian model regression.
Download figure:
Standard image High-resolution imageThe ratio of the qy values at (10), (11) and (20) for each film is close to 1 (table S1), further confirming the 2D HCP superlattice structure of the monolayer Au NP films in this study.
The interparticle space (i.e. minimum edge-to-edge distance) can thus be determined by

where r is the radius of the NP core. The average NP radius in our study is 6.4 ± 0.6 nm based on a previous report [24].
The calculated values of d10, dc-c and d are documented in table 2. From tables 1 and 2, it is clear that the lattice constant of the nanoparticle HCP unit, and the interparticle space measured from the pair autocorrelation function agrees very well with those calculated from the 1D GISAXS profile. Due to the smaller surface ligand length, the average interparticle distance of C12-Au NP film is 1 nm smaller than that of the C18 Au NP film, indicating that the 'drain-to-deposit' strategy could be used to deposit large area monolayer Au NPs with tunable interparticle spacing by simply applying alkylamine ligands of different carbon chain lengths. This point will be demonstrated more thoroughly in another report.
Table 2. The (10) plane spacing, d10, Au NP HCP lattice constant, dc-c and the interparticle (edge-to-edge) distance, d, calculated from 1D GISAXS profile for both Au NP films.
| Sample | (10) Plane spacing, d10 (nm) | Lattice constant, dc-c (nm) | Interparticle edge distance, d (nm) |
|---|---|---|---|
| C12-Au NP Film | 12.7 ± 0.7 | 14.6 ± 0.8 | 1.9 ± 0.8 |
| C18-Au NP Film | 13.6 ± 0.5 | 15.7 ± 0.6 | 3.0 ± 0.6 |
In order to better evaluate the ordering of the Au NP film, we further analyzed the corresponding (10) peak. Shown in figure 4(e), after background correction, the (10) Bragg peak profiles of both films were fitted to a Lorentzian function [39]

with qymax the scattering vector at the peak maximum, Γ the full width at peak half maximum (FWHM) and Ibk the background of the scattering intensity. The fitting parameter A is related to peak height, H, by A = H · π · Γ. The fitted FWHM for the (10) Bragg peak of the C12-Au NP film is 0.055 ± 0.002 nm−1 and that for C18-Au NP film is 0.040 ± 0.001 nm−1. The smaller FWHM value for C18-Au NP film indicates a narrower (10) plane space distribution, i.e. the C18-Au NP film has a better ordering than C12-Au NP film. The reason for the Au NP film ordering increasing with the amine ligand will be explained in details elsewhere [36].
The FWHM can also be employed to estimate the average superlattice grain size in the Au NP films with the Scherrer equation in reciprocal space [40]

where D10 is the average grain size of the Au NP film and K is the Scherrer constant, which could be estimated at 0.9 [41]. The estimated HCP grain size is 103 nm for the C12-Au NP film and 141 nm for the C18-Au NP film. Based on the optical images and detailed analysis of the inter-particle space and film ordering from the TEM images and 1D GISAXS profile of the monolayer Au NP films, it is easily seen that the monolayer Au NP films fabricated by using 'drain-to-deposit' method has both unprecedentedly macroscopic ordering (i.e. crack-free) and satisfactory localized well-ordered structure (i.e. HCP superlattice).
We have demonstrated that the Au NP films can be deposited in larger area with decent tunability of interparticle space using the 'drain-to-deposit' strategy. The consequent surface plasmon characteristics of these films are of equal interest. It has been found in many studies that, when an incident light interacts with noble nanoparticles, a strong optical resonance phenomenon can be observed due to the collective oscillation of conducting electrons on the nanoparticle surface, which is characterized as the localized surface plasmon resonance (LSPR) [22, 42, 43]. The LSPR has been confirmed especially relevant to the nearly touching, small nanoparticle arrays [20, 44]. The UV–vis–NIR spectra of monolayer alkylamine-Au NP films prepared on glass slides are presented in figure 5. The surface plasmon resonance (SPR) peaks are red-shifted with respect to the SPR of aqueous Au NPs of the same size (519 nm). The broad tail in the near-infrared window was believed due to the near-field coupling between nanoparticles [45]. As the interparticle space, d, reduced from 3.0 ± 0.6 nm for C18-Au NPs to 1.9 ± 0.8 nm for C12-Au NPs, the SPR maximum experienced a significant red-shift from 645.2 ± 3.4 nm to 672.2 ± 2.2 nm. The SPR peak shift with decreasing lattice spacing observed here is in good agreement with a theoretical prediction [46] as well as other similar experimental studies [20, 47]. It is thus seen that the method developed in this study holds great promise in scaling up nanoparticle array photonic and plasmonic devices with flexible tunability [36, 47, 48].
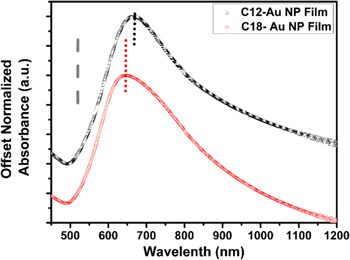
Figure 5. UV–vis–NIR absorbance spectra of monolayer Au NP films. The dashed line indicates the SPR maximum of the original aqueous Au NP colloid (519 nm), whereas the dotted lines show the SPR maximum of the alkylamine-modified Au NP films on glass slides.
Download figure:
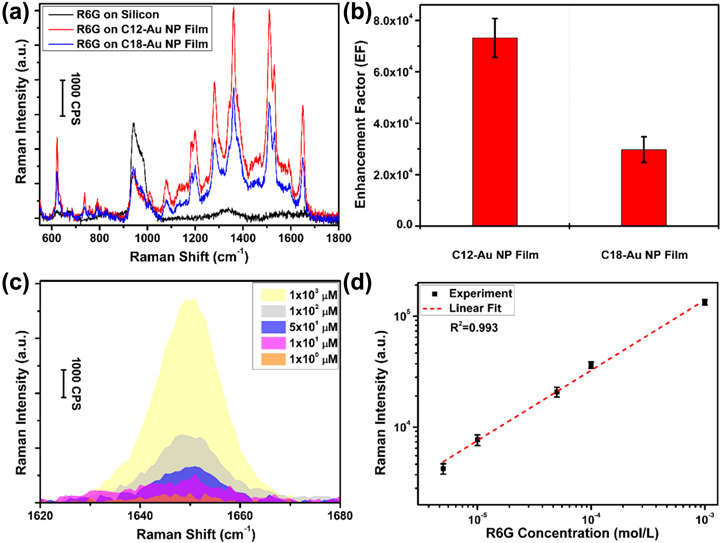
Standard image High-resolution imageSurface-enhanced Raman scattering (SERS) is a field-enhanced spectroscopic technique with great potential for sensing molecules of interest [50]. It is commonly accepted that the SERS effect is strongly related to the electromagnetic (EM) enhancement which results from the LSPR of the substrate, where the enhancement is focused in 'hot spots' [51, 52]. Despite intensive research efforts dedicated in designing the SERS substrates, it still remains a challenge to develop substrates with uniform and tunable Raman enhancement. Therefore, reproducible, quantitative SERS measurements are not possible [50, 53]. We demonstrate that the monolayer Au NP films fabricated in our study show uniform SERS properties. Figure 6(a) shows a set of Raman spectra collected from different substrates coated with 0.5 μl of 100 μM R6G solution. Compared with the Raman scattering of R6G on silicon wafer, the SERS spectra of R6G on monolayer C12-Au NP film and C18-Au NP film both show prominent Raman bands of R6G. A formula to calculate the Raman enhancement factor (EF) was used to quantitatively analyze the Au NP film enhancing performance [54]

where  is the integration of the background-corrected enhanced Raman peak at a certain chemical band, and
  is the integration of the normal Raman spectra collected from R6G on silicon wafer at the corresponding chemical band. The aromatic C–C stretching at 1650 cm−1 was chosen as the model band to calculate the EF. As shown in figure 6(b), the EF of the monolayer C12-Au NP film is around 7.3 × 10⁴, which is 2.4 times that for C18-Au NP film at 3.0 × 10⁴. This could be explained by the interparticle space dependent SERS efficiency in the EM coupled nanoparticle arrays with a simple model [55]

where A and B are positive fitting constants, r is the average Au NP radius and d is the interparticle minimum edge-to-edge distance. Approximating the nanoparticle radius, r, as much greater than interparticle distance, d, the ratio of SERS signal from the two films can be estimated as:
Figure 6. (a) SERS spectra of R6G on C12-Au NP film and on C18-Au NP film. Normal Raman spectrum was taken from R6G on silicon wafer as a reference. All samples were prepared by drying R6G/ethanol solution (0.5 μl, 100 μm) on the corresponding substrate. (b) Calculated Raman enhancement factors for C12-Au NP film and C18-Au NP film. (c) SERS spectra of the R6G dried from ethanol solution of various concentrations on C12-Au NP film. (d) The calibration curve of Raman intensity as a function of the R6G concentration for C12-Au NP film. Data points were averaged on a basis of five measurements for each concentration, and the error bars represent the related standard deviation.
Download figure:
Standard image High-resolution image
With the same Au NP size (2r = 13 nm), the ratio of the SERS intensities estimated from this model is 2.6. This is in reasonable agreement with the experimental result and demonstrates that the SERS intensity increases with decreasing interparticle distance. Therefore, our method is capable of fabricating large-area, SERS-active substrates with flexible EF tunability.
In order to test the homogeneity of the SERS performance of the Au NP films, we chose different locations within the same sample adsorbed with R6G to carry out the Raman spectroscopy measurements. The SERS spectra and intensity (at 1650 cm−1) are very similar (shown in figure S2), indicating a homogeneous and consistent Raman enhancing performance.
In order to assess the quantitative accuracy of our SERS substrates, concentrations of R6G solutions ranging from 1 μM to 1 mM were deposited on C12-Au NP films and dried. As shown in figure 6(c), the Raman peak intensity at 1650 cm−1 decreases with decreasing initial R6G solution concentration. The integrated intensity of the Raman peak at 1650 cm−1 is plotted versus initial RG6 solution concentration in figure 6(d). This log–log calibration curve exhibits a significantly more linear relationship than a similar SERS study performed on silver nanoparticles [56]. Based on the diameter of the droplet placed on the substrate, the areal density of RG6 ranged from 7 × 10⁻¹⁴ mol mm−2 to 7 × 10⁻¹¹ mol mm−2. These results indicate that the large-area monolayer Au NP films developed in our study can be used as a Raman enhancing substrate to quantitatively detect molecules of interest at low concentration.
Conclusion
To conclude, we have demonstrated a unique approach to obtain crack-free, large-area, ordered 2D Au NP films. The process involves self-assembly of Au NP films at water/hexane interfaces assisted by alkylamine ligands. A 'drain-to-deposit' strategy was applied to transfer the films from water/hexane interface to solid surfaces. The long-range ordering of the 2D Au NP films was preserved due to the existence of the soft template (water/hexane interface) during the entire transfer process. A comprehensive study on the local ordering, together with the global ordering has been performed using TEM and GISAXS techniques. Due to the excellent long-range ordering, the resulting Au NP films have shown great potential in fabricating photonic and plasmonic devices based on the near-field LSPR in a scaled-up manner. Based on the spatially well-distributed hot spots, the Au NP films have shown great potential in functioning as uniform, reproducible and quantitative SERS-active substrates.
Acknowledgments
This research was supported by start-up funding supplied by the Florida State University and the FAMU-FSU College of Engineering. We thank Y Su and Y Xin for support in conducting TEM at the National High Magnetic Field Laboratory (TEM is supported by National Science Foundation Cooperative Agreement No. DMR-1157490 and No. DMR-0654118 and the State of Florida). We thank J Strzalka, S Ramakrishnan, J Che and Golda C L for assistance in GISAXS experiments at Argonne National Laboratory's Advanced Photon Source, beamline 8-ID-E. Argonne National Lab's Advanced Photon Source is supported by the US Department of Energy (DOE) under Contract No. DE-AC02-06CH11357. We thank R Liang and J G Park for fruitful discussion and helping with the Raman spectroscopy. We thank B Ma and Y Tian for support in UV–vis-NIR measurement. We thank S Hellstrom for helping with grammar and spelling check.