
Abstract
The effect of the recently developed graphene nanoflakes (GNFs) on the polymerase chain reaction (PCR) has been investigated in this paper. The rationale behind the use of GNFs is their unique physical and thermal properties. Experiments show that GNFs can enhance the thermal conductivity of base fluids and results also revealed that GNFs are a potential enhancer of PCR efficiency; moreover, the PCR enhancements are strongly dependent on GNF concentration. It was found that GNFs yield DNA product equivalent to positive control with up to 65% reduction in the PCR cycles. It was also observed that the PCR yield is dependent on the GNF size, wherein the surface area increases and augments thermal conductivity. Computational fluid dynamics (CFD) simulations were performed to analyze the heat transfer through the PCR tube model in the presence and absence of GNFs. The results suggest that the superior thermal conductivity effect of GNFs may be the main cause of the PCR enhancement.
Export citation and abstract BibTeX RIS
1. Introduction
Nanoparticle assisted PCR is a relatively new area of research in the field of nano-biotechnology. The idea of adding nanoparticles to a polymerase chain reaction (PCR) [1–3] to enhance its efficiency and specificity has attracted researchers' interest. A number of nanoparticles including metallic ones [4, 5], oxides [6], carbon nanotubes (CNTs) and carbon nanopowder [7–9] have been intensively used. It was reported that the addition of an optimal concentration of nanoparticles results in enhanced yield (or PCR efficiency), enhanced specificity [9–11] and reduction in the overall reaction time [12]. Although a few mechanisms have been proposed for these enhancements, the underlying basis is still unclear and needs further study.
The enhanced heat transfer effect of nanoparticles is a common perception of these reports [4, 12]. The rationale behind this conjecture is that the addition of nanoparticles in base fluid results in enhanced thermal conductivity effect, which allows the DNA, Taq DNA polymerase and other reagents to interact more efficiently. Therefore, further studies using more efficient thermally conductive materials can further substantially enhance PCR. Herein, we will use the term 'NANO-PCR' to refer to nanoparticle assisted PCR. The term does not indicate the scale at which PCR is performed.
In this study, we have examined PCR with recently discovered GNFs [13]. Its single layer of atomic carbon and theoretical specific surface area is up to 2600 m2 g−1 [14]. It has excellent in-plane thermal conductivity up to 5200 W m−1 K−1 [15]. Outstanding properties of graphene include the quantum Hall effect, high values of Young's modulus, mobility of charge carriers and fracture strength [16]. We have used various techniques to characterize GNFs which have been used in PCR. In addition, the thermal conductivity of graphene nanofluids was measured at room temperature (25 °C) and 60 °C. The PCR results show that graphene can be a potential PCR enhancer under optimized conditions.
2. Materials, methods and characterization
2.1. Preparation of graphene nanofluids
GNFs of 8 nm thickness (20–30 ML) and average particle (lateral) size ∼550 nm from Graphene Labs were suspended in molecular-biology-grade distilled water at 1 mg ml−1 concentration. The density of graphene flakes was 1.9, 2.0 and 1.9 g cm−3 for 60, 12 and 8 nm respectively. To ensure proper mixing of the nanoparticles in water, sonication was performed for 2 h using a bath-sonicator (JEOL). This well dispersed nanofluid was used as a stock solution and was appropriately diluted to various concentrations. UV–vis spectroscopy (PerkinElmer Lambda 35 spectrophotometer) was performed to confirm the characteristic peak of the samples. Absorbances of 0.06, 0.08 and 0.1 wt% were measured and the data analysis software Origin 2 was used to plot graphs. The pH was measured (Mettler-Toledo) after the stock was diluted to appropriate concentrations required for PCR.
2.2. Scanning electron microscopy (SEM)
The graphene samples were mounted on stubs with conductive carbon tape and coated with platinum using a JEOL JFC-1600 auto fine coater. All samples were analyzed for their physical-structure and elemental compositions with energy-dispersive x-ray spectroscopy (EDX) using SEM (JEOL JSM 6400 LV).
2.3. Differential scanning calorimetry
Differential scanning calorimetry (DSC) was performed using a Sapphire DSC, PerkinElmer Instruments. The temperature of the sample and the reference were maintained almost the same throughout the experiment. During analysis, the temperature of the sample holder was increased linearly as a function of time.
2.4. Thermal conductivity measurements
We measured the thermal conductivity of the GNF nanofluids using a KD2 Pro portable thermal conductivity meter (Decagon Devices). The transient line source (TLS) uses a sensor (single needle with 1.3 mm diameter and 60 mm in length) for measurements. A measurement cycle consists of 30 s of each equilibration, heating and cooling time. Standard glycerin was used for calibrating the device. The temperature measurements were made at intervals of 1 s during both heating and cooling. Measurements are then fit with exponential integral functions using a non-linear least squares procedure. A linear drift term corrects temperature changes of the sample during the measurement, to optimize the accuracy of the readings. A thermostat bath was used to maintain the temperature of the nanofluids. Nearly five readings per temperature were taken to ensure uncertainty in measurement within ±5%. The experimental values of GNF nanofluid thermal conductivity were compared with theoretical values for verification. The effective thermal conductivity of solid–liquid mixtures has been calculated using the classical Maxwell model [17],

where kp is the thermal conductivity of solid particles, kb is the thermal conductivity of the base fluid and ϕ is the particle volume fraction.
2.5. PCR methodologies
PCR was carried out to amplify segments of DNA using gene-specific primers (table 1). Optimization and amplification of these DNA segments were performed using PCR master mix (2×) from Fermentas. The typical 25 μl PCR reaction mixture contained the following final concentrations: 12.5 μl of master mix that includes 0.05 units μl−1 Taq DNA polymerase in reaction buffer, 4 mM MgCl2, 0.4 mM dATP, 0.4 mM dCTP, 0.4 mM dGTP and 0.4 mM dTTP, 1 μM of each forward/reverse primer and 10–20 ng of template DNA with or without different concentrations (0.1–3.2 nM) of nanoparticles. The PCR protocol began with a 94 °C denaturation step for 5 min, followed by a touchdown program (94 °C denaturing step for 30 s followed by initial annealing temperature of 70 °C to avoid amplification of nonspecific regions, subsequently run down to 55 °C at 1 °C/cycle, and a 72 °C extension step for 1 min), followed by a uniform three-step amplification profile (94 °C denaturing step for 30 s, 54 °C annealing step for 30 s, 72 °C extension step for 1 min) for another 30 cycles, then 72 °C for 10 min, and finally held at 4 °C.
Table 1. Primers used for PCR amplifications.
| Forward primer: sequence, GC content, Tm | Reverse primer: sequence, GC content, Tm | Amplicon size |
|---|---|---|
| EGlclnF 5'-TTCGAAATGCAGACCCCCGAC-3' | EGlclnR 5'-CACGCTCAGCCCTTACAAGCG-3' | 1248 bp |
| Tm: 51.2 GC content: 57.14% | Tm: 53.1 GC content: 61.90% | |
| TAMPCF3 5'-GGTACCATGGGTATGAATCCGCTTTTC-3' | TAMPCR3 5'-TCTAGATCAACTCCTCGGCAACGCG-3' | 780 bp |
| Tm: 54.6 GC content: 48.14% | Tm: 55.9 GC content: 56.0% |
PCR reactions were carried out using a thermocycler with maximum ramping rate of 2.5 °C s−1 (Eppendorf Mastercycler gradient). After PCR, products were analyzed in agarose gels (1.1% wt/vol) and visualized with ethidium bromide staining. In addition, the amplified PCR products were quantified using ImageJ 1.41o software (National Institutes of Health). The band intensities were expressed as arbitrary units (AU) after densitometric scanning of the gel images generated by loading equal volumes of PCR products.
3. Results and discussion
3.1. Characterization
The characteristic spectra of graphene nanofluids (8 nm) were observed for concentrations such as 0.1, 0.06, 0.08 w/w%. The absorbance was increasing with the increase in concentration and a peak was observed at approximately 225 nm wavelength (figure 1). This measured absorbance is in good agreement with the literature [18], confirming the presence of graphene as quoted by the supplier. GNFs are hydrophobic in nature and cannot mix with polar solvents such as water. GNFs start to settle within a few hours of synthesis. Functionalization is essential to obtain stable solutions; however, all the experiments were performed using freshly prepared GNF nanofluids. After a week the GNFs were found to significantly settle and the supernatant was used to measure the characteristic spectra, which revealed a peak at 225 nm wavelength. The DSC plots were also obtained using the procedure as mentioned in the methodology section (figure 1). The pH of 0.01 wt% GNF nanofluids was found to be ∼5.45 at 27 °C, confirming the acidic nature of the nanofluids added to the PCR reagents. SEM images with 2 μm magnification show that the flakes are rather bigger than what is claimed by the supplier (figure 2). The 0.005%–0.05% volume fraction graphene nanofluids were only stable for less than 5 h, and so gum arabic (GA) was added as a surfactant in five different concentrations ranging between 0.5 and 2.5 wt%. Compared to CNT nanofluids, which exhibit excellent stability with similar GA addition [19], GNF nanofluid stability is not enhanced significantly with the addition of 2.5 wt% GA. However, other surfactants such as CTAB, SDS, Triton, etc. may also help in enhancing the stability. Besides, functionalization has improved stability of various nanofluids including graphene and may be used in this context [20].
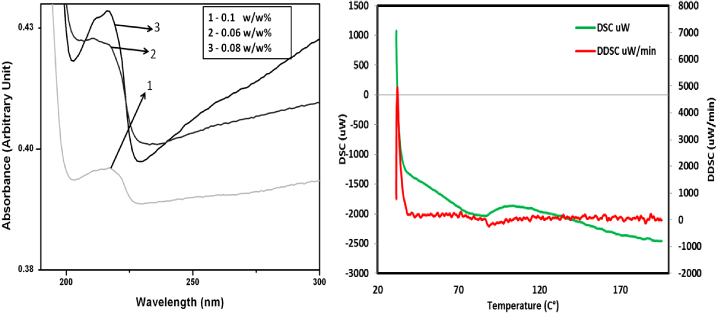
Figure 1. Left: UV–vis spectroscopic image of GNF nanofluids using 0.1, 0.06 and 0.08 w/w%. The observed spectrum has the peak at ∼225 nm. Right: DSC and DDSC curves for the dry GNFs with temperature between 25 and 200 °C.
Download figure:
Standard image
Figure 2. Scanning electron microscope (SEM) images A, B and C of 8, 12 and 60 nm thickness respectively.
Download figure:
Standard image3.2. Enhanced thermal conductivity of GNFs nanofluids
Experimental results confirm that the thermal conductivity of graphene nanofluids is strongly temperature and nanoflake concentration dependent (figure 3). Using 0.05 and 0.005% volume fractions we observed superior thermal conductivity to the literature values [20]. The reasons for this excellent enhancement may be attributed to graphene's large surface area [11, 21], dispersion of nanoflakes [22] and Brownian motion of GNFs [23, 24]. Graphene oxide nanosheets were found to enhance thermal conductivity of water up to 30.2% when suspended at 5.0 vol% [18]. Similarly, ethylene glycol based nanofluids show an enhancement of 61.0% with 5.0 vol.% volume fraction [25]. Most of the nanofluids exhibit particle volume fraction and temperature dependent thermal conductivity [23, 26, 27]. However, recent works indicate that the enhancement ratios of the graphene nanofluids are nearly constant with varying temperature, and they are reduced with increasing thermal conductivity of the base fluids [18]. Other research appears to suggest that the thermal conductivity of functionalized and thermally exfoliated graphene (f-TEG) based nanofluids is temperature dependent [20]. The thermal conductivity of f-TEG based nanofluids showed an excellent enhancement up to 60% at 50 °C with a volume fraction of 0.056% in deionized water [20]. It is well known that the higher the temperature the greater is the motion of particles in a fluid [23, 24]. Similarly, elevated temperature might modulate random motion of GNFs in fluid and thus result in considerable enhancement of thermal conductivity. The theoretical thermal conductivity which was predicted using Maxwell's model was much lower than the actual experimental values. Other models also exist in the literature, which involve other parameters in addition to volume fraction, such as particle size, shape [28, 29], interfacial layers [30] etc. However, none of these models takes into account the large surface area of graphene sheets. This suggests that a new model should be developed considering the large surface area of GNFs and layers of flakes.

Figure 3. Thermal conductivity data of GNF nanofluids using 0.05 and 0.005 v/v% at 25–60 °C. The figure explains the enhancement of thermal conductivity of base fluid using GNFs. In addition, the effect of volume fraction and temperature is apparent.
Download figure:
Standard image3.3. Effect of GNFs on PCR
Initially, GNFs suspended in autoclaved distilled H2O were added to test the viability of PCR. Preliminary results showed unambiguous enhancement in the PCR yield (results not shown) of the order of ∼10-fold. A series of experiments with increasing graphene concentrations from 0.001 to 0.1 w/w% was performed in order to find the optimum concentration. Similar to the existing reports on other nanoparticles [4, 7], graphene exhibits strong concentration dependent PCR enhancement as well. The increasing nanoparticle concentration from 0.001 w/w% shows a gradual increase in the PCR yield up to 0.01 w/w% before gradually decreasing with further increase in concentrations as in figure 4(A). On the other hand, PCR was completely inhibited at a GNF nanofluid concentration of ≥0.5 w/w%. The intensities of DNA bands analyzed in agarose gels affirm the role of the enhanced thermal conductivity effect of GNFs in PCR enhancement. As the nanoflake concentration and temperature is increased, thermal conductivity is found to augment. However, the decrease in PCR product after 0.01 w/w% can be attributed to excess temperature as a result of nanoflake addition. Results from PCR experiments were analyzed by densitometry and values are shown in figure 4(A). Experiments revealed that the nanoflake thickness has a significant effect on the PCR product yield. While using identical concentrations of 60, 12 and 8 nm thick GNFs, we discovered that the 8 nm flakes augment yield better than the rest (figure 4(B)). This observation is in agreement with thermal conductivity measurements of GNF nanofluids (results not shown), where the increasing thickness decreases the enhanced thermal conductivity effect. This strongly suggests that there is a great possibility of a role of the enhanced thermal conductivity effect of GNFs. In the recent past, it was observed that AuNPs of larger sizes (20 nm) have stronger inhibitory effect on PCR than AuNPs of smaller sizes (10 and 5 nm) at the same particle concentration [5]. The report proposed a hypothesis, which is the binding of AuNPs and TaqDNA polymerase, resulting in PCR inhibition by reducing the concentration of free polymerase in PCR solution. In another study, it was observed that there is a close match between the specific surface areas of varying sizes of AuNPs at which they exert their effects, even as particle diameter varies by 20-fold and particle volume variation by 8000-fold [31]. They suggest that the differing lines of evidence are against the nanoparticle effects' hypothesis, and PCR is mediated by heat transfer enhancement. Another study explored the fact that the surface effect seems to be the key factor of nanogold assisted PCR while using five different sized Au nanoparticles [32]. To further test the efficacy of the GNFs, PCR reactions with a reduced number of cycles were conducted. As described in the methods section, keeping the 'touchdown' part of the PCR program unchanged, we reduced the 'uniform three-step' number of cycles from 30 to 20 and ten. The electrophoresis gel images of PCR obtained after experimenting with reduced PCR cycles indicate that enhanced yield can be obtained even at ten cycles. This is far superior to any other observation in NANO-PCR. The positive control of both cases (ten and 20 cycles) has yielded comparatively less product (figure 4(C)). Nevertheless, after 30 cycles, positive control yields only ∼10-fold less than GNFs added PCR samples. Further studies are imperative to understand this interesting phenomenon. Li et al [4, 9, 12] showed that the efficiency of PCR has been enhanced by adding Au nanoparticles and reducing its cycle time. Another report explored that the gold nanoparticles could increase the effective PCR amplification cycle, and the single bright band could be achieved even in the sixth amplification cycle [33]. Khaliq et al [12] explored that reduction of the number of cycles from 23 to 18 did not cause any decrease in the amount of amplified product as compared to the control reaction (without nanoparticles) with 23 cycles, suggesting that as many as five cycles can be reduced in the PCR program without compromising the amount of product through the addition of 0.4 nM TiO2 nanoparticles in the reaction mixture.

Figure 4. (A) Agarose gel electrophoresis of PCR products showing concentration dependent effect of PCR amplification using a region (1248 bp) of EG-1. The lane labeled as '+ve' indicates the PCR products obtained under identical conditions without addition of the nanoparticles and the lane labeled as '−ve' indicates the negative control reaction in which water was added instead of template DNA. The lane labeled as 'M' shows positions of the DNA molecular weight markers. Lanes 1 to 9 represent 0.001 w/w%–84.864 AU, 0.002 w/w%–103.13 AU, 0.004 w/w%–115.813 AU, 0.006 w/w%–128.881 AU, 0.008 w/w%–143.143 AU, 0.01 w/w%–154.194 AU, 0.02 w/w%–122.168 AU, 0.04 w/w%–108.839 AU, 0.08 w/w%–99.199 AU, 0.1 w/w%–88.272 AU and 1.0 w/w%–89.343 AU (GNF concentration and band intensities respectively; AU, arbitrary unit). (B) Agarose gel electrophoresis of PCR products showing the effect of the GNFs' size on PCR using (1248 bp) of EG-1. Lanes 1, 2 and 3 represent the product obtained using EG-1 with 0.01 w/w% GNFs of 60 nm, 12 nm and 8 nm respectively. The lane labeled as '+ve' indicates the PCR products obtained under identical conditions without addition of the nanoparticles and the lane labeled as '−ve' indicates the negative control reaction in which water was added instead of template DNA. The lane labeled as 'M' shows positions of the DNA molecular weight markers. (C) The effect of GNFs on reduced PCR cycles is shown in this figure. Lanes 1 and 2 show the product obtained after 10 cycles with and without GNFs respectively. Lanes 3 and 4 show the products obtained after 20 cycles with and without GNFs respectively. (D) Agarose gel electrophoresis of PCR products showing the effect of the GNFs' supernatant on PCR using DNA primers that yield a 1248 bp amplicon. The lane labeled as '+ve' indicates the PCR products obtained under identical conditions without addition of the nanoparticles; S indicates the product obtained using supernatant of GNFs and the lane labeled as '−ve' indicates the negative control reaction in which water was added instead of template DNA. The lane labeled as 'M' shows positions of the DNA molecular weight markers.
Download figure:
Standard image3.4. Enhancement mechanism
A number of possible mechanisms was proposed for the enhancement and/or inhibition of NANO-PCR, such as the interaction of DNA polymerase with nanoparticles [34], the binding of DNA and nanoparticles [35], the electrostatic interaction between the positively charged nanomaterials and the negatively charged PCR components [36], the enhanced thermal conductivity effect of nanoparticles [4, 9, 12] and physical absorption between DNA polymerase and nanoparticles [37, 38]. Li et al [9] claim that PCR enhancement might be mainly due to the enhanced heat transfer effect of nanoparticles. In contrast, Cao et al [36] suggest that the PCR enhancement may be greatly affected by the surface charge polarity of the polyethyleneimine (PEI) modified MWCNTs rather than the thermal conductivity of MWCNTs alone. It is interesting to note that the stability of nanofluids is one of the vital parameters for their enhanced thermal conductivity effect [39–41]. Stability can be enhanced by modifying the surface charge or pH of the suspensions (see for example [42] and references therein). Therefore, it should be investigated if the surface charges of PEI-modified MWCNTs have any impact on stability, which may also be the reason for the PCR enhancing effect. The exact mechanism behind the enhancements and inhibitory effects of NANO-PCR is still not clearly understood, and hence needs further investigation. The physical and chemical properties of various nanomaterials differ and hence add complexity in understanding the NANO-PCR mechanisms precisely. Nevertheless, the unique property which almost all nanofluids possess is an enhanced thermal conductivity effect. Similar to the nanofluid thermal conductivity effect, NANO-PCR yield also depends on particle size, volume fraction, base fluid, temperature, etc. Hence, we raise the question of whether NANO-PCR enhancement is effected by the enhanced thermal conductivity of nanomaterials. Thus, we attempt herein to explore the role of the enhanced thermal conductivity effect of nanoparticles in all three PCR steps.
- The hydrogen bonds in the double stranded DNA are broken when the temperature is raised to more than 90 °C during the denaturation step of PCR. Since the entropy increases in the reaction mixture, the random motion of the reagents (template DNA molecules, primers and enzymes) increases. Brownian motion of nanoparticles is considered to be one of the main reasons for enhancements in the thermal conductivity effect of fluids containing nanoparticles. The theoretical model of Jang and Choi [24] shows that, at very small particle size, the Brownian motion becomes vital in describing the energy transport in liquids containing nanoparticles. They constructed a theoretical model based on convection, kinetics and Kapitza resistance, and derived a general expression for the thermal conductivity of nanofluids involving four modes of energy transport in nanofluids. Based on this theory, we assume that the DNA is denatured more rapidly in the presence of nanoparticles as a result of better dissipation of heat in the reaction mixture. This good dissipation of heat may be due to collision between base fluid molecules, nanoparticles and also PCR reagents. Spectroscopic experimental results in the past clearly prove this theory, wherein the absorbance measured during DNA denaturation at 260 nm is higher in the presence of nanoparticles than in the absence of the same [12].
- In the subsequent PCR step the reaction liquid is cooled to ∼55 °C, thus allowing primers to bind with single-strand DNA molecules. Since the random motion of particles slows down with decrease in temperature, the van der Waals forces between GNFs may increase and finally help attract other reagents [7]. The aggregation of reaction components around nanomaterials increases the probability of dynamical contact among reaction components; hence it may result in heat equilibrium in the reaction [43] and enhance PCR efficiency.
- During the final step the extension process is enhanced as a result of the enhanced heating process because of GNF addition.
We also examined the effect of supernatant in order to confirm that the enhancement is purely due to GNFs, and the impurities or additives present in GNFs do not contribute to PCR product augmentation. Following the same procedure as Khaliq et al [12], we obtained the supernatant of GNFs and added it to the reaction mixture accordingly to amplify a region of known genomic DNA with 1248 bp. After the PCR was performed using normal protocol, the product was analyzed using ethidium bromide staining. The agarose gel image clearly depicts that the yield in both cases of positive control and supernatant is almost the same (figure 4(D)). This observation indicates that the augmentation in PCR yield is solely because of GNFs.
4. Numerical simulation
We have performed numerical simulations using computational fluid dynamics to study the heat transfer through the PCR tube, similar to an existing report [12]. Navier–Stokes equations were solved with the standard k-epsilon turbulence model for 3D simulation of the PCR tube transient temperature distribution. The solutions were obtained using Fluent® with a pressure based, first-order, implicit, unsteady numerical scheme. Default k-epsilon constants were used in the simulation. The structured meshing was performed with the geometry and it replicates the test section of the PCR tube which is filled with its reagents, figure 5(A). For convenience, the model was divided into three parts: surface 1, surface 2 and top wall. The boundary conditions were chosen according to the actual conditions in a PCR thermocycler. The top wall was made adiabatic and the tube side surfaces were made isothermal. A no-slip condition was given to all the walls.

Figure 5. (A) Grid of PCR tube model with structured meshing (adapted) [12]. (B) Temperature contours of PCR tube model obtained using Fluent® with a pressure based, unsteady numerical scheme. It shows that the presence of GNFs nanoflakes augments faster heat transfer in the PCR tube. Left: simulation using water properties for the inside fluid. Right: simulation with the properties of GNF nanofluids.
Download figure:
Standard imageSimulations were performed with 30 time steps using an adaptive time stepping method. The transient regions of various temperature levels were analyzed in order to distinguish the PCR tube with and without GNFs. The temperature contours and the graphs make it apparent that in the presence of GNFs the heat transferred is considerably higher than the tube without GNFs (figures 5(B) and (C)).
Graphs (A), (B) and (C) of figure 6 show the temperature reached to the center points at 16 mm, 14 mm and 12 mm height respectively. Observation makes it very clear that the flow time required for the heat to reach the center of the tube is much less in the presence of GNFs. Furthermore, it is evident from graph (C) that the temperature reached in the presence of GNFs is 15 °C higher than in the other case. This may be why the efficiency of PCR is enhanced in the presence of thermal conductivity efficient nanomaterials.

Figure 6. Graphs (A), (B) and (C) show the temperature measured at point 1, point 2 and point 3 respectively, where the y axis corresponds to the temperature in Kelvin and the x axis denotes the flow time in seconds. At all three points the heat has transferred in less time and is higher in the presence of GNFs.
Download figure:
Standard image5. Conclusion
Results presented herein clearly show that GNFs have great future potential to be used as PCR enhancers. Current results are in agreement with the literature, as the observed PCR enhancements are strongly dependent on particle concentration. High GNF concentration may inhibit the PCR process owing to excess temperature as a result of the enhanced thermal conductivity effect. GNFs are found to be superior to any other nanoparticles tested in terms of overall PCR cycle reduction. PCR product, equivalent to positive control, can be obtained even by reducing ∼65% cycles. The supernatant of GNFs has neutral effect on the PCR yield, showing that only the GNFs might be responsible for the enhanced yield.
We observed that, similar to the nanofluid thermal conductivity effect, the NANO-PCR yield also depends on particle size, volume fraction, base fluid, temperature etc. This phenomenon suggests that the thermal conductivity effect might be playing a key role in the enhancement of PCR efficiency. In addition, the numerical simulations clearly show that the heat transfer rate in the PCR tube is higher in the presence of GNFs than in the absence of GNFs.
We have proposed a hypothesis for PCR enhancement based on the experimental observations and reports. The presence of GNFs in PCR helps better heat dissipation, that results in improved DNA denaturation during the first PCR step. The nanoflakes may bind with DNA polymerase during the annealing step and due to Van der Waals force of attraction. This also facilitates enhanced interaction between reagents. Finally, the extension step might have been enhanced again due to good dissipation of heat in the presence of GNFs. Hence, the overall PCR efficiency is enhanced.
Acknowledgments
This research work was supported by the International Islamic University Malaysia (IIUM). The authors appreciate the assistance of Dr Rashmi Walvekar, Taylor's University, Malaysia, in thermal conductivity experiments.