

Abstract
Magnetic resonance techniques (electron paramagnetic resonance (EPR) and nuclear magnetic resonance (NMR)) are used for tracking the multi-stage process of the fabrication of fluorescent nanodiamonds (NDs) produced by high-energy electron irradiation, annealing, and subsequent nano-milling. Pristine commercial high pressure and high temperature microdiamonds (MDs) with mean size 150 μm contain ~5 × 10¹⁸ spins/g of singlet (S = 1/2) substitutional nitrogen defects P1, as well as sp3 C–C dangling bonds in the crystalline lattice. The half-field X-band EPR clearly shows (by the appearance of the intense 'forbidden' g = 4.26 line) that high-energy electron irradiation and annealing of MDs induce a large amount (~5 × 10¹⁷ spins/g) of triplet (S = 1) magnetic centers, which are identified as negatively charged nitrogen vacancy defects (NV−). This is supported by EPR observations of the 'allowed' transitions between Zeeman sublevels of the triplet state. After progressive milling of the fluorescent MDs down to an ultrasubmicron scale (≤100 nm), the relative abundance of EPR active NV− defects in the resulting fluorescent NDs (FND) substantially decreases and, vice versa, the content of C-inherited singlet defects correlatively increases. In the fraction of the finest FNDs (mean particle size <20 nm), which are contained in the dried supernatant of ultracentrifuged aqueous dispersion of FNDs, the NV− content is found to be reduced by one order of magnitude whereas the singlet defects content increases up to ~2 × 10¹⁹ spins/g. In addition, another triplet-type defect, which is characterized by the g = 4.00 'forbidden' line, appears. On reduction of the particle size below the 20 nm limit, the 'allowed' EPR lines become practically unobservable, whereas the 'forbidden' lines remain as a reliable fingerprint of the presence of NV− centers in small ND systems. The same size reduction causes the disappearance of the characteristic hyperfine satellites in the spectra of the P1 centers. We discuss the mechanisms that cause both the strong reduction of the peak intensity of the 'allowed' lines in EPR spectra of triplet defects and the transformation of the P1 spectra.
Export citation and abstract BibTeX RIS
1. Introduction
Fluorescent nanodiamonds (NDs) containing NV− defects are novel objects that have a number of innovative applications in magnetic sensing [1–3], cell microbiology [4–6], optical quantum telecommunications [7], and quantum information processing [8]. The large variety of these applications is based on the unique properties of the negatively charged NV− color centers with triplet spin properties.
NV− centers can be created in bulk synthetic diamond obtained by a high pressure (≥ 5 GPa) and high temperature (T ≥ 1300 °C) technique from the graphite charge in the presence of a metal catalyst (HPHT diamonds). Nitrogen thus enters the diamond lattice as a substitutional impurity (usually ≤200 ppm) that originates from air adsorbed on the reagents and the HPHT cell components. Irradiation of diamond microcrystals by a beam of high-energy (≤20 MeV) particles creates a large number of vacancies. Subsequent annealing of the irradiated diamond at T ≥ 850 °C causes thermal diffusion of the vacancies and the appearance of NV− complexes consisting of vacancies stabilized in crystalline positions adjacent to the substitutional nitrogens [9]. NV− has a characteristic luminescence with a zero-phonon line (ZPL) at a wavelength of 638 nm and a broad (100 nm width) emission sideband due to strong phonon coupling.
One technique to obtain fluorescent nanodiamonds is the milling of fluorescent micron size (average crystallite sizes 150–200 µm) diamond powders (MDs) to fine fractions that are characterized by an average particle size below 100 nm. A good description of the procedures for manufacturing fluorescent NDs with the use of two-stage coarse and fine grinding of MDs is given in patent applications [10, 11] and articles [12, 13]. This method was found to be more efficient and technologically justified [14] in comparison with the methods that apply the aforementioned irradiation/annealing treatment to nano-sized fractions of previously crushed initial synthetic HPHT diamonds. However, if using the first more efficient technique, one has to pay a certain price. Upon grinding, the effective specific surface of the diamond material increases by 4–5 orders of magnitude. As a result, the fraction of NV− centers falling into the near-surface (1–2 nm deep) zone of the mechanically and chemically disturbed diamond lattice increases in comparison with that of bulk NV− centers. Near-surface NV− centers have been reported to be sensitive to surface functionalization [15–17] and charge fluctuations [18], and may easily be converted into the S = 1/2 neutral form NV0. Size estimation of the fluorescent ND containing at least one NV− center may be found in the supplemental material (stacks.iop.org/JPhysD/48/155302), and is about 9–10 nm.
Moreover, since the 1960s, it has been well known that the mechanical grinding of semiconducting crystals of Group IV (Ge, Si, diamond) leads to the formation of surface paramagnetic centers—unpaired dangling orbitals originating from broken covalent bonds [19–21]. These dangling bonds have S = 1/2 and their characteristic electron paramagnetic resonance (EPR) signature appears together with the signature of isolated substitutional nitrogen defect P1, which is the dominant intrinsic paramagnetic impurity in HPHT diamond. Dangling bonds may interact with triplet NV− centers at distances less than 2 nm from them, by both dipole–dipole and exchange pathways. Since their number can significantly exceed those of NV− (in NDs there are dozens of S = 1/2 centers per single NV−-like defect [22]), the basic parameters of NV− centers may be substantially affected. It is expected that the effect of S = 1/2 centers is more pronounced for small size (<20 nm) NDs, and one of the goals of the present work is to verify this hypothesis. The last, but not the least, objective of the study reported here is to elucidate the evolution of 'allowed' and 'forbidden' EPR line characteristics (intensity and width) at the various stages of the fluorescent NDs fabrication process.
It was recently shown that paramagnetic NV− centers in fine diamond powders may be reliably detected by the EPR technique using a unique specific signature in the half-field region (characterized by g = 4.26) [23]. This signature was ascribed to the so-called 'forbidden' ΔMS = 2 transition between Zeeman electron sublevels of the triplet (S = 1) ground state of NV− centers in diamond. In the present report we use the aforementioned EPR signature as well as the accompanying 'allowed' ΔMS = 1 signals for estimation and quantification of the concentration of EPR active NV− centers in all of the diamond samples, from the initial microdiamond samples to the fluorescent nanodiamonds, at all stages of processing (high energy electron beam irradiation/annealing, micronization/crushing, nano-milling). This technique is promising for the rapid characterization of manufactured fluorescent nanodiamond powders in terms of the content of the NV− centers, even in some experimental configurations where these centers are hard to detect by fluorescence techniques [24].
2. Experimental
Fluorescent MDs (sample FMD) were manufactured from commercial non-fluorescent MDs PDA999 ('Element Six Ltd/Ireland', mean particle size ~150 μm, moderate substitutional nitrogen content ~150 ppm) by high-energy (~10 MeV) electron irradiation and subsequent annealing in a secondary vacuum. Fluorescent NDs (sample FND, mean particle sizes < 100 nm) were obtained by a multi-stage process [12], involving rough nitrogen jet-milling, fine CW (tungsten carbide) bead nano-milling, decontamination, hot acid treatment, and the moderate (RCF = 4000 g) centrifugation of the water suspension of the nano-milled product. The water suspension of FND obtained was then centrifuged at high-speed (RCF = 15 000 g): the light supernatant contained the finest fraction of FNDs having a mean size of a couple of tens of nm (named fFND) whereas the dense pellet contained the coarse fraction, named cFND (stacks.iop.org/JPhysD/48/155302). The typical high-resolution transmission electron microscopy (HRTEM) images of the fFND particles show an ensemble of particles of cubic diamond with sizes around or below 20 nm, having well round shapes with completely indistinguishable facets and ribs (see figure S2, (stacks.iop.org/JPhysD/48/155302)). Dynamic light scattering (DLS) measurements done on the water suspended fFND sample agree well with the HRTEM observations, showing that the size distribution of the differential number of particles has a maximum at ~18 nm and a full width at half maximum (FWHM) ~14 nm (see figure S3(b), (stacks.iop.org/JPhysD/48/155302)).
Figure 1 summarizes the origin of all MD and ND samples at different stages of the fabrication process and table 1 provides brief descriptions and references where the sample properties are described.
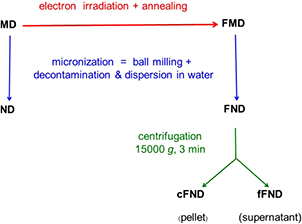
Figure 1. Flow chart of the processing of the different samples. A more detailed description of each sample is provided in table 1.
Download figure:
Standard image High-resolution imageTable 1. The set of samples used in this study.
| Designation | Source | Description | Reference |
|---|---|---|---|
| MD | Element Six Ltd., Shannon Airport, Shannon, Co Clare, Ireland | Synthetic micron-sized HPHT diamond crystals of PremaDia™ PDA999 series with a high crystalline quality, high impact strength, thermal stability, uniform well-faceted particle shape, and of type Ib, mean nitrogen content of about 150 at. ppm. Appearance: transparent microcrystals with mean size ca. 150 μm of yellow-lemon colour. | See information from the manufacturer www.e6.com |
| ND | 'Nano4Drugs' Project | MD sample after milling, decontamination in hot acids, oxidation, dispersion in water, and washing by centrifugation. The product was extracted from neutral water supernatant. The nanometric sample is too aggregated and polydispersed to be able to measure a mean particle size. However, electron microscopy shows that most crystallites have a size below 100 nm. Appearance: fine gray powder. | [10–13] |
| FMD | 'Nano4Drugs' Project | MD sample homogeneously treated by 10 MeV electron irradiation and subsequent annealing at 800 °C during 2 h in secondary vacuum. Appearance: transparent microcrystals of violet colour. | [10–13] |
| FND | 'Nano4Drugs' Project | FMD sample after milling, decontamination in hot acids, oxidation, and washing by centrifugation. The nanometric sample is too aggregated and polydispersed to be able to measure a mean particle size. However, electron microscopy shows that most crystallites have a size below 100 nm. Appearance: fine gray powder. | [10–13] |
| cFND | 'Nano4Drugs' Project | Coarse fraction of FND, obtained in the pellet (bottom precipitated part) after additional centrifugation of an aqueous dispersion of FND. After a 15000 g centrifugation for 3 min, cFND is the pellet and fFND (see below) is the supernatant. After removal the light supernatant part the dense gel-like pellet formed by precipitated part was dried in the secondary vacuum. Electron microscopy shows that most crystallites have a size below 100 nm. Appearance: fine gray powder. | |
| fFND | 'Nano4Drugs' Project | Fine fraction of FND, obtained in the supernatant after additional centrifugation of an aqueous dispersion of FND. FND aqueous dispersion was fractionated by centrifugation either at 4000 g for 30 min or 15 000 g for 3 min (this work). The supernatant sample is still polydispersed [19]. Transmission electron microscopy shows that most crystallites have sizes about 15 nm. DLS on water suspended sample provides maximum of the size distribution of the differential number of particles at ~18 nm, FWHM ~14 nm. The solid material that was specially extracted from the light supernatant part was carefully dried in a secondary vacuum. Appearance: fine gray powder. | [10–13] |
With the aim of testing the charge transfer effect which may occur due to inter-particle contact interaction, samples of cFND and fFND were diluted by amorphous SiO2 nanoparticles (not shown in table 1, for details see supplemental material (stacks.iop.org/JPhysD/48/155302)).
X-band (frequency ν = 9.4 GHz) continuous wave EPR measurements on polycrystalline samples were carried out using a Bruker EMX—220 spectrometer equipped with Agilent 53150 A frequency counter at room temperature (RT, T ~ 295 K). Precise determination of g-factors and densities of paramagnetic centers Ns were done by comparison with the reference sample—well purified detonation ND powder with g = 2.0028(2) and Ns = 6.3 × 10¹⁹ spins/g [25]. Evaluation of the electron spin-lattice and spin–spin relaxation times (TSLe and TSSe, correspondingly) was done by analysis of the saturation dependencies of the peak-to-peak intensities of the multicomponent central g = 2.00 line following the technique described in [26]. Spectra processing and simulation were done using Bruker's WIN-EPR/SimFonia/XSophe and OriginLab software.
RT 1H and 13C NMR measurements on the MD and ND powders were carried out using a Tecmag Libra pulse solid state FT-NMR spectrometer and Oxford 360/89 superconducting magnet. The measurements have been made in the external magnetic field B0 = 8.0 T, corresponding to 1H resonance frequency of 340.5 MHz and 13C resonance frequency of 85.6 MHz, respectively. For additional details of NMR experiments see the supplemental material (stacks.iop.org/JPhysD/48/155302).
3. Results
3.1. EPR
3.1.1. General view spectra.
Figure 2 shows the raw (non-processed) experimental EPR spectra of all samples under study recorded within the field scan range of 1 T at incident microwave power PMW = 20 mW and 100 kHz magnetic field modulation amplitude Amod = 1 mT. These spectra are the typical EPR signatures of each sample. In general, each spectrum of non-irradiated samples (both intact and milled) consists of some broad line(s) with geff > 2.00 and intense narrow lines within the region of g = 2.00. Irradiation/annealing adds additional low intense spectral features in the half-field region g = 4 to these lines, as well as satellite lines (marked by arrows in figure 2) symmetrically located on both sides of the intense g = 2.00 lines. Each line (group of lines) was further recorded separately at the experimental setup, providing the best spectral resolution and signal-to-noise ratio available. It should be noted that all of the EPR spectra and spectra parameters found for the coarser fraction of the FND sample (cFND) practically repeat the corresponding spectra and parameters of its precursor FND, except for the increased content of magnetic impurities. Thus, hereinafter these spectra and their description will be omitted from the experimental section. On the other hand, tables 2 and S1 in the supplemental material (stacks.iop.org/JPhysD/48/155302) also include data on cFND samples.

Figure 2. RT X-band (ν = 9.463 GHz) EPR spectra (general view, non-processed) of MD and ND powders. All of the spectra were recorded in the same experimental conditions and their intensities are normalized per unit weight. The intense lines at g = 2.00 are cut by vertical zooming. The arrows point out new EPR features appearing due to irradiation/annealing. Black trace: MD—initial commercial MD sample; red trace: FMD—MD sample after high energy electron irradiation and annealing; green trace: ND—milled MD sample; blue trace: FND, milled FMD sample; magenta trace: fFND, fine fraction extracted from the FND sample.
Download figure:
Standard image High-resolution imageTable 2. Concentrations of EPR active defects in the diamond samples under study.
| Sample | Particle size (nm) | Concentration of S = 1/2 defects NS = 1/2 (spins/g) |
Concentration of triplet NV− defects NNV− (spins/g) |
Relative concentration of magnetic impurities Nimp (arb. units/mg) |
|---|---|---|---|---|
| MD | 150 × 103 | 4.9 × 10¹⁸ | ≈0 | 41 |
| FMD | 150 × 103 | 3.6 × 10¹⁸ | 5.4 × 10¹⁷ | 483 |
| ND | <100 | 8.8 × 10¹⁸ | ≈0 | 10 |
| FND | <100 | 8.1 × 10¹⁸ | 3.6 × 10¹⁷ | 3 |
| cFND | <100 | 8.9 × 10¹⁸ | 3.8 × 10¹⁷ | 7 |
| fFND | <20 | 1.6 × 10¹⁹ | 5.4 × 10¹⁶ | 2 |
aErrors in determination of NS, NNV− do not exceed ±15%. bError in determination of Nimp does not exceed ±30%. cAveraged over the three batches.
After recent EPR studies on diamond powders [22, 23, 26], the following attributions of the features observed can be made:
- (a)The intense EPR lines in the region of g = 2.00 are attributed to the primary paramagnetic defects with S = 1/2;
- (b)The broad EPR lines with g > 2.00 are attributed to para- and ferro-magnetic impurities (probably surface weakly-bonded adsorbates) contained in the intact initial sample or appearing/disappearing during irradiation treatment, annealing, milling, and purification. Doubly integrated intensity of these lines (DI) indicates the total amount of magnetic impurities in a diamond sample. The impurity content in starting MD samples was found to be strongly inhomogeneous and varies several times from batch to batch. The relative concentrations of magnetic impurities (in arbitrary units per unit weight) are listed in table 2;
- (c)The EPR lines in the half-field (HF) region (g = 4) appearing in all of the samples passed through high-energy electron irradiation and subsequent annealing. Following [22, 23], these lines are attributed to 'forbidden' transitions in the EPR spectra of triplet (S = 1) paramagnetic centers, like NV− (g = 4.26) and the multi-vacancies (g = 4.00);
- (d)The satellite lines observed aside of intense g = 2.00 lines and separated by ~100 mT and ~200 mT are attributed to 'allowed' transitions in EPR spectra of triplet NV− centers [23].
3.1.2. EPR of primary paramagnetic defects with S = 1/2.
The most intense EPR signal in the initial sample MD (figure 3(a), black trace) demonstrates a well-resolved polycrystalline hyperfine pattern. This hyperfine pattern originates in the paramagnetic centers coming from a single unpaired electron anisotropically interacting with the 14N nucleus (I = 1) in diamond, the so-called P1 (or N0) [27]. The EPR parameters determined for these P1 centers by simulation are giso = 2.0024(2), Azz = 4.06(2) mT, Axx = Ayy = 2.91(2) mT, individual line width ΔHppLorentz = 0.12 mT. The total concentration of paramagnetic centers NS = 1/2 in MD is estimated as 4.9 × 10¹⁸ spins/g (within 15% experimental error, see table 2)6. The EPR spectrum of the ND sample, obtained by milling of MD, results in a similarly complicated EPR signal (figure 3(a) green trace) consisting of the same two independent unlike components which saturate at different microwave power levels (an example of the typical decomposition of such a signal may be found in figure 2(d) of [26]). At low microwave power PMW (PMW ≤ 200 μW), when no component is saturated, the experimental spectrum (figure 3(a), green trace) is a superposition of two intense signals: the signal of the P1 centers and a singlet Lorentzian line, which overlaps with the central transition of the P1 spectrum. The singlet line has the same (unresolved within the experimental error) g-factor, line width ΔHpp ~ 0.9 mT, and its DI is ~50% of the total signal intensity, which corresponds to NS = 1/2 = 8.8 × 10¹⁸ spins/g. As is clearly seen in figure 3(a), the amount of observable P1 centers in ND remains practically the same as in the initial MD. Thus, the increase in the total amount of S = 1/2 defects is due to the new Lorentzian signal attributed to dangling bonds in diamond edges [26]. Figure 3(b) illustrates the EPR spectrum after high-energy electron irradiation and subsequent annealing of MD. The EPR spectrum of the fluorescent FMD sample (red trace in figure 3(b)) demonstrates a noticeable reduction of the P1 signal (NS = 1/2 = 3.6 × 10¹⁸ spins/g) and its broadening (ΔHppLorentz = 0.2 mT), in comparison with the spectrum of starting MD (figure 3(b), black trace). Figure 3(c) illustrates changes in the EPR spectrum due to milling of the fluorescent FMD sample. The milled fluorescent FND sample shows (figure 3(c), blue trace) a significant increase of the surface-originated dangling bond signal evidenced by signal broadening ΔHpp ~ 1 mT (by WIN-SimFonia simulation), together with the newly appearing relatively narrow (ΔHpp = 0.23 mT) Lorentzian-like line contributing to ~70% of the total signal intensity. The latter corresponds to NS = 1/2 = 8.1 × 10¹⁸ spins/g. Extraction of the fine fraction from the FND sample leads to a drastic decrease of the low- and high-field hyperfine components of the P1 signal in the EPR spectrum of fFND (figure 3(d) magenta and purple traces). Thus, the spectrum of the fFND sample represents the superposition of two Lorentzian lines: a relatively broad line with ΔHpp ~1.1 mT (~80% of total intensity) and a narrow one with g = 2.0026(2) and ΔHpp ~0.3 mT. The total concentration of S = 1/2 spins in fFND shows a twofold increase in comparison with its precursor FND (NS = 1/2 = 1.6 × 10¹⁹ spins/g). Data on electron relaxation found for both P1 and dangling bond components show a reduction of TSLe in the result of any treatment of the initial MD sample whereas the TSSe values remain quite short and are practically unchanged. The spin-lattice relaxation times of both types of defects are strongly affected by milling and depend on the mean particle size of the resulting product obtained by fractionation. For further detail see the supplemental materials (stacks.iop.org/JPhysD/48/155302).
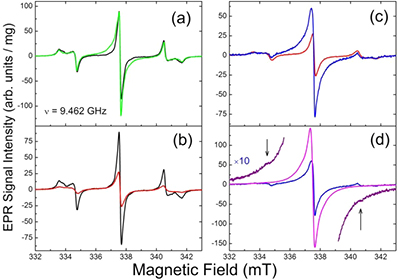
Figure 3. RT X-band (ν = 9.462 GHz) EPR spectra, region of S = 1/2 signals, as a function of the processing of the samples: (a) effect of milling, black trace—MD, green trace—ND; (b) effect of high energy electron irradiation and annealing, black trace—MD, red trace—FMD; (c) effect of milling of irradiated/annealed sample, red trace—FMD, blue trace—FND; (d) after extraction of the fine fraction, blue trace—FND, magenta trace—fFND, purple trace—tenfold zoom of fFND spectrum, arrows point out weak hyperfine ΔmI = ±1 zz-components. All spectra were recorded in the same experimental conditions at PMW = 200 µW, normalized per unit weight and plotted in comparable scales.
Download figure:
Standard image High-resolution image3.1.3. EPR spectra in the HF region (g = 4).
The initial micron sized sample MD shows no signals within the HF region. The same is correct for the milled sample ND—see the overlapping black and green traces in figure 4. On the other hand, irradiated and annealed MD, as well as its milled derivatives, show intensive characteristic signals with g = 4.26(1) in that region—see figure 4(a), red trace. The spectra of FMD and FND also show a weak line with g = 4.19(1)7. Milling of the FMD sample to FND causes a ~30% reduction of the characteristic g = 4.26 signal, as well as smoothening of the quasi-crystalline features—see figures 4(a) and (b), blue traces. The coarse fraction of the FND sample (cFND) provides the same (within the experimental error) HF signals (not shown). The fine fraction of the FND sample (fFND) shows a further considerable (about an order of magnitude) reduction of the g = 4.26 signal, the practical disappearance of g = 4.19 signal and all quasi-crystalline features, and the rise of the new signal with g = 4.00(1), in which the intensity at those partially saturated excitation conditions becomes comparable with the intensity of the g = 4.26 signal—see figures 4(a) and (b), magenta trace. Unfortunately, the low signal-to-noise ratios for both HF signals in fFND do not allow a reliable evaluation of the electron relaxation times. Saturation dependencies measured for FMD and FND coincide and provide estimated values TSLe ~ 10−5 s and TSSe ~ 10−8 s. Figure 5(b) shows HF EPR spectra of fluorescent diamond powders FMD, FND, and fFND recorded at relatively low PMW = 2 mW power. Comparing the spectrum of fFND (figure 5(b), magenta trace) with the corresponding spectrum in figure 4(b) recorded at tenfold PMW reveals that the g = 4.26 signal saturates at a lower PMW than the g = 4.00 one signal, indicating a longer TSLe for defects responsible for the g = 4.26 signal.
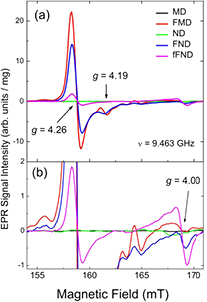
Figure 4. Partially saturated HF X-band (ν = 9.463 GHz) EPR spectra recorded at RT, PMW = 20 mW, Amod = 1 mT, number of coherent acquisitions nacq = 100, black trace—MD, red trace—FMD, green trace—ND, blue trace—FND, magenta trace—fFND: (a) general view; (b) tenfold Y-scale zoom of spectra in figure 4(a). All of the spectra were recorded in the same experimental conditions and normalized per unit weight. Broad impurity signals are subtracted. The black traces in both (a) and (b) are practically masked by the green ones.
Download figure:
Standard image High-resolution image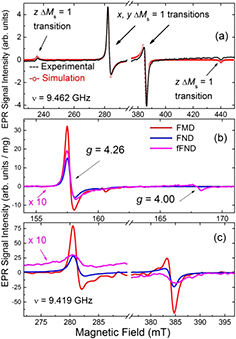
Figure 5. RT X-band EPR spectra of satellite and HF lines. (a) Black trace—experimental spectra of satellite lines in FMD recorded at PMW = 100 μW, Amod = 1 mT, nacq = 100 and ν = 9.463 GHz, red trace—polycrystalline spectrum of triplet (S = 1) centers simulated using the following SH parameters: ΔHppLorentz = 1 mT; giso = 2.003; D = 0.0950 cm−1; E = 0.0003 cm−1; (b) HF lines and (c) x, у satellite lines in irradiated/annealed samples: red trace—FMD, blue trace—FND and magenta trace—fFND (plotted at tenfold zoom). Spectra (b) recorded at PMW = 2 mW, Amod = 0.3 mT, nacq = 400, ν = 9.419 GHz; spectra (c) recorded at PMW = 100 μW, Amod = 1 mT, nacq = 100, ν = 9.419 GHz. The spectra of all of the diamond samples in each frame are recorded in the same experimental conditions and normalized per unit weight. Broad impurity signals are subtracted.
Download figure:
Standard image High-resolution image3.1.4. EPR spectra of satellite lines.
Low intensity satellite lines are observed only in the irradiated/annealed FMD sample and its derivatives (FND, cFND and fFND). Neither the initial MD nor the milled ND samples show any EPR lines in the corresponding magnetic field regions. The black traces in figure 5(a) show the zoomed satellite lines in the EPR spectra of FMD, which are recorded at low PMW (intense EPR signals in the g = 2.00 region are not plotted here). The red traces in figure 5(a) represent the simulated polycrystalline spectrum of triplet (S = 1) paramagnetic centers obtained using WIN-SimFonia software and the following spin-Hamiltonian (SH) parameters: ΔHppLorentz = 1 mT; giso = 2.003 and zero field splitting parameters D = 0.0950 cm−1 and E = 0.0003 cm−1. Figure 6(c) demonstrates the evolution of satellite lines in the process of milling and further fractionation of the FMD sample. Comparison of the same evolution in the HF g = 4.26 lines (figure 5(b)) with the corresponding satellite lines (figure 5(c)) reveals that upon milling, and especially the extraction of the fine fraction, the reduction of the peak-to-peak intensities (and, respectively, signal-to-noise ratios) of the satellite lines is more pronounced than that of the HF lines.
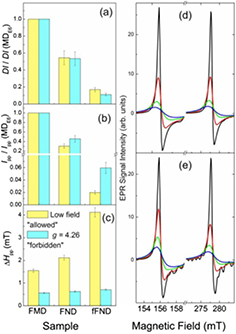
Figure 6. (a)–(c) Changes in EPR parameters of the low field 'allowed' (light yellow) and g = 4.26 'forbidden' (light cyan) lines in the experimental EPR spectra of NV− centers (see figures 5(b) and (c)) come from micronization and nano-milling: (a) DI normalized to the corresponding DI values in the spectrum of FMD sample; (b) normalized peak-to-peak intensity Ipp; (c) line width ΔHpp. (d, e) XSophe simulations of the g = 4.26 'forbidden' lines (153–159 mT region) and low field 'allowed' lines (271–284 mT region) in polycrystalline EPR spectra of triplet NV− centers with SH parameters gxx = gyy = 2.0027; gzz = 2.0029, D = 0.0950 cm−1, E = 0, ν = 9.34 GHz: (d) as function of the individual line width ΔHppLorentz, black trace—0.5 mT, red trace—1 mT, green trace—2 mT, blue trace—3 mT; (e) as function of D-strain, ΔD (at ΔHppLorentz = 0.57 mT), black trace—0, red trace—0.0015 cm−1, green trace—0.0030 cm−1, blue trace—0.0045 cm−1. Each of EPR spectra in (d) and (e) is normalized to the same DI value. Narrow crystalline-like features on ΔD = 0 curves in (e) are XSophe –simulation artefacts.
Download figure:
Standard image High-resolution image
3.2. NMR
RT 13C spectra ((stacks.iop.org/JPhysD/48/155302), figure S4(a)) reveal symmetric narrow singlet lines with chemical shift 35 ppm characteristic of sp3 carbons of diamond [28]. The sample treatment causes a decrease in the line width, an increase in spin-spin relaxation time T2n(13C), and a shortening of the 13C NMR spin-lattice relaxation times: T1n(13C) vary from 98 to 6.7 s ((stacks.iop.org/JPhysD/48/155302), figure S4(b), table S1), which correlates with the increase in the density of paramagnetic defects [28]. This correlation as well as the stretched exponential character of the relaxation are attributed to the interaction of nuclear spins with paramagnetic defects, both inherent P1 and processing-driven dangling bonds detected by EPR.
RT 1H NMR measurements reveal a noticeable difference in the proton spectra within this series of samples. While initial larger particle size samples MD and irradiated/annealed FMD show no observable proton signal, the milled ND sample (figure S4(c) and table S1) shows a relatively broad line at 8.6 kHz (stacks.iop.org/JPhysD/48/155302). FND, cFND, and fFND samples reveal narrow symmetric singlets ((stacks.iop.org/JPhysD/48/155302), figure S4(c)), which is characteristic of mobile water molecules adsorbed on the nanodiamond surface [28]. More details on 13C and 1H NMR spectra and relaxation in the studied samples can be found in the supplemental material (stacks.iop.org/JPhysD/48/155302).
4. Discussion
4.1. Magnetic impurities
EPR data allow the direct tracking of the presence of magnetic contaminations in polycrystalline diamond samples. The initial commercial samples of MD demonstrate a moderate level of magnetic (both para- and ferro-magnetic) impurities (see figure 2 and table 1). These contaminations originate most probably from the HPHT synthesis. The irradiation/annealing process introduces additional magnetic contamination. Thus, the total intensity of the magnetic signal per unit mass in the fluorescent FMD sample is an order of magnitude larger than the same in the initial sample. The presence of a significant amount of ferromagnetic impurities is sufficient to explain both the broadening of the 13C NMR line and the shortening of the 13C spin-lattice relaxation time (see supplemental material (stacks.iop.org/JPhysD/48/155302), figures S4(a) and (b)). In contrast, the total amount of the main intrinsic EPR spectrum broadening agent—inherent paramagnetic defects—shows a ≈30% reduction in the FMD sample in comparison with the initial MD sample. It is reasonable to suppose that these contaminations come from the irradiation accessories or from the annealing chamber. On the other hand, diamond samples which passed through milling and subsequent fractionation processes (ND, FND, cFND and fFND, respectively) show quite low contamination levels (figure 2 and table 2), which is in a good agreement with the corresponding treatments, including special decontamination procedures in which metallic impurities are removed, among others (see table 1 and supplemental material (stacks.iop.org/JPhysD/48/155302)).
4.2. Main sources of intrinsic paramagnetism
The EPR clearly indicates that the main paramagnetic defect in the initial synthetic sample MD is the P1 center originating from a single isolated substitutional nitrogen [27]. The non-saturated (at PMW = 2 μW) width of the central ΔmI = 0 hyperfine line ΔHpp = 0.12(1) mT corresponds to ~100 at. ppm of paramagnetic impurities [29]. This number is in perfect agreement with the total amount of paramagnetic centers estimated by EPR as 4.9 × 10¹⁸ spins/g. It is worth mentioning here that, according to the manufacturer of the initial MDs, the nitrogen content in these Ib type samples does not exceed 150 at. ppm. This means that most of the nitrogen in the MD takes part in the creation of isolated substitutional defects P1. Of course, P1 is not the only paramagnetic defect in MD: analysis of saturation curves indicates the presence of some carbon-inherited defect like dangling bonds. Moreover, P1 spectra recorded at high incident power (PMW > 1 mW) reveal an additional weak doublet signal with the splitting between the doublet lines of 3.2 mT (not shown), which saturates at much higher PMW levels than P1. Strong differences in the saturation curve behavior of hyperfine components as well as estimated relative intensities make the attribution of these lines to the P1 centers associated to naturally abundant 15N (I = 1/2, ~0.34%) irrelevant. Thus, this doublet indicates the presence of paramagnetic centers of other types than P1 or dangling bonds in these MDs. However, the prevailing intrinsic defect in MD is P1.
Irradiation/annealing treatment does not make new S = 1/2 defects appear, but it does affect the initial P1 signal. Figure 3(b) clearly indicates both the reduction of the amount of P1 centers and an about twofold broadening of P1 center hyperfine lines in the fluorescent FMD sample. The electron spin-lattice relaxation time also drops (figure S4(c), (stacks.iop.org/JPhysD/48/155302)). Moreover, the 13C NMR measurements of this sample also shows line broadening and reduction of nuclear spin-lattice relaxation time (figures S5(a) and (b), (stacks.iop.org/JPhysD/48/155302)). It is known that the presence of paramagnetic defects is the main factor affecting electron and nuclear relaxation in diamonds [26, 28, 29]. Thus, the reduction of the number of paramagnetic defects observed in the FMD sample contradicts the broadening of EPR and NMR lines, as well as the shortening of relaxation times found in FMD. It may be suggested that irradiation/annealing changes the structural properties of MDs, directly affecting both nuclear and electron relaxation. The reduction of P1 defects in FMD may be due to the cumulative effect of high-energy irradiation and subsequent high temperature annealing.
Milling affects the basic paramagnetic properties of synthetic MDs much more seriously than irradiation/annealing. Thus, from the EPR spectra of milled ND one may infer that the total amount of S = 1/2 paramagnetic defects increases by almost a factor of two compared to MD (figure 3(a)). Considering that the P1 content remains practically the same, the new dangling bond signal (which was practically not observed in the initial MD sample) becomes the evident feature in the EPR spectrum. In this sample, the amount of dangling bond-type defects is comparable to that of P1. In contrast to the FMD case, these fabrication-driven defects are responsible for shortening EPR and NMR spin-lattice relaxation times. The same is observed for the milled and processed irradiated/annealed sample FND: the total amount of paramagnetic defects here is practically the same as in ND, but since the amount of P1 in its starting FMD sample is lower than in initial non-irradiated MD, the dangling bond signal is the prevailing feature in the EPR spectrum of FND (figure 3(c)). 13C nuclear relaxation times in ND, FND and cFND sample are found to be the same within the experimental error, which perfectly corresponds to practically the same densities of main paramagnetic defects in these samples. On the other hand, both FND and cFND demonstrate a noticeable reduction of the electron spin-lattice relaxation in the P1 centers ((stacks.iop.org/JPhysD/48/155302), figure S3(c)). This occurs due to the combined effect of the structural changes that originate in irradiation/annealing (one of the factors affecting line width and relaxation in the ND sample) and the increasing spin-lattice relaxation rates that are due to the new paramagnetic defects induced by milling. The suggested location of the dangling bond defects are at the surface and interface layer of ND particles.
The effect of the milling to fine fractions on paramagnetic defects seems to be more complicated. The total amount of main paramagnetic defects in fFND grows almost twice in comparison with its precursor FND—up to 1.6 × 10¹⁹ spins/g. However, the analysis of EPR signals line shapes points out some transformations of EPR signals observed in the precursor. On the one hand, the EPR spectrum of fFND (red trace in figure 2(d)) shows subsequent increase of the broad Lorentzian line due to dangling bonds. At the same time, the hyperfine ΔmI = 1 components of the P1 signal, which are found to be practically unchanged after irradiation/annealing and milling (see figure 3(c)) almost disappear in fFND. Only zooming the spectrum (purple trace in figure 3(d)) reveals some traces of these components. Interestingly, the remaining hyperfine P1 components in fFND are not broadened in comparison with the same signals in FND or cFND. Thus, the real decrease of the conventional P1 signal is observed here. On the other hand, a new narrow Lorentzian signal with g = 2.0026(2) and ΔHpp ~ 0.3 mT emerges in the spectrum. After decomposition into two Lorentzians, we infer that the narrow signal contributes to ~20% of the total DI, which corresponds well with the contribution of the P1 signal into the spectrum of the precursor FND. One may suggest that in the fine fraction, extracted from FND, the characteristic P1 signal transforms into the narrow Lorentzian line, originating from the same P1 defects. Indeed, the P1 defects are intrinsic ones and are located in the bulk of MDs and, most probably, are hardly affected by the milling process. For instance, milling practically does not affect the P1 content (figure 3(c)). It is worth mentioning that this ND sample is the only one containing an enormous (over 1 × 10¹⁹ spins/g) density of paramagnetic dangling bonds. Thus, both the dipole-dipole and the exchange interactions of the P1 defects with dangling bonds confined in the nanoparticle become the main factor determining the line shape of the EPR signal, as has been recently observed in detonation NDs [22]. In this case the exchange averaging of the hyperfine structure causing the so-called exchange narrowing may form a new signal of the same P1 defects: the narrow Lorentzian line observed in the EPR spectrum of fFND. Following this hypothesis, the residual weak hyperfine lines observed in the EPR spectrum of fFND at higher gain may be due to P1 centers in diamond crystallites of larger sizes (>40 nm), naturally occurring in fine ND powders in small but not vanishing quantities (<0.3 wt. %) (see figure S3(c) for the population mode with smallest sizes, which characterizes isolated single crystallites, (stacks.iop.org/JPhysD/48/155302)). A detailed study of the line shape dependence of P1 polycrystalline EPR spectrum on diamond particle size will be reported elsewhere.
4.3. NV− centers induced by irradiation/annealing
Recent studies [22, 23] allow unambiguous attribution of the HF line with g = 4.26, accompanied by the satellite lines (symmetrically located on both sides of the g = 2.00 transitions and separated by ~100 mT and ~200 mT), to negatively charged triplet (S = 1) nitrogen vacancies NV−. This attribution is based on the solid ground of the specific line shape of the polycrystalline EPR spectrum as well as the SH parameters determined both directly from the spectrum and by simulations. Thus, following these signals provides researchers with a reliable tool to track the appearance and evolution of NV− centers, as well as to estimate their content in samples under study. EPR data allow us to conclude that both initial synthetic MD and its milled derivative ND contain no NV− centers traceable by EPR—see the overlapping black and green traces in figure 4. These samples also show no pronounced fingerprints of NV−-type photoluminescence. Irradiation/annealing turns the initial MD sample into the fluorescent sample (FMD). This transformation is accompanied by the clear appearance of new features in the EPR spectrum of FMD: a strong narrow (non-saturated line width ΔHpp = 0.5 mT) HF line with g = 4.26 due to 'forbidden' ΔMS = 2 transitions in polycrystalline EPR spectrum of NV− centers (red trace in figures 4 and 5(b)) and a set of low- and high-field satellite lines with ΔHpp ~ 1.5 mT due to 'allowed' ΔMS = 1 transitions in the same spectrum (figure 5(a) and (c)).
Double integration of the entire NV−-related spectrum (i.e. all 'allowed' and 'forbidden' lines excluding the g = 2.00 region of very strong main paramagnetic signals, which in the simulated EPR spectrum of NV− contributes to the total DI less than 10%) provides an estimation of NV− content in FMD as 5.4 × 10¹⁷ spins/g which, making simple volume/mass calculations, corresponds to ~3 × 10¹² NV− centers per each 150 μm FMD particle. Milling of fluorescent MDs leads to a weak broadening of all NV−-related lines in the EPR spectra of the FND and cFND samples (ΔHpp = 0.6 mT and 2 mT for the 'forbidden' and 'allowed' line, correspondingly) and about 30% reduction of DI of that characteristic g = 4.26 line (blue trace in figure 5). Following the aforementioned procedure, a double integration of all NV−-related lines provides NV− content in FND as 3.6 × 10¹⁷ spins/g corresponding to ~660 NV− centers per each 100 nm FND particle. Extraction of the fine fraction (the fFND sample, average particle sizes below 20 nm) reveals a more pronounced broadening of EPR lines (magenta traces in figures 5, 6(b) and (c), ΔHpp = 0.7 mT and ~4 mT for the 'forbidden' and 'allowed' lines) as well as a drastic decrease in the NV− centers content down to 5.4 × 10¹⁶ spins/g. The latter number corresponds to a single NV− center per 3 ÷ 4 (assuming 15 nm mean size) diamond nanoparticles. It could be suggested that, likewise in the case of the P1 signals described above, the EPR signals of NV− centers observed for the fFND sample originate from single nanocrystallites of larger sizes (>40 nm, like those in FND). However, a significant line broadening of all of the NV−-related EPR signals registered in the fFND vote against such a model. Thus, one can suppose that NV− centers in small (size <20 nm) fFND particles are infrequent defects.
It should be noted that changes in DI of the 'forbidden' line agree quite well with the changes in the NV− content obtained by the correct procedure of double integration of the entire NV−-related EPR spectrum. Thus, the EPR spectrum of 'forbidden' line in the HF region may be used as a reliable tool for comparative estimations of the NV− content in fluorescent NDs, even in those cases when weak 'allowed' transitions are not (or hardly) observed (see, for instance, [22]).
Let us analyze the evolution of the NV− content in the diamond samples under study. NV− centers do not exist in the non-irradiated samples: both initial and milled ones. The EPR features attributed to NV− appear only in the FMD sample and its pulverized derivatives, i.e. in the samples passed through the corresponding irradiation/annealing treatment. The highest density of NV− is observed in the micron-sized sample FMD. Upon milling to 100 nm (FND, cFND), this density decreases by one third. This means that 30% of NV− defects, most probably located within or closer to the interface layers, were quenched by milling, which is usually accompanied by excessive heating, formation of paramagnetic dangling bonds etc. Other NV− centers in this sample (as well as in the irradiated/annealed FMD sample) are located in the bulk of the diamond particle and, thus, are almost unaffected (not quenched) by the treatment.
The above findings seem to disagree with the fluorescence microscopy observation combined with atomic-force microscopy size measurement [13]. The optical study reports that in the sample analogous to fFND (mean particle size of ~8 nm) ~25% of the particles carry at least one NV color center. Let us point out that the photoluminescence reported in [13] also includes the contribution from the neutral NV0 centers. It was recently reported that, due to the larger influence of surface electron traps in smaller particles, the proportion of negatively charged NV− defects, with respect to its neutral counterpart NV0, decreases with the size of the ND [15]. These observations were done on isolated FND spincoated on a cover glass. However, in our EPR experiment the inter-particle interactions could also play a role. In order to rule out the effect of inter-particle interactions on the surface electron trapping process, we carried EPR measurements on the diluted cFND:SiO2 and fFND:SiO2 samples to allow light to be shed on the effect of inter-particle interactions on the surface electron trapping process. Upon dilution by SiO2, the NV−-related EPR features for both coarser and fine nanoparticles behave exactly in the same manner as the features responsible for the main paramagnetic defects: no changes in SH parameters and line width, just a proportional reduction of the signals intensities. In a case where inter-particle interactions have played a role, one would have observed deviations from the proportional reduction for the fine sample. Such a deviation is not observed and so we can exclude the involvement of inter-particle interactions in the process of surface induced charge state conversion of single NV defects hosted in NDs, which solely comes from surface electron traps.
Extrapolation of the data presented in [15] indicates that in NV containing NDs with sizes smaller than 10 nm, the NV0 centers are about 50% of total NV-related defects. It should be noted that, in spite of its spin singlet origin (S = 1/2 ground state) the NV0 center is practically EPR silent due to the dynamic Jahn–Teller coupling, which broadens the EPR lines, dramatically reducing detection sensitivity [30]. Therefore, these centers do not contribute to any (especially NV− related) EPR signals. Hence, it may be concluded that just ~12% of the fFND particles carry at least one EPR active NV− center. This estimation is in a good agreement with the EPR findings reported above.
4.4. Other HF EPR signals
Figure 4(a) clearly shows that, in addition to the characteristic NV−-originated g = 4.26 signal, another two HF signals appear during irradiation/annealing and milling of the initial sample. These are the g = 4.19 signal, observed in FMD and coarse ND fractions (FND, cFND), as well as the weak g = 4.00 signal observed in both coarse and fine fractions. In the fine fraction fFND the intensity of the latter signal becomes comparable with the intensity of the g = 4.26 signal—see figure 4(b), magenta trace. Neither the g = 4.19 nor the g = 4.00 lines are accompanied by observable 'allowed' lines—most probably due to the low abundance of these triplet centers. Following the attribution of all narrow HF signals to 'forbidden' ΔMS = 2 transitions in polycrystalline EPR spectra of some triplet centers [22, 23], one may suggest that the weak additional HF features found in this study belong to other triplet centers with SH parameters differing from those for the NV− defects. One may ascribe the g = 4.19 line to triplet defects with a D-value smaller than that for the NV− center (0.0950 cm−1). Spectra simulations provide that the g = 4.19 position corresponds to D ~ 0.08 cm−1. Detailed study of the irradiation induced centers of this type in other irradiated diamond samples will be reported elsewhere. The same considerations for the g = 4.00 signals provide D ~ 0.03 cm−1. Recently, similar signals were found in HF EPR spectra of NDs manufactured by detonation and other dynamical synthesis techniques [22], and attributed to some triplet defects TR2, which do not relate to atomic nitrogen substitutions in the diamond lattice and are, therefore, caused solely by carbon-inherited defects, namely intrinsic multivacancy defects [22]. Strengthening of the g = 4.00 signals just in the EPR spectra of the fine fraction fFND supports the hypothesis proposed in [22]. Indeed, the fine fraction fFND is characterized by the enormous content of the milling induced singlet paramagnetic defects which, in turn, increases the probability of these defects coupling.
4.5. Can 'allowed' transitions be observed in the EPR spectra of NV− containing nano-diamond powders?
Shames et al [22] reports on thorough but unsuccessful attempts to observe any traces of EPR lines which could be attributed to 'allowed' transitions in EPR spectra of polycrystalline NDs obtained by dynamic synthesis techniques (detonation, laser ablation etc.). On the other hand, characteristic HF signals with g = 4.26 attributed to 'forbidden' transitions in EPR spectra of NV− centers [23] were registered for all of the above mentioned ND samples. It was suggested that some specific broadening of just the 'allowed' lines causes such a puzzling situation [22]. Some speculations on the mechanisms responsible for the disappearance of 'allowed' lines in EPR spectra of NDs have been discussed in this reference. Careful analysis of the data reported in this study promises to shed light on this problem. Figures 6(a)–(c) illustrate changes in EPR parameters of g = 4.26 'forbidden' line and one (low field) of the 'allowed' satellite lines, obtained from the experimental spectra of the diamond series under study (figures 5(b) and (c)). It is found that DI of both 'allowed' and 'forbidden' lines drop down equally on milling—see figure 6(a). On the other hand, as a result of this milling, the peak-to-peak intensity Ipp of the 'forbidden' line undergoes a less dramatic decrease than the same of the 'allowed' line (figure 6(b)). The drop in the 'allowed' line intensity is accompanied by a strong broadening of just this line (figure 6(c)), which correlates with the DI changes found for both lines. Thus, the main reason for the disappearance of EPR lines corresponding to the 'allowed' transitions in EPR spectra of NV− containing NDs is the stronger broadening of the 'allowed' lines in comparison with the broadening affecting the lines attributed to 'forbidden' transitions. Let us speculate on the mechanisms which could be responsible for such a selective broadening. Figure 6(d) presents the g = 4.26 'forbidden' lines and low field 'allowed' ones obtained by XSophe simulation of the polycrystalline EPR spectrum of NV− centers in diamond (SH parameters—in figure caption) as a function of the homogeneous broadening of individual Lorentzian lines. Here it is clearly seen that both lines are broadened in the same manner, providing the same drop in peak intensities. Thus, the origin of the asymmetry in line broadening may be found in the mechanisms responsible for inhomogeneous EPR line broadening in the spectra of a disordered (or partially ordered) system. Among the possible mechanisms of such a disorder one can consider the so-called D-strain—distributed zero field interaction [31] or, in other words, slight differences in zero field splitting parameters in SH of NV− centers in various micro- and nano-crystallites. These differences may be either intrinsic or induced by processing, such as milling or surface treatment. Figure 6(e) shows changes in the above mentioned simulated EPR spectra as a function of D-strain, ΔD, obtained at fixed individual line width ΔHppLorentz = 0.57 mT. Figure 6(e) shows that appearance of D-strain broadens the 'allowed' line and, correspondingly, decreases its peak intensity more effectively than the 'forbidden' one. By comparing the experimental spectra of figures 6(b) and (c) with those extracted from the simulations, one can find that in the starting irradiated/annealed FMD sample the distributed zero-field splitting is ΔD ~ 0.0010 cm−1.
This is the natural D-strain resulting from irradiation/annealing. Milling induces intensification of the D-strain to ~0.0020 cm−1. However, for smaller nano-particles obtained by fractionation—fFND sample, the D-strain model stops working. Indeed, in spite of an almost threefold broadening (in comparison with the starting FMD sample) of the 'allowed' line, the 'forbidden' line remains quite narrow—see figure 6(c). One can suppose that in small (size <20 nm) nano-particles carrying, in addition to NV− centers, dozens of other paramagnetic centers (like dangling bonds) and other mechanisms of inhomogeneous line broadening take place.
4.6. Hydrogen in fluorescent diamonds
The absence of NMR-detectable proton signals in the initial MD and irradiated/annealed FMD samples undoubtedly indicates that both the surface and bulk of these micro-diamond particles contain bound hydrogen in quantities below the detection threshold of the solid state NMR machine in use. It should be noted that surface of these micron-sized crystallites seems to be hydrophobic and can even contain no detectable water molecules, which usually provide relatively narrow (and, thus, easily observed) 1H NMR lines. On the other hand, samples which have undergone milling and subsequent processing/fractionation do show well observable 1H NMR signals, which indicates a modification of their surfaces. Thus, the surfaces of FND, cFND and fFND show clear hydrophilic properties—they adsorb water molecules, which are responsible for the narrow 1H NMR lines in figure S4(c), (stacks.iop.org/JPhysD/48/155302) (blue and magenta traces, correspondingly) as well as for the single exponential magnetization recovery. This hydrophilic character is likely to come from carboxylic groups produced during the chemical decontamination procedure. The same treatment also produces hydroxyl groups, which together with carboxylic groups are necessary to stabilize aqueous NDs suspension. In contrast to FND, cFND, and fFND, ND displays a broad 1H NMR line in the sample, indicating the presence of dipole–dipole coupling of proton spins, which means that the surface of this nanodiamond is partially terminated by hydrogen atoms forming rigid hydrocarbon and hydroxyl groups. This 1H NMR line broadening is characteristic of NDs, in which hydrogen atoms at the surface are irregularly positioned, presumably forming more hydrogenated spots of limited sizes alternating with less hydrogenated or nearly non-hydrogenated zones [28]. Moreover, the width of the 1H NMR line in the ND sample is found to be dependent on the delay between the echo pulses (τd) and decreases with increasing τd—see the green and olive traces in figure S4(c), (stacks.iop.org/JPhysD/48/155302). Such a behavior of the NMR spectrum may be described in terms of the superposition of a variety of components showing different widths and T2. For the long τd, the broad components with short T2 are dephased and are thus not observed in the experiment [32]. The contribution of the long T2 proton species to the entire NMR signal is relatively small: the long τd spectrum (olive trace) in figure S4(c), (stacks.iop.org/JPhysD/48/155302) was recorded at tenfold increased number of coherent acquisitions compared to the spectrum measured with short τd. By comparing proton NMR data in the ND and FND samples of the same particle sizes (they passed through the same micronization), one can conclude that the surfaces in these samples are different. We suggest that this difference is due to the FND irradiation/annealing treatment. This treatment somehow reconstructs the surface of the diamond particles, making them more hydrophilic, i.e. with a higher (comparing to ND) content of carboxylic group, and receptive to ambient humidity.
5. Conclusions
We conclude that magnetic resonance techniques are powerful and reliable tools for accurate step-by-step tracking of complex changes in the purity, magnetic, and structural properties of synthetic HPHT micron sized diamonds that occur in the process of fabrication of fluorescent diamond nanocrystals. EPR reliably reveals the characteristic signatures of NV− triplet (S = 1) defects induced by high-energy electron irradiation in non-fluorescent MDs and tracks the transformation of these defects during two-stage milling and fractionation. The concentration of NV− defects in irradiated/annealed MD sample is 5.4 × 10¹⁷ spins/g. It is shown that in the coarse fractions of milled fluorescent nanodiamonds the concentration of EPR-active NV− defects drops down by 30% whereas in the finest fraction the same concentration drops by one order of magnitude. The latter fact allows determination of the lower size limit in fabrication of fluorescent ND particles and, thus, is of the high technological importance [33]. Our results are consistent with single particle fluorescence measurements. Moreover, they indicate that to efficiently create fluorescent nanodiamonds with size <10 nm, it is necessary to have several times higher concentration of NV− defects than that obtained by irradiation/annealing of commercial HPHT MDs having regular nitrogen concentration of ~150 ppm. In addition we observed that the increase of the specific surface area of diamond particles increases the amount of carbon-inherited singlet (S = 1/2) paramagnetic defects (up to 1.6 × 10¹⁹ spins/g in the fine fluorescent ND fraction), as well as carbon-inherited triplet multivacancy defects. We ascertained that, on reduction of the particle size below the 20 nm limit, the EPR lines corresponding to 'allowed' transitions in spectra of NV− centers become practically unobservable, whereas the 'forbidden' lines remain as a reliable fingerprint of the presence of NV− centers in small nanodiamond systems. The same reduction causes the disappearance of characteristic hyperfine satellites in the spectra of the P1 centers. This study clearly shows that magnetic resonance techniques being applied to polycrystalline diamond samples should provide a convenient quantitative approach for the optimization of each step of the synthesis (and further to the industrial scaling of fabrication) of fluorescent nanodiamonds, aiming their applications towards optical imaging and magnetic sensing.
Acknowledgments
This work was supported by the European Commission through the project 'Nano4Drugs' (contract LSHB-2005-CT-019102) and Israeli Ministry of Science, Technology and Space (contract 3-9754). VYuO. and AYaV thank Russian Foundation of Basic Research (RFBR 13-03-12421 ofi-m) for partial support of this research. The authors acknowledge Prof Dr F Jelezko (Institute for Quantum Optics, Ulm University) for designing the electron irradiation experiments and fruitful discussions. We also thank Prof S D Goren (Department of Physics, BGU, Israel) for participation in NMR study and fruitful discussions.
Notes added in proof. As has been shown in [22], the effective g-factor of the 'forbidden' line in EPR spectra of polycrystalline diamonds containing NV− depends on the actual value of microwave frequency. Thus, the characteristic X-band feature, designated in this study as 'g = 4.26 line' reveals the aforementioned g = 4.26(1) value only when the microwave frequency applied is nearby 9.4 GHz. However, X-band EPR spectrometers, depending on resonators and temperature inserts in use may operate at frequencies within the 9 ÷ 10 GHz band. Thus, the real values of the effective g-factor corresponding to the same 'forbidden' line, being measured at frequencies significantly different from 9.4 GHz, will deviate from the 'g = 4.26' value outside the experimental error values presented in this study.
Footnotes
- 6
Here it is worth mentioning that the actual EPR spectrum of this sample consisting of MD crystallites is of quasi-polycrystalline type (partially oriented) and, in addition to the main true polycrystalline features, some less intense features appear on the wings of hyperfine ΔmI = ±1 zz-components and around the sharp central ΔmI = 0 component—due to angular dependent 'allowed' hyperfine transitions originating from large crystallites.
- 7
Additional less intense features on the higher-field wing of the g = 4.26 signal in the spectrum of FMD (figure 4(b)) appear due to the quasi-polycrystalline origin of this sample, which has been discussed above.